Insurance Risk Study - Aon
Insurance Risk Study - Aon
Insurance Risk Study - Aon

You also want an ePaper? Increase the reach of your titles
YUMPU automatically turns print PDFs into web optimized ePapers that Google loves.
<strong>Insurance</strong> <strong>Risk</strong> <strong>Study</strong><br />
U.S. <strong>Risk</strong> Parameters<br />
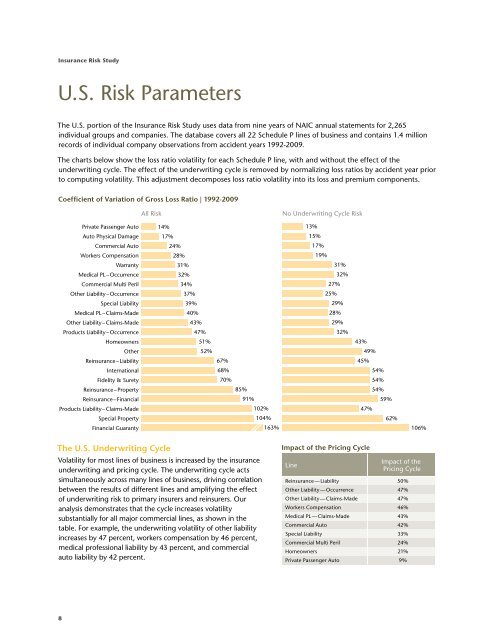
The U.S. portion of the <strong>Insurance</strong> <strong>Risk</strong> <strong>Study</strong> uses data from nine years of NAIC annual statements for 2,265<br />
individual groups and companies. The database covers all 22 Schedule P lines of business and contains 1.4 million<br />
records of individual company observations from accident years 1992-2009.<br />
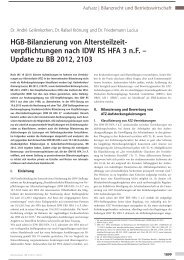
The charts below show the loss ratio volatility for each Schedule P line, with and without the effect of the<br />
underwriting cycle. The effect of the underwriting cycle is removed by normalizing loss ratios by accident year prior<br />
to computing volatility. This adjustment decomposes loss ratio volatility into its loss and premium components.<br />
Coefficient of Variation of Gross Loss Ratio | 1992-2009<br />
Products Liability – Claims-Made<br />
8<br />
Private Passenger Auto 14%<br />
Auto Physical Damage<br />
Commercial Auto<br />
Workers Compensation<br />
Warranty<br />
Medical PL – Occurrence<br />
Commercial Multi Peril<br />
Other Liability – Occurrence<br />
Special Liability<br />
Medical PL – Claims-Made<br />
Other Liability – Claims-Made<br />
Products Liability – Occurrence<br />
Homeowners<br />
Other<br />
Reinsurance – Liability<br />
International<br />
Fidelity & Surety<br />
Reinsurance – Property<br />
Reinsurance – Financial<br />
Special Property<br />
Financial Guaranty<br />
All <strong>Risk</strong> No Underwriting Cycle <strong>Risk</strong><br />
17%<br />
24%<br />
28%<br />
31%<br />
32%<br />
34%<br />
37%<br />
39%<br />
40%<br />
43%<br />
47%<br />
51%<br />
52%<br />
67%<br />
68%<br />
70%<br />
85%<br />
91%<br />
102%<br />
The U.S. Underwriting Cycle<br />
Volatility for most lines of business is increased by the insurance<br />
underwriting and pricing cycle. The underwriting cycle acts<br />
simultaneously across many lines of business, driving correlation<br />
between the results of different lines and amplifying the effect<br />
of underwriting risk to primary insurers and reinsurers. Our<br />
analysis demonstrates that the cycle increases volatility<br />
substantially for all major commercial lines, as shown in the<br />
table. For example, the underwriting volatility of other liability<br />
increases by 47 percent, workers compensation by 46 percent,<br />
medical professional liability by 43 percent, and commercial<br />
auto liability by 42 percent.<br />
104%<br />
163%<br />
13%<br />
15%<br />
17%<br />
19%<br />
31%<br />
27%<br />
25%<br />
32%<br />
29%<br />
28%<br />
29%<br />
32%<br />
43%<br />
45%<br />
49%<br />
Impact of the Pricing Cycle<br />
Line<br />
54%<br />
54%<br />
54%<br />
59%<br />
47%<br />
62%<br />
106%<br />
Impact of the<br />
Pricing Cycle<br />
Reinsurance — Liability 50%<br />
Other Liability — Occurrence 47%<br />
Other Liability — Claims-Made 47%<br />
Workers Compensation 46%<br />
Medical PL — Claims-Made 43%<br />
Commercial Auto 42%<br />
Special Liability 33%<br />
Commercial Multi Peril 24%<br />
Homeowners 21%<br />
Private Passenger Auto 9%