PZ004 - KEK
PZ004 - KEK
PZ004 - KEK

Create successful ePaper yourself
Turn your PDF publications into a flip-book with our unique Google optimized e-Paper software.
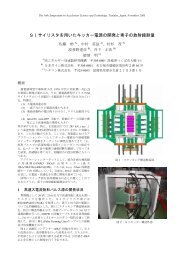
4 HIGH POWER TEST<br />
IOT (Inductive Output Tube) was adapted for an RF<br />
power source. To obtain the stable RF pulse, PLL and<br />
ALC system, which is for RF control of TRISTAN’s<br />
superconducting cavity, were prepared. The vacuum<br />
system consists of a turbo molecular pump and a rotary<br />
pump. A vacuum sensor and an arc sensor are located the<br />
side of each window. One can observe the partial pressure<br />
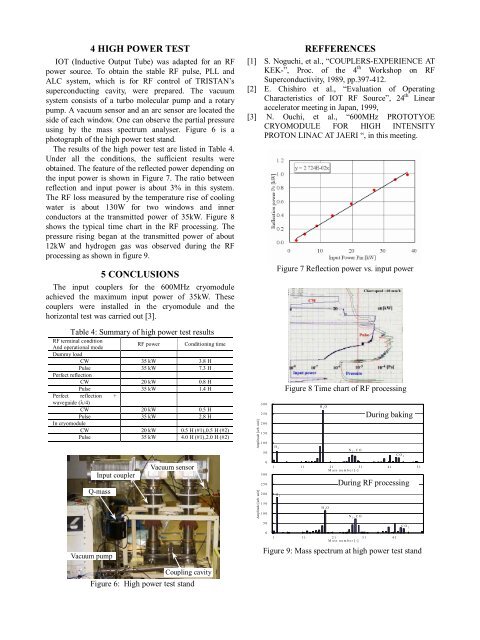
using by the mass spectrum analyser. Figure 6 is a<br />
photograph of the high power test stand.<br />
The results of the high power test are listed in Table 4.<br />
Under all the conditions, the sufficient results were<br />
obtained. The feature of the reflected power depending on<br />
the input power is shown in Figure 7. The ratio between<br />
reflection and input power is about 3% in this system.<br />
The RF loss measured by the temperature rise of cooling<br />
water is about 130W for two windows and inner<br />
conductors at the transmitted power of 35kW. Figure 8<br />
shows the typical time chart in the RF processing. The<br />
pressure rising began at the transmitted power of about<br />
12kW and hydrogen gas was observed during the RF<br />
processing as shown in figure 9.<br />
5 CONCLUSIONS<br />
The input couplers for the 600MHz cryomodule<br />
achieved the maximum input power of 35kW. These<br />
couplers were installed in the cryomodule and the<br />
horizontal test was carried out [3].<br />
Table 4: Summary of high power test results<br />
RF terminal condition<br />
And operational mode<br />
Dummy load<br />
RF power Conditioning time<br />
CW 35 kW 3.8 H<br />
Pulse<br />
Perfect reflection<br />
35 kW 7.3 H<br />
CW 20 kW 0.8 H<br />
Pulse 35 kW 1.4 H<br />
Perfect reflection +<br />
waveguide (λ/4)<br />
CW 20 kW 0.5 H<br />
Pulse<br />
In cryomodule<br />
35 kW 2.8 H<br />
CW 20 kW 0.5 H (#1),0.5 H (#2)<br />
Pulse 35 kW 4.0 H (#1),2.0 H (#2)<br />
Input coupler<br />
Q-mass<br />
Vacuum pump<br />
Vacuum sensor<br />
Coupling cavity<br />
Figure 6: High power test stand<br />
REFFERENCES<br />
[1] S. Noguchi, et al., “COUPLERS-EXPERIENCE AT<br />
<strong>KEK</strong>-”, Proc. of the 4 th Workshop on RF<br />
Superconductivity, 1989, pp.397-412.<br />
[2] E. Chishiro et al., “Evaluation of Operating<br />
Characteristics of IOT RF Source”, 24 th Linear<br />
accelerator meeting in Japan, 1999,<br />
[3] N. Ouchi, et al., “600MHz PROTOTYOE<br />
CRYOMODULE FOR HIGH INTENSITY<br />
PROTON LINAC AT JAERI “, in this meeting.<br />
Amplitude [arb. unit]<br />
Amplitude [arb. unit]<br />
300<br />
250<br />
200<br />
150<br />
100<br />
50<br />
0<br />
300<br />
250<br />
200<br />
150<br />
100<br />
50<br />
0<br />
H 2<br />
Figure 7 Reflection power vs. input power<br />
Figure 8 Time chart of RF processing<br />
H 2 O<br />
N 2 ,CO<br />
CO 2<br />
1 11 21 31 41 51<br />
M ass number [-]<br />
H 2<br />
H 2 O<br />
N 2 ,CO<br />
During baking<br />
During RF processing<br />
1 11 21 31 41<br />
M ass number [-]<br />
Figure 9: Mass spectrum at high power test stand<br />
CO 2