Naas Town Council Development Plan 2005 - Kildare.ie
Naas Town Council Development Plan 2005 - Kildare.ie
Naas Town Council Development Plan 2005 - Kildare.ie

Create successful ePaper yourself
Turn your PDF publications into a flip-book with our unique Google optimized e-Paper software.
2.4 Identification of Affordability Thresholds<br />
In order to determine housing affordability it has been necessary in sections 2.1 through 2.3 to<br />
analyse county-level estimates of population, household size, household income, and house<br />
prices.<br />
The purpose of the analysis is to identify the most expensive house that various households,<br />
of varying income, can afford to purchase, and the number of houses that are likely to be<br />
suppl<strong>ie</strong>d in each price range or price band.<br />
The <strong>Plan</strong>ning and <strong>Development</strong> Act (Section 93(1)) sets out the parameters that need to be<br />
appl<strong>ie</strong>d. These are as follows:<br />
* yearly loan repayment is less than or equal to 35% of annual income, net of income tax and<br />
pay related insurance; and<br />
* the loan to value ratio should not exceed 90%.<br />
A number of assumptions are also made, including a 25-year term, and an APR of 6%. This<br />
APR is recommended in the DoELG circular of 26th February (HS 3/01, Appendix 3).<br />
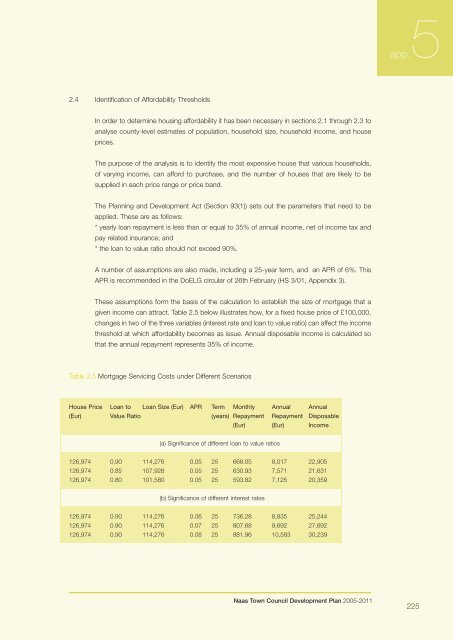
These assumptions form the basis of the calculation to establish the size of mortgage that a<br />
given income can attract. Table 2.5 below illustrates how, for a fixed house price of £100,000,<br />
changes in two of the three variables (interest rate and loan to value ratio) can affect the income<br />
threshold at which affordability becomes as issue. Annual disposable income is calculated so<br />
that the annual repayment represents 35% of income.<br />
Table 2.5 Mortgage Servicing Costs under Different Scenarios<br />
House Price Loan to Loan Size (Eur) APR Term Monthly Annual Annual<br />
(Eur) Value Ratio (years) Repayment Repayment Disposable<br />
(Eur) (Eur) Income<br />
(a) Significance of different loan to value ratios<br />
126,974 0.90 114,276 0.05 25 668.05 8,017 22,905<br />
126,974 0.85 107,928 0.05 25 630.93 7,571 21,631<br />
126,974 0.80 101,580 0.05 25 593.82 7,125 20,359<br />
(b) Significance of different interest rates<br />
126,974 0.90 114,276 0.06 25 736.28 8,835 25,244<br />
126,974 0.90 114,276 0.07 25 807.68 9,692 27,692<br />
126,974 0.90 114,276 0.08 25 881.96 10,583 30,239<br />
<strong>Naas</strong> <strong>Town</strong> <strong>Council</strong> <strong>Development</strong> <strong>Plan</strong> <strong>2005</strong>-2011<br />
app.5<br />
225