Dr. Alfredo Mahar Francisco A. Lagmay - University of the ...
Dr. Alfredo Mahar Francisco A. Lagmay - University of the ...
Dr. Alfredo Mahar Francisco A. Lagmay - University of the ...

Create successful ePaper yourself
Turn your PDF publications into a flip-book with our unique Google optimized e-Paper software.
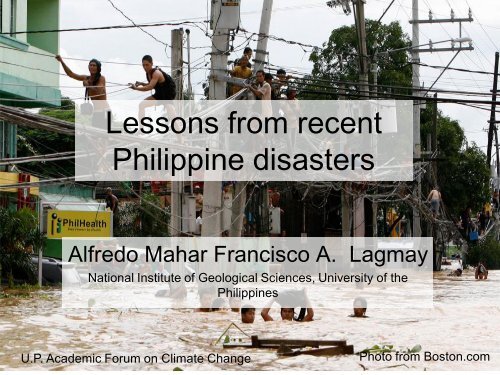
Lessons from recent<br />
Philippine disasters<br />
<strong>Alfredo</strong> <strong>Mahar</strong> <strong>Francisco</strong> A. <strong>Lagmay</strong><br />
National Institute <strong>of</strong> Geological Sciences, <strong>University</strong> <strong>of</strong> <strong>the</strong><br />
Philippines<br />
U.P. Academic Forum on Climate Change<br />
Photo from Boston.com
Dec 2005 Typhoon Quedon<br />
Mindoro Flooding US$ 0.5 million
Feb. 17, 2006 Guinsaugon landslide 1126 dead US$ 2.203 million
Guinsaugon<br />
Population = 1,857
Nov. 30, 2006 Typhoon Durian 1399 dead US$ 66.4 million
Guinobatan<br />
Camalig<br />
Daraga<br />
Bongga<br />
Basud<br />
Padang
June 20, 2008 Typhoon Fenshen 644 dead US$ 135 million
Advanced technologies needed for<br />
disaster mitigation<br />
1. Timely and accurate prediction <strong>of</strong> rainfall<br />
(TRMM and automated rain/river<br />
gauges)<br />
2. Accurate Topography<br />
(Light Detection and Ranging)
Tropical Rainfall Mapping Mission<br />
• Armed with both a passive microwave<br />
sensor and a space-borne precipitation<br />
radar<br />
• The primary objective <strong>of</strong> <strong>the</strong> Tropical<br />
Rainfall Measuring Mission satellite (better<br />
known as TRMM) is to measure rainfall<br />
from space.
NASA SATELLITE GREATLY IMPROVES<br />
ACCURACY OF TROPICAL RAINFALL<br />
FORECASTING<br />
NASA, Jan 12, 2000 by David E. Steitz, Allen Kenitzer, Stephanie Kenitzer<br />
New research shows that adding rainfall<br />
data from NASA's Tropical Rainfall<br />
Measuring Mission (TRMM) satellite and<br />
o<strong>the</strong>r meteorological satellites to forecast<br />
models can more than triple <strong>the</strong> accuracy<br />
<strong>of</strong> short-term rainfall forecasts.<br />
These model properties are <strong>the</strong>n used to<br />
predict <strong>the</strong> rainfall for three days into <strong>the</strong><br />
future, with remarkable success.
TRMM uses<br />
• Alternative and supplement to groundbased<br />
observations for cost-effective flood<br />
prediction in under-gauged regions<br />
• NASA Applied Science Program in<br />
partnership with USAID and African-<br />
RCMRD to implement an operational<br />
water-hazard warning system<br />
• To build disaster management capacity
Latest 3 Hourly Global Rainfall
Latest Week <strong>of</strong> Global Rainfall<br />
Accumulation
Latest hurricanes and typhoons<br />
observed by <strong>the</strong> TRMM satellite.
Telemetric rain gauge data sent<br />
directly to NASA ground validation<br />
team via <strong>the</strong> internet<br />
Designs <strong>of</strong> UP (CP David)<br />
and Ateneo (MO)<br />
To be put in cell phone<br />
towers and churches.<br />
+ project rain gauge
Hazard map scales<br />
National Scale<br />
• 1:50,000-1:100,000<br />
• Accuracy is low -<br />
Whole river basin<br />
• Broad scale planning for major<br />
emergencies<br />
• Members <strong>of</strong> public are<br />
interested in flood risk that<br />
applies to <strong>the</strong>m<br />
Local scale<br />
• 1:5,000 to 1:25,000<br />
• Accuracy is high - Cadastral<br />
level; Lidar<br />
• Planning <strong>of</strong> localised<br />
emergency response (i.e.<br />
evacuation and access routes,<br />
road closures)<br />
• Public awareness
Accurate local level,<br />
high resolution<br />
hazard maps is a<br />
key element to effective<br />
disaster preparedness!
Al Duncan, Geomatic Group, UK<br />
2m Resolution<br />
LIDAR DSM
Al Duncan, Geomatic Group, UK<br />
1m Resolution<br />
LIDAR DSM
Al Duncan, Geomatic Group, UK<br />
50cm Resolution<br />
LIDAR DSM
Al Duncan, Geomatic Group, UK<br />
25cm Resolution<br />
LIDAR DSM
Al Duncan, Geomatic Group, UK
Al Duncan, Geomatic Group, UK
Optech Lynx<br />
Mobile Mapper<br />
Al Duncan, Geomatic Group, UK<br />
Mobile<br />
Terrestrial<br />
LIDAR
Al Duncan, Geomatic Group, UK
United Kingdom Philippines<br />
Al Duncan, Geomatic Group, UK
Flood risk model, 48 hour event<br />
(Model type = 2D, Tuflow model, 1m resolution LIDAR data used)<br />
Al Duncan, Geomatic Group, UK<br />
Integrated spatial data
Modelling Flood Depth<br />
Al Duncan, Geomatic Group, UK
Modelling Flood Velocity<br />
Al Duncan, Geomatic Group, UK
Scenario 6: Fluvial Flood Model – 7 Return Periods<br />
Viewpoint A<br />
X = 542290<br />
Y = 108900<br />
Z = 400m<br />
Direction 346<br />
© Crown Copyright. All rights reserved. Environment Agency, 100026380, 2009.<br />
Integrated spatial data
Scenario 2: Fluvial 1 in 2 year, Tidal 1 in 200 year, Plus Climate Change<br />
Viewpoint A<br />
X = 542290<br />
Y = 108900<br />
Z = 400m<br />
Direction 346<br />
© Crown Copyright. All rights reserved. Environment Agency, 100026380, 2009.<br />
Integrated spatial data
Scenario 1: Fluvial 1 in 2 year, Tidal 1 in 200 year<br />
Viewpoint A<br />
X = 542290<br />
Y = 108900<br />
Z = 400m<br />
Direction 346<br />
© Crown Copyright. All rights reserved. Environment Agency, 100026380, 2009.<br />
Integrated spatial data
Scenario 3: Fluvial 1 in 100 year, MHWS Tide<br />
Viewpoint A<br />
X = 542290<br />
Y = 108900<br />
Z = 400m<br />
Direction 346<br />
© Crown Copyright. All rights reserved. Environment Agency, 100026380, 2009.<br />
Integrated spatial data
Scenario 4: Fluvial 1 in 100 year, MHWS Tide, Plus Climate Change<br />
Viewpoint A<br />
X = 542290<br />
Y = 108900<br />
Z = 400m<br />
Direction 346<br />
© Crown Copyright. All rights reserved. Environment Agency, 100026380, 2009.<br />
Integrated spatial data
Scenario 5: Flood Zones Map – 1 in 1,000 year modelled flood<br />
Viewpoint A<br />
X = 542290<br />
Y = 108900<br />
Z = 400m<br />
Direction 346<br />
© Crown Copyright. All rights reserved. Environment Agency, 100026380, 2009.<br />
Integrated spatial data
GIS enabled website – OS Topographic Map
GIS enabled website – Aerial Photography
GIS enabled website – Historic Flood Map
GIS enabled website – Modelled Flood Map
Investing in knowledge<br />
• Space-based radar, automated rain/river<br />
gauge systems and LIDAR are all readily<br />
available.<br />
• Any serious hazard mitigation program<br />
would have to capitalize on <strong>the</strong>se<br />
technologies.