Assessment of European streams with diatoms, macrophytes ...
Assessment of European streams with diatoms, macrophytes ...
Assessment of European streams with diatoms, macrophytes ...

Create successful ePaper yourself
Turn your PDF publications into a flip-book with our unique Google optimized e-Paper software.
1768 D. Hering et al.<br />
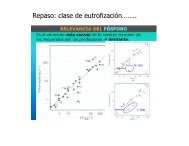
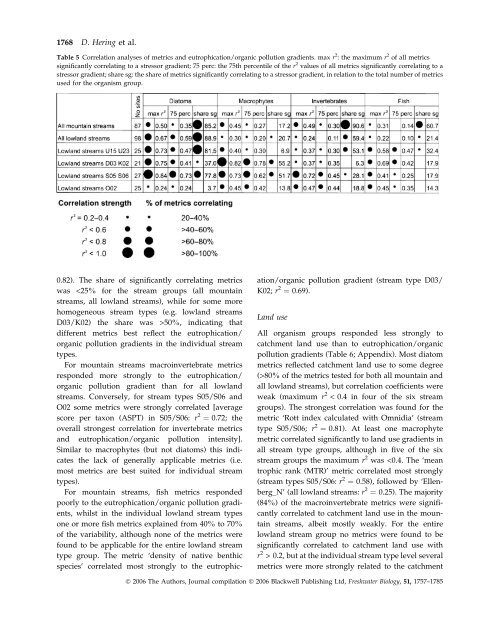
Table 5 Correlation analyses <strong>of</strong> metrics and eutrophication/organic pollution gradients. max r 2 : the maximum r 2 <strong>of</strong> all metrics<br />
significantly correlating to a stressor gradient; 75 perc: the 75th percentile <strong>of</strong> the r 2 values <strong>of</strong> all metrics significantly correlating to a<br />
stressor gradient; share sg: the share <strong>of</strong> metrics significantly correlating to a stressor gradient, in relation to the total number <strong>of</strong> metrics<br />
used for the organism group.<br />
0.82). The share <strong>of</strong> significantly correlating metrics<br />
was 50%, indicating that<br />
different metrics best reflect the eutrophication/<br />
organic pollution gradients in the individual stream<br />
types.<br />
For mountain <strong>streams</strong> macroinvertebrate metrics<br />
responded more strongly to the eutrophication/<br />
organic pollution gradient than for all lowland<br />
<strong>streams</strong>. Conversely, for stream types S05/S06 and<br />
O02 some metrics were strongly correlated [average<br />
score per taxon (ASPT) in S05/S06: r 2 ¼ 0.72; the<br />
overall strongest correlation for invertebrate metrics<br />
and eutrophication/organic pollution intensity].<br />
Similar to <strong>macrophytes</strong> (but not <strong>diatoms</strong>) this indicates<br />
the lack <strong>of</strong> generally applicable metrics (i.e.<br />
most metrics are best suited for individual stream<br />
types).<br />
For mountain <strong>streams</strong>, fish metrics responded<br />
poorly to the eutrophication/organic pollution gradients,<br />
whilst in the individual lowland stream types<br />
one or more fish metrics explained from 40% to 70%<br />
<strong>of</strong> the variability, although none <strong>of</strong> the metrics were<br />
found to be applicable for the entire lowland stream<br />
type group. The metric ‘density <strong>of</strong> native benthic<br />
species’ correlated most strongly to the eutrophic-<br />
ation/organic pollution gradient (stream type D03/<br />
K02; r 2 ¼ 0.69).<br />
Land use<br />
All organism groups responded less strongly to<br />
catchment land use than to eutrophication/organic<br />
pollution gradients (Table 6; Appendix). Most diatom<br />
metrics reflected catchment land use to some degree<br />
(>80% <strong>of</strong> the metrics tested for both all mountain and<br />
all lowland <strong>streams</strong>), but correlation coefficients were<br />
weak (maximum r 2 < 0.4 in four <strong>of</strong> the six stream<br />
groups). The strongest correlation was found for the<br />
metric ‘Rott index calculated <strong>with</strong> Omnidia’ (stream<br />
type S05/S06; r 2 ¼ 0.81). At least one macrophyte<br />
metric correlated significantly to land use gradients in<br />
all stream type groups, although in five <strong>of</strong> the six<br />
stream groups the maximum r 2 was 0.2, but at the individual stream type level several<br />
metrics were more strongly related to the catchment<br />
Ó 2006 The Authors, Journal compilation Ó 2006 Blackwell Publishing Ltd, Freshwater Biology, 51, 1757–1785