A Comparison of Bird Detection Rates Derived from On-Road vs. Off ...
A Comparison of Bird Detection Rates Derived from On-Road vs. Off ...
A Comparison of Bird Detection Rates Derived from On-Road vs. Off ...

Create successful ePaper yourself
Turn your PDF publications into a flip-book with our unique Google optimized e-Paper software.
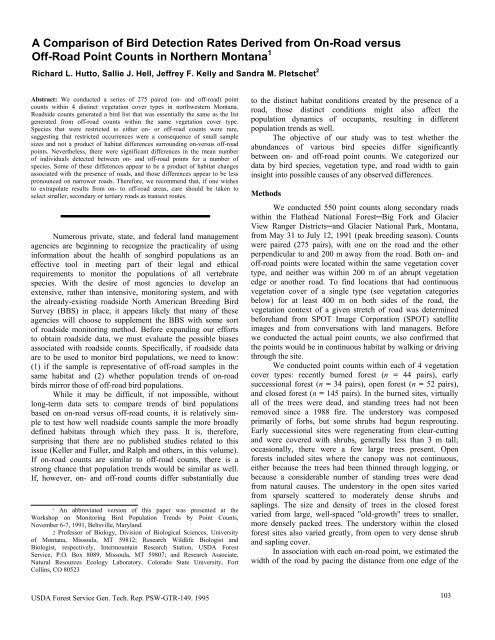
A <strong>Comparison</strong> <strong>of</strong> <strong>Bird</strong> <strong>Detection</strong> <strong>Rates</strong> <strong>Derived</strong> <strong>from</strong> <strong>On</strong>-<strong>Road</strong> versus<br />
<strong>Off</strong>-<strong>Road</strong> Point Counts in Northern Montana 1<br />
Richard L. Hutto, Sallie J. Hell, Jeffrey F. Kelly and Sandra M. Pletschet 2<br />
Abstract: We conducted a series <strong>of</strong> 275 paired (on- and <strong>of</strong>f-road) point<br />
counts within 4 distinct vegetation cover types in northwestern Montana.<br />
<strong>Road</strong>side counts generated a bird list that was essentially the same as the list<br />
generated <strong>from</strong> <strong>of</strong>f-road counts within the same vegetation cover type.<br />
Species that were restricted to either on- or <strong>of</strong>f-road counts were rare,<br />
suggesting that restricted occurrences were a consequence <strong>of</strong> small sample<br />
sizes and not a product <strong>of</strong> habitat differences surrounding on-versus <strong>of</strong>f-road<br />
points. Nevertheless, there were significant differences in the mean number<br />
<strong>of</strong> individuals detected between on- and <strong>of</strong>f-road points for a number <strong>of</strong><br />
species. Some <strong>of</strong> these differences appear to be a product <strong>of</strong> habitat changes<br />
associated with the presence <strong>of</strong> roads, and those differences appear to be less<br />
pronounced on narrower roads. Therefore, we recommend that, if one wishes<br />
to extrapolate results <strong>from</strong> on- to <strong>of</strong>f-road areas, care should be taken to<br />
select smaller, secondary or tertiary roads as transect routes.<br />
Numerous private, state, and federal land management<br />
agencies are beginning to recognize the practicality <strong>of</strong> using<br />
information about the health <strong>of</strong> songbird populations as an<br />
effective tool in meeting part <strong>of</strong> their legal and ethical<br />
requirements to monitor the populations <strong>of</strong> all vertebrate<br />
species. With the desire <strong>of</strong> most agencies to develop an<br />
extensive, rather than intensive, monitoring system, and with<br />
the already-existing roadside North American Breeding <strong>Bird</strong><br />
Survey (BBS) in place, it appears likely that many <strong>of</strong> these<br />
agencies will choose to supplement the BBS with some sort<br />
<strong>of</strong> roadside monitoring method. Before expanding our efforts<br />
to obtain roadside data, we must evaluate the possible biases<br />
associated with roadside counts. Specifically, if roadside data<br />
are to be used to monitor bird populations, we need to know:<br />
(1) if the sample is representative <strong>of</strong> <strong>of</strong>f-road samples in the<br />
same habitat and (2) whether population trends <strong>of</strong> on-road<br />
birds mirror those <strong>of</strong> <strong>of</strong>f-road bird populations.<br />
While it may be difficult, if not impossible, without<br />
long-term data sets to compare trends <strong>of</strong> bird populations<br />
based on on-road versus <strong>of</strong>f-road counts, it is relatively sim-<br />
ple to test how well roadside counts sample the more broadly<br />
defined habitats through which they pass. It is, therefore,<br />
surprising that there are no published studies related to this<br />
issue (Keller and Fuller, and Ralph and others, in this volume).<br />
If on-road counts are similar to <strong>of</strong>f-road counts, there is a<br />
strong chance that population trends would be similar as well.<br />
If, however, on- and <strong>of</strong>f-road counts differ substantially due<br />
1 An abbreviated version <strong>of</strong> this paper was presented at the<br />
Workshop on Monitoring <strong>Bird</strong> Population Trends by Point Counts,<br />
November 6-7, 1991, Beltsville, Maryland.<br />
2 Pr<strong>of</strong>essor <strong>of</strong> Biology, Division <strong>of</strong> Biological Sciences, University<br />
<strong>of</strong> Montana, Missoula, MT 59812; Research Wildlife Biologist and<br />
Biologist, respectively, Intermountain Research Station, USDA Forest<br />
Service, P.O. Box 8089, Missoula, MT 59807; and Research Associate,<br />
Natural Resources Ecology Laboratory, Colorado State University, Fort<br />
Collins, CO 80523<br />
USDA Forest Service Gen. Tech. Rep. PSW-GTR-149. 1995<br />
to the distinct habitat conditions created by the presence <strong>of</strong> a<br />
road, those distinct conditions might also affect the<br />
population dynamics <strong>of</strong> occupants, resulting in different<br />
population trends as well.<br />
The objective <strong>of</strong> our study was to test whether the<br />
abundances <strong>of</strong> various bird species differ significantly<br />
between on- and <strong>of</strong>f-road point counts. We categorized our<br />
data by bird species, vegetation type, and road width to gain<br />
insight into possible causes <strong>of</strong> any observed differences.<br />
Methods<br />
We conducted 550 point counts along secondary roads<br />
within the Flathead National Forest─Big Fork and Glacier<br />
View Ranger Districts─and Glacier National Park, Montana,<br />
<strong>from</strong> May 31 to July 12, 1991 (peak breeding season). Counts<br />
were paired (275 pairs), with one on the road and the other<br />
perpendicular to and 200 m away <strong>from</strong> the road. Both on- and<br />
<strong>of</strong>f-road points were located within the same vegetation cover<br />
type, and neither was within 200 m <strong>of</strong> an abrupt vegetation<br />
edge or another road. To find locations that had continuous<br />
vegetation cover <strong>of</strong> a single type (see vegetation categories<br />
below) for at least 400 m on both sides <strong>of</strong> the road, the<br />
vegetation context <strong>of</strong> a given stretch <strong>of</strong> road was determined<br />
beforehand <strong>from</strong> SPOT Image Corporation (SPOT) satellite<br />
images and <strong>from</strong> conversations with land managers. Before<br />
we conducted the actual point counts, we also confirmed that<br />
the points would be in continuous habitat by walking or driving<br />
through the site.<br />
We conducted point counts within each <strong>of</strong> 4 vegetation<br />
cover types: recently burned forest (n = 44 pairs), early<br />
successional forest (n = 34 pairs), open forest (n = 52 pairs),<br />
and closed forest (n = 145 pairs). In the burned sites, virtually<br />
all <strong>of</strong> the trees were dead, and standing trees had not been<br />
removed since a 1988 fire. The understory was composed<br />
primarily <strong>of</strong> forbs, but some shrubs had begun resprouting.<br />
Early successional sites were regenerating <strong>from</strong> clear-cutting<br />
and were covered with shrubs, generally less than 3 m tall;<br />
occasionally, there were a few large trees present. Open<br />
forests included sites where the canopy was not continuous,<br />
either because the trees had been thinned through logging, or<br />
because a considerable number <strong>of</strong> standing trees were dead<br />
<strong>from</strong> natural causes. The understory in the open sites varied<br />
<strong>from</strong> sparsely scattered to moderately dense shrubs and<br />
saplings. The size and density <strong>of</strong> trees in the closed forest<br />
varied <strong>from</strong> large, well-spaced "old-growth" trees to smaller,<br />
more densely packed trees. The understory within the closed<br />
forest sites also varied greatly, <strong>from</strong> open to very dense shrub<br />
and sapling cover.<br />
In association with each on-road point, we estimated the<br />
width <strong>of</strong> the road by pacing the distance <strong>from</strong> one edge <strong>of</strong> the<br />
103
A <strong>Comparison</strong> <strong>of</strong> <strong>Bird</strong> <strong>Detection</strong> <strong>Rates</strong>: <strong>On</strong>-<strong>Road</strong> Versus <strong>Off</strong>-<strong>Road</strong> Richard L. Hutto and others<br />
graded portion to the other. The distribution <strong>of</strong> road widths<br />
was distinctly bimodal, with the majority being less than 10 m<br />
wide. <strong>Road</strong>s less than 10 m wide were classified as "narrow,"<br />
and those greater than 10 m wide were classified as "wide."<br />
Two observers used 10-minute, fixed-radius plots to<br />
record all birds detected within each <strong>of</strong> two distance<br />
categories: within 50 m, and between 50 and 100 m. Visual<br />
cues, calls, and songs were used to identify bird species.<br />
Point counts were begun about 15 minutes after sunrise and<br />
ended before the midday lull in bird activity, generally before<br />
1030. Points were placed at 200-m intervals along roads, and<br />
observer bias was controlled by alternating the two observers<br />
between on- and <strong>of</strong>f-road counts.<br />
To compare on- and <strong>of</strong>f-road bird communities, we<br />
used the Wilcoxon matched-pairs signed-ranks test on<br />
measures <strong>of</strong> overall abundance (mean number <strong>of</strong> individuals<br />
per point) and species richness (mean number <strong>of</strong> species per<br />
point). To compare detection rates <strong>of</strong> individual species, we<br />
used the Wilcoxon test on the mean number <strong>of</strong> individuals<br />
per point, and the G-test on frequencies <strong>of</strong> on- versus <strong>of</strong>f-road<br />
detection (Sokal and Rohlf 1981). Tests were considered<br />
significant at P
A <strong>Comparison</strong> <strong>of</strong> <strong>Bird</strong> <strong>Detection</strong> <strong>Rates</strong>: <strong>On</strong>-<strong>Road</strong> Versus <strong>Off</strong>-<strong>Road</strong> Richard L. Hutto and others<br />
Table 1--The number <strong>of</strong> point counts on which a given species was detected, and the mean number <strong>of</strong> detections per point (x 100) for on-road<br />
(n = 275) and <strong>of</strong>f-road (n = 275) counts within each <strong>of</strong> two count radii.<br />
Frequency <strong>of</strong> occurrence Mean number per point (x100)<br />
50-m radius 100-m radius 50-m radius 100-m radius<br />
Species <strong>On</strong> road <strong>Off</strong> road <strong>On</strong> road <strong>Off</strong> road <strong>On</strong> road <strong>Off</strong> road <strong>On</strong> road <strong>Off</strong> road<br />
Sharp-shinned Hawk<br />
Accipiter striatus<br />
Red-tailed Hawk<br />
0 1 1 1 0.00 0.36 0.36 0.36<br />
Buteo jamaicensis<br />
American Kestrel<br />
0 0 3 0 0.00 0.00 1.09 0.00<br />
Falco sparverius<br />
Merlin<br />
2 1 5 2 0.73 0.36 1.82 0.73<br />
Falco columbarius<br />
Ruffed Grouse<br />
0 0 1 0 0.00 0.00 0.36 0.00<br />
Bonasa umbellus<br />
Common Snipe<br />
0 1 6 11 0.00 0.36 2.18 4.00<br />
Gallinago gallinago<br />
Calliope Hummingbird<br />
1 1 2 3 0.36 0.36 0.73 1.45<br />
Stellula calliope 20 10 20 10 8.36 4.00 d<br />
8.36 4.00 d<br />
Rufous Hummingbird<br />
Selasphorus rufus<br />
Red-naped Sapsucker<br />
15 7 15 7 6.18 2.55 6.18 2.55<br />
Sphyrapicus nuchalis<br />
Downy Woodpecker<br />
16 15 30 27 6.55 6.55 11.64 12.00<br />
Picoides pubescens<br />
Hairy Woodpecker<br />
2 0<br />
2 0 0.73 0.00 0.73 0.00<br />
Picoides villosus<br />
Three-toed Woodpecker<br />
4 5 8 16 1.82 2.18 3.64 6.55<br />
Picoides tridactylus<br />
Black-backed Woodpecker<br />
8 3 10 5 4.00 1.82 4.73 2.55<br />
Picoides arcticus<br />
Northern Flicker<br />
3 0 4 0 1.45 0.00 1.82 0.00<br />
Colaptes auratus<br />
Pileated Woodpecker<br />
7 10 17 19 2.55 4.73 7.27 9.45<br />
Dryocopus pileatus<br />
Olive-sided Flycatcher<br />
0 1 5 6 0.00 0.36 1.82 2.18<br />
Contopus borealis<br />
Western Wood-Pewee<br />
5 1 24 22 2.18 0.36 9.09 8.36<br />
Contopus sordidulus<br />
Dusky and Hammond’s Flycatchers<br />
2 5 10 13 0.73 1.82 5.09 5.45<br />
Empidonax sp. a<br />
32 17 c<br />
36 24 11.64 6.18 d<br />
Eastern Kingbird<br />
13.09 8.73<br />
Tyrannus tyrannus<br />
Tree Swallow<br />
1 0 1 0 0.36 0.00 0.36 0.00<br />
Tachycineta bicolor<br />
Gray Jay<br />
9 12 13 16 6.18 8.36 9.09 12.00<br />
Perisoreus canadensis<br />
Steller’s Jay<br />
18 12 40 36 13.09 7.27 24.73 18.55<br />
Cyanocitta stelleri<br />
Clark’s Nutcracker<br />
1 1 5 2 0.36 0.36 1.82 0.73<br />
Nucifraga columbiana<br />
Common Raven<br />
0 0 1 0 0.00 0.00 0.73 0.00<br />
Corvus corax<br />
Black-capped and Mountain Chickadees<br />
3 3 24 21 1.45 1.09 10.18 8.00<br />
Parus sp. b<br />
Boreal Chickadee<br />
52 54 92 91 27.27 30.55 46.91 47.64<br />
Parus hudsonicus<br />
Chestnut-backed Chickadee<br />
2 0 2 0 2.18 0.00 2.18 0.00<br />
Parus rufescens<br />
Red-breasted Nuthatch<br />
1 2 1 2 0.73 1.09 0.73 1.09<br />
Sitta canadensis<br />
Brown Creeper<br />
59 50 132 136 25.82 20.73 58.18 62.91<br />
Certhia americana<br />
House Wren<br />
7 12 8 13 2.55 4.73 2.91 5.09<br />
Troglodytes aedon<br />
Winter Wren<br />
1 0 1 0 0.36 0.00 0.36 0.00<br />
Troglodytes troglodytes<br />
Golden-crowned Kinglet<br />
3 10 4 12 1.09 3.64 1.82 4.36<br />
Regulus satrapa 19 26 20 26 9.09 12.36 9.82 12.73<br />
continued<br />
USDA Forest Service Gen. Tech. Rep. PSW-GTR-149. 1995 105
A <strong>Comparison</strong> <strong>of</strong> <strong>Bird</strong> <strong>Detection</strong> <strong>Rates</strong>: <strong>On</strong>-<strong>Road</strong> Versus <strong>Off</strong>-<strong>Road</strong> Richard L. Hutto and others<br />
Table 1-continued<br />
Frequency <strong>of</strong> occurrence Mean number per point (x100)<br />
50-m radius 100-m radius 50-m radius 100-m radius<br />
Species<br />
Ruby-crowned Kinglet<br />
<strong>On</strong> road <strong>Off</strong> road <strong>On</strong> road <strong>Off</strong> road <strong>On</strong> road <strong>Off</strong> road <strong>On</strong> road <strong>Off</strong> road<br />
Regulus calendula 33 24 76 62 16.73 10.55 36.73 27.64 d<br />
Mountain Bluebird<br />
Sialia currucoides<br />
Townsend's Solitaire<br />
4 3 12 8 4.36 1.82 8.73 5.82<br />
Myadestes townsendi<br />
Swainson’s Thrush<br />
6 3 19 10 3.27 1.09 8.73 4.36<br />
Catharus ustulatus 97 85 166 141 c<br />
American Robin<br />
41.09 38.55 92.00 86.91<br />
Turdus migratorius 47 25 c<br />
91 82 21.82 11.64 d<br />
Varied Thrush<br />
50.18 40.73<br />
Ixoreus naevius<br />
Cedar Waxwing<br />
9 4 30 22 3.64 1.45 12.73 9.45<br />
Bombycilla cedrorum<br />
European Starling<br />
1 0 1 1 1.09 0.00 1.09 0.73<br />
Sturnus vulgaris<br />
Solitary Vireo<br />
0 1 2 1 0.00 1.09 1.82 1.09<br />
Vireo solitarius<br />
Warbling Vireo<br />
10 16 32 37 3.64 5.82 11.64 13.45<br />
Vireo gilvus 40 19 c<br />
62 35 c<br />
17.09 7.64 d<br />
26.55 15.64 d<br />
Red-eyed Vireo<br />
Vireo olivaceus<br />
Orange-crowned Warbler<br />
2 2 2 4 1.09 0.73 1.09 1.45<br />
Vermivora celata<br />
Yellow-rumped Warbler<br />
31 27 44 50 12.36 13.45 21.82 26.18<br />
Dendroica coronata 75 62 116 84 c<br />
33.45 25.09 d<br />
56.73 39.27 d<br />
Townsend's Warbler<br />
Dendroica townsendi<br />
American Redstart<br />
70 81 102 112 31.27 35.64 56.00 60.36<br />
Setophaga ruticilla<br />
Northern Waterthrush<br />
7 1 11 3 2.55 0.73 4.00 1.45<br />
Seiurus noveboracensis<br />
MacGillivray’s Warbler<br />
8 5 20 12 2.91 2.18 8.00 5.09<br />
Oporornis tolmiei 91 65 c<br />
122 96 c<br />
41.45 28.00 d<br />
61.09 42.18 d<br />
Common Yellowthroat<br />
Geothlypis trichas<br />
Wilson’s Warbler<br />
8 5 14 11 3.27 2.18 6.55 4.36<br />
Wilsonia pusilla 30 15 c<br />
37 21 c<br />
14.91 6.18 d<br />
20.00 10.18 d<br />
Western Tanager<br />
Piranga ludoviciana<br />
Black-headed Grosbeak<br />
27 34 54 65 12.36 13.45 23.64 26.55<br />
Pheucticus melanocephalus<br />
Lazuli Bunting<br />
3 4 10 10 1.09 1.45 4.00 4.73<br />
Passerina amoena<br />
Chipping Sparrow<br />
2 1 4 1 1.09 0.36 1.82 0.73<br />
Spizella passerina 64 36 c<br />
104 87 38.55 18.91 d<br />
59.64 44.00 d<br />
Fox Sparrow<br />
Passerella iliaca<br />
Song Sparrow<br />
8 4 20 13 3.27 1.45 9.45 5.82<br />
Melospiza melodia<br />
Lincoln’s Sparrow<br />
3 0 3 0 1.09 0.00 1.45 0.00<br />
Melospiza lincolnii<br />
White-crowned Sparrow<br />
5 6 16 16 2.18 4.00 6.91 9.09<br />
Zonotrichia leucophrys<br />
Dark-eyed Junco<br />
4 2 9 5 2.18 1.45 4.73 2.55<br />
Junco hyemalis 154 129 c<br />
199 179 96.00 71.27 d<br />
146.18 114.55 d<br />
Red-winged Blackbird<br />
Agelaius phoeniceus<br />
Brown-headed Cowbird<br />
1 0 4 4 0.36 0.00 2.18 1.82<br />
Molothrus ater<br />
Pine Grosbeak<br />
3 1 3 4 1.82 0.36 1.82 1.45<br />
Pinicola enucleator<br />
Cassin’s Finch<br />
1 0 2 3 1.09 0.00 1.45 1.45<br />
Carpodacus cassinii 3 2 6 5 1.09 1.45 2.18 2.55<br />
continued<br />
106 USDA Forest Service Gen. Tech. Rep. PSW-GTR-149. 1995
A <strong>Comparison</strong> <strong>of</strong> <strong>Bird</strong> <strong>Detection</strong> <strong>Rates</strong>: <strong>On</strong>-<strong>Road</strong> Versus <strong>Off</strong>-<strong>Road</strong> Richard L. Hutto and others<br />
Table 1--continued<br />
Frequency <strong>of</strong> occurrence Mean number per point (x100)<br />
50-m radius 100-m radius 50-m radius 100-m radius<br />
Species <strong>On</strong> road <strong>Off</strong> road <strong>On</strong> road <strong>Off</strong> road <strong>On</strong> road <strong>Off</strong> road <strong>On</strong> road <strong>Off</strong> road<br />
Red Crossbill<br />
Loxia curvirostra 0 0 1 1 0.00 0.00 0.73 0.36<br />
White-winged Crossbill<br />
Loxia leucoptera 4 3 6 5 1.82 6.55 4.73 7.27<br />
Pine Siskin<br />
Carduelis pinus 55 42 91 73 40.73 29.09 69.09 51.64 d<br />
Evening Grosbeak<br />
Coccothraustes vespertinus 5 1 5 4 4.36 0.73 4.36 1.82<br />
a Vocalizations <strong>of</strong> Dusky and Hammond's Flycatchers were difficult to distinguish, so data <strong>from</strong> the two species were combined.<br />
b Vocalizations <strong>of</strong> Black-capped and Mountain Chickadees were difficult to distinguish, so data <strong>from</strong> these two species were combined.<br />
c <strong>On</strong>- and <strong>of</strong>f-road counts differ significantly (G-test, P < 0.05).<br />
d <strong>On</strong>- and <strong>of</strong>f-road detection rates differ significantly (Wilcoxon matched-pairs signed-ranks test, P < 0.05).<br />
Counts than on <strong>of</strong>f-road counts. The possible explanations fall<br />
into one <strong>of</strong> two categories: (1) habitat changes (because <strong>of</strong><br />
vegetation changes or the presence <strong>of</strong> a road per se) cause<br />
differences in either actual population densities or in the<br />
detection probability (behavior) <strong>of</strong> on-road versus <strong>of</strong>f-road<br />
birds; or (2) actual bird densities or behaviors do not differ,<br />
but there is a visual, auditory, or area-estimate bias associated<br />
with on-road and <strong>of</strong>f-road counts. We can gain insight into<br />
the probable explanation by examining results <strong>from</strong> analyses<br />
that were categorized by bird species, habitat, and road width.<br />
Because the bird species whose detection rates differed<br />
significantly represent a varied group in terms <strong>of</strong> their foraging<br />
locations and behaviors, it seems unlikely that a single form<br />
<strong>of</strong> habitat influence can be used to explain those differences.<br />
Nonetheless, most <strong>of</strong> the species that differed are generally<br />
associated with habitat conditions that are similar to those<br />
created by the presence <strong>of</strong> a road. For example, considering<br />
the species whose detection rates differed significantly<br />
between on- and <strong>of</strong>f-road counts (table 1), it is easy to see<br />
how an increase in roadside shrub vegetation would be<br />
attractive to, and lead to higher counts <strong>of</strong>, Dusky Flycatcher<br />
(Empidonax oberholseri), Warbling Vireo, MacGillivray’s<br />
warbler, and Wilson’s Warbler (Wilsonia pusilla), because<br />
they each feed or nest, or both, in shrubby vegetation. In<br />
addition, the Calliope Hummingbird (Stellula calliope),<br />
American Robin, Chipping Sparrow (Spizella passerina),<br />
Dark-eyed Junco (Junco hyemalis), and Pine Siskin<br />
(Carduelis pinus) each feed primarily <strong>from</strong> the grass and forb<br />
layer, which is especially well developed along side roads.<br />
Finally, the Hammond’s Flycatcher (Empidonax hammondii),<br />
Yellow-rumped Warbler and Ruby-crowned Kinglet occur<br />
Table 2—The mean number <strong>of</strong> species (± s.d.) detected per point on<br />
on-road and <strong>of</strong>f-road counts for each <strong>of</strong> two count radii.<br />
Count Point Location<br />
radius <strong>On</strong> road <strong>Off</strong> road t P<br />
50 m 4.39 ± 2.1 3.53 ± 1.9 5.16 0.000<br />
100 m 7.44 ± 2.5 6.53 ± 2.5 4.27 0.000<br />
USDA Forest Service Gen. Tech. Rep. PSW-GTR-149. 1995<br />
commonly along natural forest edges and openings, and<br />
roadside edges may be used similarly. The argument that<br />
habitat changes associated with the presence <strong>of</strong> roads are<br />
causing the observed differences gains additional credence if<br />
we examine the list <strong>of</strong> species that had the relatively fewest<br />
detections on roadside counts (table 3). Most can be clearly<br />
recognized as forest interior specialists.<br />
The large variety in kinds <strong>of</strong> species whose detection<br />
rates differ significantly between on- and <strong>of</strong>f-road counts is<br />
also consistent with the idea that those differences are a product<br />
<strong>of</strong> some kind <strong>of</strong> sampling bias associated with either on- or<br />
<strong>of</strong>f-road counts. For example, if we overestimated the area<br />
surveyed for on-road relative to <strong>of</strong>f-road counts, we would<br />
have expected a diverse group <strong>of</strong> species to be affected.<br />
However, because the magnitude <strong>of</strong> any area-estimate bias<br />
would be expected to differ between data based on 50-m and<br />
100-m radii, we should also have expected the number <strong>of</strong><br />
significant on- versus <strong>of</strong>f-road differences in detection rates<br />
Table 3—Six species with the relatively greatest and relatively least<br />
number <strong>of</strong> detections (expressed as a percentage <strong>of</strong> the total number <strong>of</strong><br />
detections) on 50-m radius on-road (versus <strong>of</strong>f-road) counts. The pool <strong>of</strong><br />
species was restricted to those with at least 25 detections.<br />
<strong>On</strong> road <strong>On</strong> road<br />
Species n percent<br />
Wilson’s Warbler 58 70.7<br />
Warbling Vireo 68 69.1<br />
Calliope Hummingbird 34 67.6<br />
Chipping Sparrow 158 67.1<br />
Dusky and Hammond’s Flycatchers 49 65.3<br />
American Robin 92 65.2<br />
Orange-crowned Warbler 71 47.9<br />
Western Tanager 71 47.9<br />
Townsend’s Warbler 184 46.7<br />
Tree Swallow 40 42.5<br />
Golden-crowned Kinglet 59 42.4<br />
Solitary Vireo 26 38.5<br />
All 64 species 2948 56.4<br />
107
A <strong>Comparison</strong> <strong>of</strong> <strong>Bird</strong> <strong>Detection</strong> <strong>Rates</strong>: <strong>On</strong>-<strong>Road</strong> Versus <strong>Off</strong>-<strong>Road</strong> Richard L. Hutto and others<br />
Table 4--Means (± s.d.) <strong>from</strong> absolute values <strong>of</strong> the differences between<br />
the on-road and <strong>of</strong>f-road number <strong>of</strong> detections in each <strong>of</strong> four vegetation<br />
cover types. Data are <strong>from</strong> all species combined.<br />
Vegetation type 50-m radius a 100-mradius b<br />
Burned forest 2.60 ± 3.1 3.91 ± 4.3<br />
Early successional 2.24 ± 3.1 2.87 ± 2.7<br />
Open forest 3.93 ± 5.1 4.48 ± 5.0<br />
Closed forest 5.18 ± 7.3 7.22 ± 9.3<br />
a Means vary significantly among vegetation types (ANOVA; F = 3.17, P<br />
= 0.026).<br />
b Means vary significantly among vegetation types (ANOVA; F = 4.36, P<br />
= 0.005).<br />
to change <strong>from</strong> one count radius to the next. In fact, the same<br />
number <strong>of</strong> species had significantly different detection rates<br />
under each sampling radius (nine species, based on mean<br />
numbers detected per point (table 1)). Thus, in the absence <strong>of</strong><br />
other information, an evaluation <strong>of</strong> the identity <strong>of</strong> species<br />
affected would leave us with the impression that multiple<br />
habitat factors best account for the differences in detection<br />
rates between on- and <strong>of</strong>f-road count points.<br />
How can a breakdown by vegetation cover types help<br />
us interpret our results? If species are responding to the presence<br />
<strong>of</strong> an opening or to an increase in shrub cover, we might<br />
expect the on/<strong>of</strong>f-road difference in the number <strong>of</strong> detections<br />
to be greater in closed forests because <strong>of</strong>f-road points are surrounded<br />
by little early successional vegetation relative to the<br />
on-road points. This was indeed the case. The greatest average<br />
difference between on-road and <strong>of</strong>f-road counts occurred in<br />
closed forest, followed by open forest, and then the early<br />
successional cover types (table 4). Nevertheless, the results<br />
are consistent with an area-estimate bias as well.<br />
Finally, the observation that there was less difference<br />
between on- and <strong>of</strong>f-road counts on narrow than on wide<br />
roads (fig. 1) is also consistent with either interpretation. The<br />
wider roads that we surveyed had associated with them an<br />
apron <strong>of</strong> grass along both edges, significant shrub cover and,<br />
<strong>of</strong> course, a wide forest opening. Those kinds <strong>of</strong> habitat<br />
changes associated with roads may explain the relatively<br />
large differences between on- and <strong>of</strong>f-road counts. If this<br />
were the case, however, we would have expected the <strong>of</strong>f-road<br />
counts to be similar for narrow and wide roads, and the on-<br />
road counts to be larger for wide roads. Instead, we found<br />
that the mean number <strong>of</strong> birds per <strong>of</strong>f-road point was less on<br />
wide roads than on narrow roads, while the mean numbers <strong>of</strong><br />
birds per point on roadside counts were nearly the same for<br />
wide and narrow roads (fig. 1). The difference in <strong>of</strong>f-road<br />
detection rates between wide and narrow roads is probably a<br />
reflection <strong>of</strong> the fact that, even though we restricted analysis<br />
to the "closed forest" cover type, the paired points <strong>from</strong> wider<br />
roads were situated in predominantly lodgepole pine (Pinus<br />
contorta) forest, a notoriously bird-poor habitat type, while<br />
most <strong>of</strong> the paired points <strong>from</strong> narrower roads were situated<br />
in mixed conifer stands. Thus, the "baseline" detection rates<br />
for our wide road samples may be lower than for the narrow<br />
road samples, but the results are still consistent with the conjecture<br />
that habitat differences between on- and <strong>of</strong>f-road<br />
points were greater in the areas with wide roads.<br />
108<br />
Figure 1--The mean number <strong>of</strong> birds detected per point within 50 m<br />
on on- and <strong>of</strong>f-road counts for each <strong>of</strong> two road widths.<br />
Alternatively, because it is easy to underestimate distances in<br />
open areas, the more open conditions associated with wide<br />
roads may have resulted in the inclusion <strong>of</strong> a greater number<br />
<strong>of</strong> birds that were actually beyond the formal cut<strong>of</strong>f radius<br />
than was true for narrow roads.<br />
In conclusion, consideration <strong>of</strong> information on species<br />
identity, vegetation cover type, and road width suggests that<br />
vegetation change associated with the presence <strong>of</strong> roads is an<br />
important factor contributing to a difference between on- and<br />
<strong>of</strong>f-road count data. In addition, the particular kind <strong>of</strong> road-<br />
side vegetation change that affects the count data (whether it<br />
is the presence <strong>of</strong> an opening, a grassy area, or an increase in<br />
shrub cover) probably differs among species, and may not<br />
affect some species at all. In short, changes in a variety <strong>of</strong><br />
habitat elements probably caused the patterns we observed,<br />
which is merely a reflection <strong>of</strong> the fact that every species is<br />
biologically unique. Thus, one must understand enough about<br />
the biology <strong>of</strong> each target species to make a decision about<br />
whether the exclusive use <strong>of</strong> roadside counts is appropriate<br />
for a particular study.<br />
Because some species were almost certainly responding<br />
to the changed habitat conditions brought about by the<br />
presence <strong>of</strong> a road, we recommend that studies <strong>of</strong> habitat<br />
associations treat roadside conditions as unique "habitats" in<br />
and <strong>of</strong> themselves. This should be especially true for studies<br />
involving wide roads or heavily forested habitats, or both,<br />
because roadside effects appear to be most pronounced in<br />
those situations. Thus, counts restricted to primary roads will<br />
probably not assure a representative coverage <strong>of</strong> habitat types<br />
because, in effect, such counts do not include the <strong>of</strong>f-road<br />
contexts <strong>of</strong> the habitat types through which they pass. By the<br />
same token, studies designed to use only <strong>of</strong>f-road points<br />
would be missing samples <strong>from</strong> those special habitat<br />
conditions created by the presence <strong>of</strong> roads.<br />
If the goal <strong>of</strong> one's study is to monitor bird population<br />
trends over a broad region, we recommend combining on-<br />
with <strong>of</strong>f-road counts to avoid the possible bias <strong>of</strong> using either<br />
USDA Forest Service Gen. Tech. Rep. PSW-GTR-149. 1995
A <strong>Comparison</strong> <strong>of</strong> <strong>Bird</strong> <strong>Detection</strong> <strong>Rates</strong>: <strong>On</strong>-<strong>Road</strong> Versus <strong>Off</strong>-<strong>Road</strong> Richard L. Hutto and others<br />
exclusively. Our results also suggest, however, that <strong>of</strong>f-road<br />
counts are more-or-less equivalent to on-road counts<br />
when the road is a small secondary or tertiary road.<br />
Therefore, if roads are to be used, perhaps the simplest<br />
design would call for use <strong>of</strong> smaller roads that have the same<br />
vegetation cover types within 100 m to either side and that<br />
appear to have resulted in little, if any, change in the<br />
vegetative conditions immediately adjacent to the road.<br />
Sample points can then be stratified by the habitat type<br />
through which the road passes.<br />
Unfortunately, the issue <strong>of</strong> whether or not to use roadside<br />
counts is nearly a moot point on much <strong>of</strong> our public land. It<br />
was difficult to find any locations, especially in bottomlands,<br />
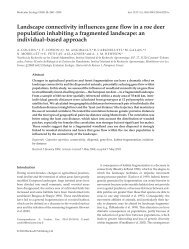
that were more than 200 m <strong>from</strong> an existing road (fig. 2). By<br />
Figure 2--A scene typical <strong>of</strong> the roaded landscape found on forested public lands throughout much <strong>of</strong> the northern Rocky Mountains (USDA<br />
Forest Service photo 611030 1186-94).<br />
USDA Forest Service Gen. Tech. Rep. PSW-GTR-149. 1995 109
A <strong>Comparison</strong> <strong>of</strong> <strong>Bird</strong> <strong>Detection</strong> <strong>Rates</strong>: <strong>On</strong>-<strong>Road</strong> Versus <strong>Off</strong>-<strong>Road</strong> Richard L. Hutto and others<br />
default, we will be forced to sample bird populations over<br />
much <strong>of</strong> the public landscape in what are basically roadside<br />
environments. In those parts <strong>of</strong> the country where we are<br />
fortunate enough to still have sizable blocks <strong>of</strong> largely roadless<br />
areas, there should be a premium on establishing monitoring<br />
programs so that we will be able to better<br />
understand the effects <strong>of</strong> roads on not only count data<br />
themselves, but on trends <strong>of</strong> populations situated near versus<br />
far <strong>from</strong> roads.<br />
Acknowledgments<br />
Financial support for this study was provided by Region I<br />
<strong>of</strong> the USDA Forest Service (contract RFQ 1-865). Numerous<br />
forest wildlife biologists and silviculturists helped us find<br />
potential sites for the paired counts, and personnel at Glacier<br />
National Park provided the same service. To those individuals<br />
we express our gratitude. We also thank Cherry Keller, John<br />
Sauer, and C. John Ralph for reviewing the manuscript and<br />
<strong>of</strong>fering comments that improved the final version.<br />
110 USDA Forest Service Gen. Tech. Rep. PSW-GTR-149. 1994