Computing binomial probabilities with Minitab
Computing binomial probabilities with Minitab
Computing binomial probabilities with Minitab

Create successful ePaper yourself
Turn your PDF publications into a flip-book with our unique Google optimized e-Paper software.
<strong>Computing</strong> <strong>binomial</strong> <strong>probabilities</strong> <strong>with</strong> <strong>Minitab</strong><br />
You can compute <strong>binomial</strong> <strong>probabilities</strong> <strong>with</strong> <strong>Minitab</strong> in the following way.<br />
Suppose you have a <strong>binomial</strong> distribution <strong>with</strong> 15 trials (n=15) and probability of<br />
success p=0.7. In the following you will see how to compute <strong>probabilities</strong> of<br />
exact events and cumulative <strong>probabilities</strong> <strong>with</strong> <strong>Minitab</strong>.<br />
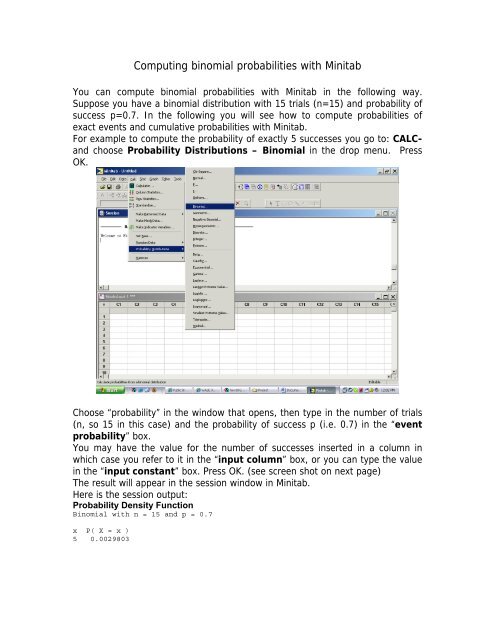
For example to compute the probability of exactly 5 successes you go to: CALCand<br />
choose Probability Distributions – Binomial in the drop menu. Press<br />
OK.<br />
Choose “probability” in the window that opens, then type in the number of trials<br />
(n, so 15 in this case) and the probability of success p (i.e. 0.7) in the “event<br />
probability” box.<br />
You may have the value for the number of successes inserted in a column in<br />
which case you refer to it in the “input column” box, or you can type the value<br />
in the “input constant” box. Press OK. (see screen shot on next page)<br />
The result will appear in the session window in <strong>Minitab</strong>.<br />
Here is the session output:<br />
Probability Density Function<br />
Binomial <strong>with</strong> n = 15 and p = 0.7<br />
x P( X = x )<br />
5 0.0029803
To compute cumulative <strong>probabilities</strong>, you check the “cumulative probability” box<br />
in the <strong>binomial</strong> distribution window.<br />
For example, the probability of at most 10 successes, is PX≤ ( 10) = 0.4845 .
You can also generate the entire table of <strong>probabilities</strong> <strong>with</strong> <strong>Minitab</strong>. Start by<br />
typing the values of the number of successes in a column, say C1. If you work<br />
<strong>with</strong> the same <strong>binomial</strong> model <strong>with</strong> 15 trials you will have to insert all values<br />
from 0 to 15. You can do this more efficiently by using CALC- Make Patterned<br />
Data – Simple Set of Numbers.<br />
Fill in the boxes in the window as see in the next picture and press Ok.
So you are asking <strong>Minitab</strong> to enter all values from 0 to 15 in the column C1. You<br />
will see the values appear in column C1. Next you use the probability<br />
distributions command (as described above) to compute the <strong>probabilities</strong><br />
associated <strong>with</strong> the values in column C1, only that instead of using “input<br />
constant” box you use “Input Column” and select C1. For storage specify a<br />
different column, say C2. Press Ok. You will see the <strong>probabilities</strong> appear in<br />
column C2 in your worksheet.<br />
Unfortunately <strong>Minitab</strong> cannot draw the histogram of the data if it is given in two<br />
columns out of which one contains the <strong>probabilities</strong> associated <strong>with</strong> the values in<br />
the first column (or at least I haven’t found that out yet).<br />
Surprisingly enough this can be done <strong>with</strong> TI83.<br />
One way of getting the histogram of a <strong>binomial</strong> distribution is to generate<br />
random data following the given model and construct a histogram of the data<br />
generated.<br />
Here are the steps to do just that. We will generate 1000 values from a Binomial<br />
model <strong>with</strong> 15 trials and probability p=0.7 of success. That is, <strong>Minitab</strong> will<br />
generate 100 rows of data that will represent the number of successes out of 15<br />
trials.<br />
Choose CALC- Random Data – Binomial. Enter the number of rows to<br />
generate (1000 in our case), specify the number of trials and the probability of<br />
success as well as the column where you want the data to be stored (C3 on our<br />
screen). Press OK. See screen shots on next page.
Then, using STAT – Basic Statistics – Display Descriptive Statistics you<br />
can perform the descriptive analysis of the data that was generated and you may<br />
add to it a graph (histogram of the data for example).