- Page 1 and 2:
VIIth International Conference in
- Page 3 and 4:
D I R E Z I O N E E R E D A Z I O N
- Page 5 and 6:
CONFERENCE DATA Messina, 22 nd - 24
- Page 7:
Prof. Marius I. Stoka
- Page 10 and 11:
Contents Preface Barilla D. - Leona
- Page 12 and 13:
RENDICONTI RISKDEL ANALYSIS CIRCOLO
- Page 14 and 15:
RISK ANALYSIS OF HAZARDOUS MATERIAL
- Page 16 and 17:
RISK ANALYSIS OF HAZARDOUS MATERIAL
- Page 18 and 19:
RISK ANALYSIS OF HAZARDOUS MATERIAL
- Page 20 and 21:
RISK ANALYSIS OF HAZARDOUS MATERIAL
- Page 22 and 23:
RISK ANALYSIS OF HAZARDOUS MATERIAL
- Page 24 and 25:
RISK ANALYSIS OF HAZARDOUS MATERIAL
- Page 26 and 27:
30 U. BÄSEL We assume min(a, b)
- Page 28 and 29:
32 U. BÄSEL For (x, y) ∈F5, weha
- Page 30 and 31:
34 U. BÄSEL E(X k n | (x, y)) is t
- Page 32 and 33:
36 U. BÄSEL The sum of the integra
- Page 34 and 35:
38 U. BÄSEL References [1] Stoka,
- Page 36 and 37:
40 V. BONANZINGA - L. SORRENTI 2a M
- Page 38 and 39:
42 V. BONANZINGA - L. SORRENTI (6)
- Page 40 and 41:
44 V. BONANZINGA - L. SORRENTI Then
- Page 42 and 43:
46 V. BONANZINGA - L. SORRENTI
- Page 44 and 45:
48 V. BONANZINGA - L. SORRENTI R(L,
- Page 46 and 47:
50 V. BONANZINGA - L. SORRENTI Theo
- Page 48 and 49:
52 V. BONANZINGA - L. SORRENTI (17)
- Page 50 and 51:
RENDICONTI DEL CIRCOLO ON ESTIMATIO
- Page 52 and 53:
ON ESTIMATION OF THE SUPPORT IN MET
- Page 54 and 55:
RENDICONTI GEOMETRICAL DEL CIRCOLO
- Page 56 and 57:
GEOMETRICAL PROBABILITIES USING THE
- Page 58 and 59:
GEOMETRICAL PROBABILITIES USING THE
- Page 60 and 61:
GEOMETRICAL PROBABILITIES USING THE
- Page 62 and 63:
GEOMETRICAL PROBABILITIES USING THE
- Page 64 and 65:
RENDICONTI DEL CIRCOLO RANDOM MATEM
- Page 66 and 67:
RANDOM LATTICE IN THE EUCLIDEAN SPA
- Page 68 and 69:
ÇÆD(−4)ÆD(8)ÌÊÁÈÄËÊÇÅ
- Page 70 and 71:
ÇÆD(−4)ÆD(8)ÌÊÁÈÄË ÄØ
- Page 72 and 73:
ÇÆD(−4)ÆD(8)ÌÊÁÈÄË ON D
- Page 74 and 75:
ÇÆD(−4)ÆD(8)ÌÊÁÈÄË ON D
- Page 76 and 77:
ÇÆD(−4)ÆD(8)ÌÊÁÈÄË TγÒ
- Page 78 and 79:
ÇÆD(−4)ÆD(8)ÌÊÁÈÄË ON D(
- Page 80 and 81:
86 S. CHIRICOSTA Davanti a questo i
- Page 82 and 83:
88 S. CHIRICOSTA che consente alle
- Page 84 and 85:
90 S. CHIRICOSTA certamente, costit
- Page 86 and 87:
92 S. CHIRICOSTA mezzo di batteri a
- Page 88 and 89:
94 S. CHIRICOSTA assicurare il mant
- Page 90 and 91:
RENDICONTI VALORIZZAZIONE DEL CIRCO
- Page 92 and 93:
VALORIZZAZIONE E DIFFUSIONE DELLA F
- Page 94 and 95:
VALORIZZAZIONE E DIFFUSIONE DELLA F
- Page 96 and 97:
VALORIZZAZIONE E DIFFUSIONE DELLA F
- Page 98 and 99:
VALORIZZAZIONE E DIFFUSIONE DELLA F
- Page 100 and 101:
RENDICONTI CONTINGENT DEL CIRCOLO V
- Page 102 and 103:
CONTINGENT VALUATION E STIMA DELLA
- Page 104 and 105:
CONTINGENT VALUATION E STIMA DELLA
- Page 106 and 107:
CONTINGENT VALUATION E STIMA DELLA
- Page 108 and 109:
CONTINGENT VALUATION E STIMA DELLA
- Page 110 and 111:
CONTINGENT VALUATION E STIMA DELLA
- Page 112 and 113:
CONTINGENT VALUATION E STIMA DELLA
- Page 114 and 115:
122 F. CORRIERE - D. LO BOSCO 1 The
- Page 116 and 117:
124 F. CORRIERE - D. LO BOSCO expon
- Page 118 and 119:
126 F. CORRIERE - D. LO BOSCO • 6
- Page 120 and 121:
128 F. CORRIERE - D. LO BOSCO predi
- Page 122 and 123:
130 F. CORRIERE - D. LO BOSCO The d
- Page 124 and 125:
132 I. CZINKOTA - B. KERTÉSZ - A.
- Page 126 and 127:
134 I. CZINKOTA - B. KERTÉSZ - A.
- Page 128 and 129:
136 I. CZINKOTA - B. KERTÉSZ - A.
- Page 130 and 131:
138 I. CZINKOTA - B. KERTÉSZ - A.
- Page 132 and 133:
140 I. CZINKOTA - B. KERTÉSZ - A.
- Page 134 and 135:
142 A. DUMA - S. RIZZO Come cellula
- Page 136 and 137:
144 A. DUMA - S. RIZZO Osserviamo c
- Page 138 and 139:
146 A. DUMA - S. RIZZO § 4. Caso I
- Page 140 and 141:
148 A. DUMA - S. RIZZO § 6. Casi I
- Page 142 and 143:
150 A. DUMA - S. RIZZO § 7. Caso I
- Page 144 and 145:
152 A. DUMA - S. RIZZO π+2B−ϕ2
- Page 146 and 147:
154 A. DUMA - S. RIZZO § 11. Casi
- Page 148 and 149:
156 A. DUMA - S. RIZZO ϕ2−B ϕ2
- Page 150 and 151:
THE GENERALIZED BUFFON-EXPERIMENT W
- Page 152 and 153:
THE GENERALIZED BUFFON-EXPERIMENT W
- Page 154 and 155:
THE GENERALIZED BUFFON-EXPERIMENT W
- Page 156 and 157:
THE GENERALIZED BUFFON-EXPERIMENT W
- Page 158 and 159:
THE GENERALIZED BUFFON-EXPERIMENT W
- Page 160 and 161:
THE GENERALIZED BUFFON-EXPERIMENT W
- Page 162 and 163:
172 G. FAILLA 1. Plücker Relations
- Page 164 and 165:
174 G. FAILLA Remark 1.10. The vect
- Page 166 and 167:
176 G. FAILLA Grassmann-Plücker id
- Page 168 and 169:
178 G. FAILLA Proof. We consider H2
- Page 170 and 171:
180 G. FAILLA Finally ω ′ · (α
- Page 172 and 173:
182 F. GRASSO - L. CUCURULLO The to
- Page 174 and 175:
184 F. GRASSO - L. CUCURULLO In thi
- Page 176 and 177:
186 F. GRASSO - L. CUCURULLO dei me
- Page 178 and 179:
188 L. HEINRICH ¢ ¤£¦¥¨§¦¢
- Page 180 and 181:
190 L. HEINRICH ¢ ¢ ¡ £¢ ¡
- Page 182 and 183:
192 L. HEINRICH © ¥ §© §¥
- Page 184 and 185:
194 L. HEINRICH V (d) d (K) =νd(K)
- Page 186 and 187:
196 L. HEINRICH §© ¥ §¥§ ¥
- Page 188 and 189:
198 L. HEINRICH ¨§ ¥ ¥§¥ §
- Page 190 and 191:
200 L. HEINRICH § ¥§§¥ ¤ Nϱ
- Page 192 and 193:
202 L. HEINRICH © Z (d) k,ϱ (K)
- Page 194 and 195:
204 L. HEINRICH ¥ §©¥ §¥
- Page 196 and 197:
206 L. HEINRICH k, l =0, 1,...,d
- Page 198 and 199:
208 L. HEINRICH ¥ ¤¦¥ § §
- Page 200 and 201:
210 L. HEINRICH © ¥§ ¥© ¥
- Page 202 and 203:
212 L. HEINRICH §¦¥ ¡ ¢
- Page 204 and 205:
214 L. HEINRICH ¦ ¡ Xϱ = √ ϱ
- Page 206 and 207:
216 L. HEINRICH ¡ ¡ L(∂
- Page 208 and 209:
218 L. HEINRICH ¡ § £¢§ ¨¨
- Page 210 and 211:
220 L. HEINRICH Ak = rN ( cos(2kϕN
- Page 212 and 213:
222 L. HEINRICH ¡ ¢ ¨ ¡
- Page 214 and 215:
224 M. IMBESI For example, if we co
- Page 216 and 217:
226 M. IMBESI Remark 1 For any (i1,
- Page 218 and 219:
228 M. IMBESI z1z2···z2r; w1w2·
- Page 220 and 221:
230 M. IMBESI The class of the idea
- Page 222 and 223:
232 M. IMBESI X12•;123 ,X13•;12
- Page 224 and 225:
234 M. IMBESI But, in other way, we
- Page 226 and 227:
RENDICONTI MINIMAL DEL CIRCOLO VERT
- Page 228 and 229:
MINIMAL VERTEX COVERS AND MATCHING
- Page 230 and 231: MINIMAL VERTEX COVERS AND MATCHING
- Page 232 and 233: MINIMAL VERTEX COVERS AND MATCHING
- Page 234 and 235: MINIMAL VERTEX COVERS AND MATCHING
- Page 236 and 237: RENDICONTI DEL RISK CIRCOLO IN AGRI
- Page 238 and 239: RISK IN AGRICULTURAL FIRM: A MATHEM
- Page 240 and 241: RISK IN AGRICULTURAL FIRM: A MATHEM
- Page 242 and 243: RISK IN AGRICULTURAL FIRM: A MATHEM
- Page 244 and 245: Social Pol itical Macr o-economic T
- Page 246 and 247: RISK IN AGRICULTURAL FIRM: A MATHEM
- Page 248 and 249: References RISK IN AGRICULTURAL FIR
- Page 250 and 251: 262 M. MARCHISIO - V. PERDUCA where
- Page 252 and 253: 264 M. MARCHISIO - V. PERDUCA Take
- Page 254 and 255: 266 M. MARCHISIO - V. PERDUCA and (
- Page 256 and 257: 268 M. MARCHISIO - V. PERDUCA Omitt
- Page 258 and 259: 270 M. MARCHISIO - V. PERDUCA Proof
- Page 260 and 261: 272 M. MARCHISIO - V. PERDUCA
- Page 262 and 263: 274 D. MARINO - R. TRAPASSO immigra
- Page 264 and 265: 276 D. MARINO - R. TRAPASSO forward
- Page 266 and 267: 278 D. MARINO - R. TRAPASSO represe
- Page 268 and 269: 280 D. MARINO - R. TRAPASSO Table 2
- Page 270 and 271: 282 D. MARINO - R. TRAPASSO Table 4
- Page 272 and 273: 284 D. MARINO - R. TRAPASSO Product
- Page 274 and 275: 286 D. MARINO - R. TRAPASSO Freeman
- Page 276 and 277: RENDICONTI DEL A CIRCOLO DISTANCE M
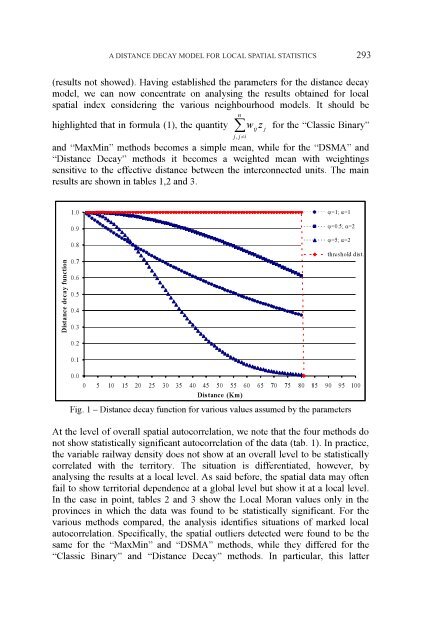
- Page 278 and 279: A DISTANCE DECAY MODEL FOR LOCAL SP
- Page 282 and 283: 4. Conclusion A DISTANCE DECAY MODE
- Page 284 and 285: A DISTANCE DECAY MODEL FOR LOCAL SP
- Page 286 and 287: RENDICONTI RAIL DEL TRACK CIRCOLO S
- Page 288 and 289: RAIL TRACK SUBSTRUCTURE RESISTANCE
- Page 290 and 291: Tp Tg RAIL TRACK SUBSTRUCTURE RESIS
- Page 292 and 293: RAIL TRACK SUBSTRUCTURE RESISTANCE
- Page 294 and 295: RAIL TRACK SUBSTRUCTURE RESISTANCE
- Page 296 and 297: RAIL TRACK SUBSTRUCTURE RESISTANCE
- Page 298 and 299: RENDICONTI ASSESSING DEL RAIL CIRCO
- Page 300 and 301: ASSESSING RAIL TRACK SUB-BALLAST RE
- Page 302 and 303: 0 20 40 60 80 100 ASSESSING RAIL TR
- Page 304 and 305: ASSESSING RAIL TRACK SUB-BALLAST RE
- Page 306 and 307: ASSESSING RAIL TRACK SUB-BALLAST RE
- Page 308 and 309: ASSESSING RAIL TRACK SUB-BALLAST RE
- Page 310 and 311: JOINT DENSITY AND RELATED PERFORMAN
- Page 312 and 313: JOINT DENSITY AND RELATED PERFORMAN
- Page 314 and 315: JOINT DENSITY AND RELATED PERFORMAN
- Page 316 and 317: Gmb 0,80 0,70 0,60 0,50 0,40 0,30 0
- Page 318 and 319: JOINT DENSITY AND RELATED PERFORMAN
- Page 320 and 321: 334 A. PUGLISI where the notations
- Page 322 and 323: 336 A. PUGLISI
- Page 324 and 325: 338 G. RESTUCCIA 1 Let S = K [x1,..
- Page 326 and 327: 340 G. RESTUCCIA Proposition 2.2 Le
- Page 328 and 329: 342 G. RESTUCCIA 6 ′ . x j 2xk
- Page 330 and 331:
344 G. RESTUCCIA References [1] A.F
- Page 332 and 333:
346 P. L. STAGLIANÒ 1 Let A be a c
- Page 334 and 335:
348 P. L. STAGLIANÒ • L3 = L3 ,
- Page 336 and 337:
350 P. L. STAGLIANÒ Example 2.3 Le
- Page 338 and 339:
STATISTICAL TESTS FOR POINT PROCESS
- Page 340 and 341:
STATISTICAL TESTS FOR POINT PROCESS
- Page 342 and 343:
STATISTICAL TESTS FOR POINT PROCESS
- Page 344 and 345:
STATISTICAL TESTS FOR POINT PROCESS
- Page 346 and 347:
STATISTICAL TESTS FOR POINT PROCESS
- Page 348 and 349:
364 J. ZHOU - C. ZHOU - FANG MA 2 J
- Page 350 and 351:
366 J. ZHOU - C. ZHOU - FANG MA 4 J
- Page 352 and 353:
368 J. ZHOU - C. ZHOU - FANG MA
- Page 354 and 355:
370 A. ZIRILLI - A. ALIBRANDI 2 AGA
- Page 356 and 357:
372 A. ZIRILLI - A. ALIBRANDI 4 AGA
- Page 358 and 359:
374 A. ZIRILLI - A. ALIBRANDI 6 AGA
- Page 360 and 361:
376 A. ZIRILLI - A. ALIBRANDI 8 AGA
- Page 362 and 363:
378 A. ZIRILLI - A. ALIBRANDI 10 AG