Phoneme Confusions in Human and Automatic ... - Medical Physics
Phoneme Confusions in Human and Automatic ... - Medical Physics
Phoneme Confusions in Human and Automatic ... - Medical Physics

You also want an ePaper? Increase the reach of your titles
YUMPU automatically turns print PDFs into web optimized ePapers that Google loves.
<strong>Phoneme</strong> <strong>Confusions</strong> <strong>in</strong> <strong>Human</strong> <strong>and</strong> <strong>Automatic</strong> Speech Recognition<br />
Bernd T. Meyer, Matthias Wächter, Thomas Br<strong>and</strong>, Birger Kollmeier<br />
<strong>Medical</strong> <strong>Physics</strong> Section, University of Oldenburg, Germany<br />
bernd.meyer@uni-oldenburg.de, thomas.br<strong>and</strong>@uni-oldenburg.de<br />
Abstract<br />
A comparison between automatic speech recognition (ASR)<br />
<strong>and</strong> human speech recognition (HSR) is performed as prerequisite<br />
for identify<strong>in</strong>g sources of errors <strong>and</strong> improv<strong>in</strong>g feature<br />
extraction <strong>in</strong> ASR. HSR <strong>and</strong> ASR experiments are carried out<br />
with the same logatome database which consists of nonsense<br />
syllables. Two different k<strong>in</strong>ds of signals are presented to human<br />
listeners: First, noisy speech samples are converted to<br />
Mel-frequency cepstral coefficients which are resynthesized to<br />
speech, with <strong>in</strong>formation about voic<strong>in</strong>g <strong>and</strong> fundamental frequency<br />
be<strong>in</strong>g discarded. Second, the orig<strong>in</strong>al signals with added<br />
noise are presented, which is used to evaluate the loss of <strong>in</strong>formation<br />
caused by the process of resynthesis. The analysis also<br />
covers the degradation of ASR caused by dialect or accent <strong>and</strong><br />
shows that different error patterns emerge for ASR <strong>and</strong> HSR.<br />
The <strong>in</strong>formation loss <strong>in</strong>duced by the calculation of ASR features<br />
has the same effect as a deteriation of the SNR by 10 dB.<br />
Index Terms: human speech recognition, automatic speech<br />
recognition, dialect, accent, phoneme confusions, MFCC<br />
1. Introduction<br />
<strong>Automatic</strong> speech recognition (ASR) has seen many advances<br />
<strong>in</strong> the last years, but the large gap between recognition of spoken<br />
language by humans <strong>and</strong> mach<strong>in</strong>es still prevents it from<br />
everyday use. There are several causes for the <strong>in</strong>ferior performance<br />
of ASR compared to human speech recognition (HSR):<br />
<strong>Human</strong> language models are for example more sophisticated<br />
than ASR language models, as <strong>in</strong>creas<strong>in</strong>g ASR error rates are<br />
observed for more complex tasks [1]. Furthermore, additive or<br />
convolutive noise as well as speech <strong>in</strong>tr<strong>in</strong>sic variabilities (such<br />
as, e.g., dialect or speak<strong>in</strong>g rate <strong>and</strong> effort) can severely degrade<br />
ASR performance.<br />
The aim of this study is to perform a fair comparison of human<br />
<strong>and</strong> mach<strong>in</strong>e phoneme recognition. For similar experimental<br />
conditions, the same speech database with non-sense syllables<br />
was used for ASR <strong>and</strong> HSR tests. Hence, human listeners<br />
were not able to exploit context knowledge <strong>and</strong> language models<br />
<strong>in</strong> ASR could be disregarded. This helps to decouple the <strong>in</strong>fluence<br />
of two major sources of errors <strong>in</strong> ASR, namely the frontend<br />
<strong>and</strong> the back-end. Thus, the focus is laid on the importance<br />
of phoneme classification <strong>and</strong> feature extraction. The database<br />
covers several dialects [2] which were <strong>in</strong>cluded <strong>in</strong> the comparison.<br />
Different error patterns of the confusions of phonemes<br />
should help to identify sources of errors <strong>and</strong> to improve ASR<br />
feature extraction.<br />
It was also <strong>in</strong>vestigated whether the <strong>in</strong>formation conta<strong>in</strong>ed<br />
<strong>in</strong> ASR features is sufficient for human listeners to recognize<br />
speech. Therefore, the most common features <strong>in</strong> ASR (Melfrequency<br />
cepstral coefficients / MFCCs) have been resynthesized<br />
to audible signals [3] which were presented to human test<br />
subjects. Dur<strong>in</strong>g the extensive HSR experiments, the orig<strong>in</strong>al<br />
signals were also presented as a reference condition. The results<br />
are analyzed on a microscopic scale with phoneme confusion<br />
matrices, which have sucessfully been utilized for manmach<strong>in</strong>e-comparison<br />
earlier [4, 5].<br />
2.1. Speech database<br />
2. Method<br />
The speech database used for HSR <strong>and</strong> ASR experiments is<br />
the Oldenburg Logatome Corpus (OLLO) [2] which is specifically<br />
targeted at a direct comparison of speech recognition<br />
performance <strong>in</strong> HSR <strong>and</strong> ASR. It conta<strong>in</strong>s 150 different nonsense<br />
utterances (logatomes) spoken by 40 German <strong>and</strong> 10<br />
French speakers. Each logatome consists of a comb<strong>in</strong>ation of<br />
consonant-vowel-consonant (CVC) or vowel-consonant-vowel<br />
(VCV) with the outer phonemes be<strong>in</strong>g identical.<br />
To provide an <strong>in</strong>sight <strong>in</strong>to the <strong>in</strong>fluence of speech <strong>in</strong>tr<strong>in</strong>sic<br />
variabilites on speech recognition, OLLO covers several<br />
variabilities such as speak<strong>in</strong>g rate <strong>and</strong> effort, dialect, accent<br />
<strong>and</strong> speak<strong>in</strong>g style (statement <strong>and</strong> question). The dialects conta<strong>in</strong>ed<br />
<strong>in</strong> OLLO are East Frisian, East Phalian, Bavarian <strong>and</strong><br />
st<strong>and</strong>ard German. The OLLO corpus is freely available at<br />
http://sirius.physik.uni-oldenburg.de. If recognition rates of<br />
the middle phonemes are analyzed (as done here), the number<br />
of response alternatives is reduced dramatically <strong>in</strong> comparison<br />
to an open test. This makes HSR experiments tractable,<br />
s<strong>in</strong>ce a presentation of r<strong>and</strong>omized logatomes with the same<br />
outer phonemes is possible. The approach results <strong>in</strong> a closed<br />
test setup <strong>and</strong> avoids out-of-vocabulary errors. The middle<br />
phonemes of logatomes are either vowels or consonant<br />
phonemes which are listed below (represented with the International<br />
Phonetic Alphabet (IPA)).<br />
• Consonant phonemes: /p/, /t/, /k/, /b/, /d/, /g/,<br />
/s/, /f/, /v/, /n/, /m/, /S/, /ţ/, /l/<br />
• Vowel phonemes: /a/, /a:/, /E/, /e/, /I/, /i/, /O/,<br />
/o/, /U/, /u/<br />
For HSR experiments, the measurement time has to be limited<br />
to a reasonable amount, which requires a subset of OLLO to be<br />
selected for speech recognition tests. A representative speaker<br />
set for which gender <strong>and</strong> dialect are uniformly distributed <strong>and</strong><br />
which exhibits average ASR performance was chosen for the<br />
measurements. One male <strong>and</strong> one female speaker were selected<br />
from each dialect region, which results <strong>in</strong> a total of ten speakers<br />
or 1,500 utterances for the test set.<br />
2.2. Experimental conditions<br />
Speech <strong>in</strong>telligibility tests with human listeners <strong>in</strong>cluded two<br />
conditions:<br />
1. Presentation of resynthesized signals: For a fair comparison,<br />
it is <strong>in</strong>vestigated if the most common features <strong>in</strong> ASR conta<strong>in</strong><br />
all the <strong>in</strong>formation needed for humans to underst<strong>and</strong> speech
on phoneme level. MFCC features are therefore resynthesized,<br />
i.e. feature vectors used <strong>in</strong>ternally by the speech recognizer are<br />
decoded to acoustic speech tokens. S<strong>in</strong>ce the calculation of<br />
MFCCs results <strong>in</strong> a loss of <strong>in</strong>formation, these signals sound unnatural<br />
(like synthesized speech). For example, the speaker’s<br />
identity or even gender are usually not recognizable. Nevertheless,<br />
the resynthesized logatomes are perfectly underst<strong>and</strong>able<br />
<strong>in</strong> the absence of noise. To allow for a valid comparison, the<br />
presented recognition scores were obta<strong>in</strong>ed with noisy speech.<br />
By add<strong>in</strong>g noise, redundant <strong>in</strong>formation <strong>in</strong> the speech signal is<br />
masked, so that <strong>in</strong>telligibility is potentially decreased <strong>in</strong> contrast<br />
to an unprocessed signal. The reduction of redundancy<br />
might be particularly critical <strong>in</strong> the presence of speech <strong>in</strong>tr<strong>in</strong>sic<br />
variabilities as, for example, regional dialect.<br />
2. Presentation of orig<strong>in</strong>al signals: Unaltered speech signals<br />
from the OLLO database are used as reference. A comparison<br />
with the first condition should reveal if error patterns differ<br />
<strong>and</strong> if speech <strong>in</strong>formation crucial for recognition is disregarded<br />
when MFCC features are calculated.<br />
2.3. Calculation of MFCCs<br />
MFCCs are a compact representation of speech signals <strong>and</strong> have<br />
been successfully applied to the problem of ASR. However, this<br />
compact representation comes at the cost of <strong>in</strong>formation loss:<br />
Dur<strong>in</strong>g the calculation, phase <strong>in</strong>formation <strong>and</strong> f<strong>in</strong>e structure of<br />
the spectrum are disregarded. This is useful <strong>in</strong> the absence of<br />
noise, but may be detrimental <strong>in</strong> noisy conditions, because redundant<br />
<strong>in</strong>formation exploited by humans is removed. Us<strong>in</strong>g<br />
the phase <strong>in</strong>formation has, e.g., been found to be beneficial <strong>in</strong><br />
ASR [6]. In order to calculate MFCC features from speech, signals<br />
with 16 kHz sampl<strong>in</strong>g frequency are w<strong>in</strong>dowed with 30ms<br />
Hann<strong>in</strong>g w<strong>in</strong>dows <strong>and</strong> a frame shift of 10ms. Each frame undergoes<br />
the same process<strong>in</strong>g steps: Calculation of the amplitude<br />
spectrum, reduction of the frequency resolution us<strong>in</strong>g a Melscaled<br />
filterbank <strong>and</strong> calculat<strong>in</strong>g the logarithm <strong>and</strong> the <strong>in</strong>verse<br />
discrete cos<strong>in</strong>e transformation (IDCT) of its output. Twelve of<br />
the lower coefficients plus an additional energy feature are selected<br />
for the ASR experiments <strong>and</strong> HSR tests with resynthesized<br />
speech.<br />
2.4. Re-decod<strong>in</strong>g of MFCCs to speech<br />
In order to decode these features to an acoustic speech signal,<br />
a l<strong>in</strong>ear neural network tra<strong>in</strong>ed with the OLLO tra<strong>in</strong><strong>in</strong>g set<br />
(c.f. Section 2.6) is used to construct the spectral envelope from<br />
the cepstral coefficients. Additional <strong>in</strong>formation such as voic<strong>in</strong>g<br />
or fundamental frequency fg is not used for the calculation,<br />
s<strong>in</strong>ce this would give human listeners an unfair advantage over<br />
ASR. Hence, an artificial excitation signal has to be used. Pilot<br />
experiments showed that <strong>in</strong>telligibility is highest when a pulse<br />
tra<strong>in</strong> with fg = 130 Hz is used as excitation signal (<strong>in</strong>stead<br />
of noise or a mixed noise-pulse signal). In a f<strong>in</strong>al step, the<br />
spectral envelope <strong>and</strong> the artificial excitation signal are comb<strong>in</strong>ed.<br />
Due to the fixed fundamental frequency, resynthesized<br />
speech sounds artificial <strong>and</strong> t<strong>in</strong>ny, but rema<strong>in</strong>s underst<strong>and</strong>able<br />
when no noise is present. This algorithm was k<strong>in</strong>dly supplied<br />
by the Katholieke Universiteit Leuven [3].<br />
HSR scores are usually very close to 100% for the clean<br />
condition, both for the unaltered signals <strong>and</strong> the signals derived<br />
from cepstral coefficients. In [5], the lowest recognition rate<br />
observed for non-dialect speech was 99.1 percent for a similar<br />
task. This clearly demonstrates the excellence of the human<br />
auditory system, but does not allow for a valid analysis of<br />
phoneme confusions, because differences at very low or high<br />
error rates often are outside the range of reliably observable differences<br />
(ceil<strong>in</strong>g effect). Hence, speech-shaped noise is used<br />
to <strong>in</strong>crease the difficulty of the listen<strong>in</strong>g task. In case of resynthesized<br />
speech, noise is added before MFCCs are calculated<br />
from the orig<strong>in</strong>al signals. Pilot measurements with one test<br />
subject showed that a ceil<strong>in</strong>g effect is always observed when<br />
the same SNR is used for resynthesized <strong>and</strong> orig<strong>in</strong>al signals,<br />
i.e. the recognition rates are either too low for the first or too<br />
high for the second condition to obta<strong>in</strong> valid <strong>and</strong> comparable<br />
results <strong>in</strong> reasonable measurement time. Based on these first<br />
measurements, the SNR for each condition was chosen to produce<br />
approximately the same recognition rates. Resynthesized<br />
<strong>and</strong> orig<strong>in</strong>al signals were presented at an SNR of 0 dB <strong>and</strong> -10<br />
dB, respectively.<br />
2.5. <strong>Human</strong> speech recognition test setup<br />
Five normal-hear<strong>in</strong>g listeners (two male, three female) without<br />
a noticeable regional dialect participated <strong>in</strong> the HSR tests.<br />
Signals were presented <strong>in</strong> a soundproof booth via audiological<br />
headphones (Sennheiser HDA200). An onl<strong>in</strong>e freefield equalization<br />
<strong>and</strong> r<strong>and</strong>omization of logatomes was performed by the<br />
measurement software MessOL. Feedback or the possibility to<br />
replay the logatome was not given dur<strong>in</strong>g the test procedure. In<br />
order to avoid errors due to <strong>in</strong>attentiveness, listeners were encouraged<br />
to take regular breaks. After a tra<strong>in</strong><strong>in</strong>g phase, subjects<br />
were presented a sequence of logatomes at a level of 70 dB SPL.<br />
For each presentation, the logatome had to be selected from a<br />
list of CVCs or VCVs with the same outer phoneme <strong>and</strong> different<br />
middle phonemes. A touch screen <strong>and</strong> a computer mouse<br />
were used as <strong>in</strong>put devices. In order to avoid speaker adaptation,<br />
all resynthesized signals were presented before the subjects listened<br />
to the unprocessed speech files. The HSR measurements<br />
<strong>in</strong>clude 1,500 presentations per listener <strong>and</strong> test condition (orig<strong>in</strong>al<br />
<strong>and</strong> resynthesized signals), which resulted <strong>in</strong> a total of 2<br />
x 7,500 presentations. The cumulative measurement time was<br />
about 34 hours, <strong>in</strong>clud<strong>in</strong>g pauses <strong>and</strong> <strong>in</strong>structions for listeners.<br />
2.6. <strong>Automatic</strong> speech recognition test setup<br />
ASR experiments were carried out with a Hidden Markov<br />
Model (HMM) with three states <strong>and</strong> eight Gaussian mixtures<br />
per HMM state. The system was set up to closely resemble<br />
the closed test which was used for human <strong>in</strong>telligibility tests,<br />
i.e. confusions could only occur for the middle phonemes. This<br />
was achieved by tra<strong>in</strong><strong>in</strong>g <strong>and</strong> test<strong>in</strong>g several HMM systems with<br />
each correspond<strong>in</strong>g to a different outer phoneme. Additional<br />
delta <strong>and</strong> acceleration features were added to the 13 cepstral<br />
coefficients, yield<strong>in</strong>g a 39-dimensional feature vector per time<br />
step. The ASR test set conta<strong>in</strong>ed the same utterances as used <strong>in</strong><br />
HSR experiments (ten speakers with 150 utterances each) with<br />
the exception that all repetitions of logatomes were used <strong>in</strong>stead<br />
of just one (c.f. Section 2.1). Speech files from the rema<strong>in</strong><strong>in</strong>g 40<br />
speakers <strong>in</strong> OLLO were chosen for the tra<strong>in</strong><strong>in</strong>g process, which<br />
results <strong>in</strong> a speaker <strong>in</strong>dependent ASR system. The frequency<br />
of phonemes <strong>and</strong> gender were equally distributed <strong>in</strong> the tra<strong>in</strong><strong>in</strong>g<br />
<strong>and</strong> test set. ASR recognition scores were obta<strong>in</strong>ed for different<br />
SNRs, for which a speech-shaped noise was added to the utterances;<br />
the same SNR was used for tra<strong>in</strong><strong>in</strong>g <strong>and</strong> test, result<strong>in</strong>g <strong>in</strong><br />
a matched tra<strong>in</strong><strong>in</strong>g-test-condition.<br />
3. Results<br />
Overall HSR <strong>and</strong> ASR results for several conditions are presented<br />
<strong>in</strong> Table 1: Due to the adjustment of the SNR (c.f. Sec-
tion 2.4) the total recognition scores for both HSR conditions<br />
are very similar (shaded elements). Consonants are recognized<br />
slightly better than vowels <strong>in</strong> case of resynthesized signals, but<br />
<strong>in</strong>telligibility of consonants is lower for unprocessed signals,<br />
whereas the scores for vowels are higher <strong>in</strong> spite of the lower<br />
SNR (color-<strong>in</strong>verted elements). Regard<strong>in</strong>g dialect, no large differences<br />
between the conditions can be observed: Although the<br />
order of ’no dialect’ <strong>and</strong> ’East Frisian’ is swapped for both HSR<br />
conditions, differences <strong>in</strong> recognition scores are much smaller<br />
than for vowel <strong>and</strong> consonant recognition. The performance for<br />
the dialects decreases <strong>in</strong> the order Bavarian, East Phalian <strong>and</strong><br />
French.<br />
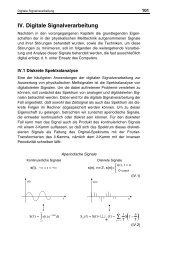
Confusion matrices (CMs) characterize how often a presented<br />
phoneme was recognized or confused with response alternatives<br />
(see Figs. 1 to 3). The matrices are based on the<br />
complete measurements for the correspond<strong>in</strong>g condition, i.e.,<br />
CM scores are averaged over all dialects. For the HSR measurements,<br />
all presentations <strong>in</strong> a row correspond to 250 or 400<br />
s<strong>in</strong>gle presentations of consonants <strong>and</strong> vowels, respectively. In<br />
case of ASR, this corresponds to 150 (consonant recognition)<br />
or 240 (vowel recognition) utterances.<br />
Dialect / Accent<br />
Total<br />
Consonants<br />
Vowels<br />
orig<br />
-10 dB<br />
HSR ASR<br />
resynth<br />
0 dB<br />
clean 10 dB 0 dB -10 dB<br />
74.0 73.8 82.1 79.3 68.5 34.0<br />
65.7 74.3 85.1 80.2 59.5 21.6<br />
81.3 73.3 79.4 78.5 76.4 44.9<br />
No dialect 81.5 77.5 88.4 87.0 75.4 42.6<br />
East Frisian 80.9 79.2 84.5 82.5 72.4 34.0<br />
Bavarian 77.6 75.1 79.1 75.4 66.8 36.2<br />
East Phalian 70.2 71.3 84.1 78.5 68.0 30.8<br />
French 59.7 65.7 74.2 73.2 59.8 26.3<br />
Table 1: Recognition rates <strong>in</strong> % for HSR (orig<strong>in</strong>al signals, presented<br />
at -10 dB SNR <strong>and</strong> resynthesized signals, presented at 0<br />
dB SNR) <strong>and</strong> ASR (at different SNRs). In the first three rows,<br />
the average accuracy (’total’) as well as consonant (VCV) <strong>and</strong><br />
vowel (CVC) rates are reported. The subsequent rows show the<br />
recognition performance depend<strong>in</strong>g on dialect <strong>and</strong> accent.<br />
4. Discussion<br />
A direct comparison of ASR <strong>and</strong> HSR performance shows that<br />
human speech recognition is superior to the ASR system under<br />
equal conditions, as presented <strong>in</strong> Table 1. The total HSR <strong>and</strong><br />
ASR accuracies at an SNR of -10 dB are 74.0% <strong>and</strong> 34.0%,<br />
respectively (encircled elements), which corresponds to a relative<br />
<strong>in</strong>crease of the word error rate (WER) of 154%. The gap<br />
narrows if the <strong>in</strong>formation for human listeners is limited to the<br />
<strong>in</strong>formation content of MFCCs: For resynthesized signals at 0<br />
dB SNR, the recognition score is 73.8% <strong>and</strong> the correspond<strong>in</strong>g<br />
ASR accuracy is 68.5%, result<strong>in</strong>g <strong>in</strong> an WER <strong>in</strong>crease of<br />
20.0%.<br />
The SNRs for both HSR conditions were chosen so that<br />
average recognition rates are similar. The choice of SNRs was<br />
based on the presentation of only few test lists to one human listener<br />
<strong>and</strong> proved to be reasonable for other test subjects as well,<br />
as the overall accuracies are very close to each other: The average<br />
scores were 73.8% (resynthesized signals) <strong>and</strong> 74.0% (orig<strong>in</strong>al<br />
signals). Therefore, the <strong>in</strong>formation loss caused by MFCCs<br />
can be expressed <strong>in</strong> terms of the signal-to-noise ratio, i.e. the<br />
Kann man so e<strong>in</strong>stellen, dass vowel und consonant CM die gleiche Breite haben.<br />
HSR DIALECT RESYNTH 0 DB<br />
p t k b d g s f v n m ß ts l<br />
p 58 4 9 10 1 5 4 8 0<br />
t 2 74 5 0 10 4 0 0 4<br />
k 4 2 70 1 18 0 3 1 0<br />
b 11 2 44 3 13 26 1 2<br />
d 2 4 74 13 3 3 0<br />
g 3 11 2 2 73 5 2 1 1<br />
s 0 87 5 0 4 1 2<br />
f 1 1 1 89 7 1<br />
v 1 16 1 6 3 70 2 1<br />
n 0 1 4 1 2 61 12 0 19<br />
m 4 3 5 12 58 18<br />
ß 1 2 98<br />
ts 3 2 95<br />
l 2 4 2 2 4 88<br />
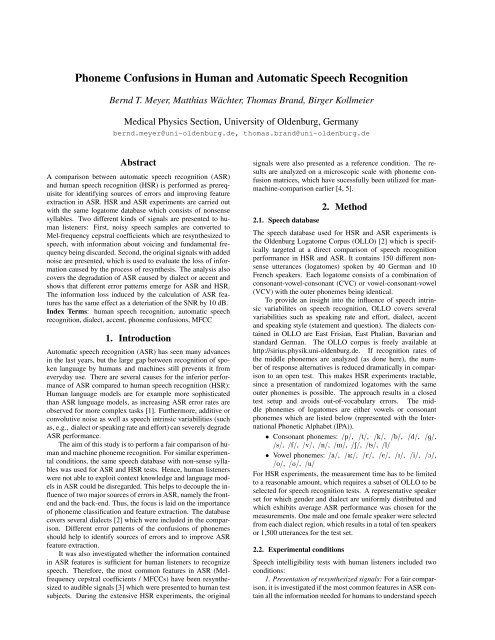
Figure 1: Confusion matrix (CM) for consonant phonemes, derived<br />
from human speech recognition tests with resynthesized<br />
speech at an SNR of 0 dB. The matrix element Cij denotes how<br />
often s fthevphoneme n m ß<strong>in</strong> row ts liwas classifiedpastthekphoneme b d g<strong>in</strong><br />
column j. Rows are normalized to 100%. p Matrix elements with<br />
0 -2 1 0 -2 0 0 -3 -5 -3 2 6 6 -1<br />
a value of zero are not plotted <strong>and</strong> elements t < 5 are plotted <strong>in</strong><br />
0 -1 -1 0 0 0 3 -1 7 -47 4 3 7 -2<br />
Kann light man gray so e<strong>in</strong>stellen, for reasons dass vowel und ofconsonant readability. CM die gleiche Inverted<br />
k Breite haben. elements denote<br />
0 -1 1 -1 0 0 1 -1 12 0 -16 3 6 -8<br />
large differences between this CM <strong>and</strong> Fig. 2.<br />
ASR 0 DB<br />
b 0 -2 3 -2 -1 0 0 0 5 1 1 -5 5 -6<br />
p t k b d g s f v n m ß ts l<br />
p 54 1 11 16 7 3 1 5 1 1<br />
t 9 27 9 3 17 1 1 33<br />
k 16 2 55 3 7 9 1 1 6<br />
b 15 1 3 39 8 7 2 16 5 3 1<br />
d 3 3 1 6 60 9 4 5 2 3 5<br />
g 9 1 14 9 13 39 8 4 2 2<br />
s 1 1 1 1 83 5 1 1 3 5<br />
f 7 1 7 1 1 76 6 1 1<br />
v 3 1 2 27 7 8 9 36 2 3 3<br />
n 1 1 3 1 3 61 18 1 11<br />
m 1 1 5 1 1 4 31 54 2<br />
ß 1 3 96<br />
ts 9 1 1 1 1 89<br />
l 1 1 3 2 2 2 19 3 1 66<br />
-1 0 -4 1 0 0 0 -6 d 3 0 1 2 -14 -4<br />
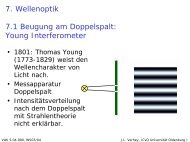
Figure 2: CM for consonant phonemes, derived from ASR experiments<br />
for which tra<strong>in</strong><strong>in</strong>g <strong>and</strong> test data at 0 dB SNR were<br />
used. See Fig. 1 for details.<br />
s f v n m ß ts l<br />
0 -2 -4 0 0 0 1 0 0 #### -54 -1<br />
SNR of resynthesized signals has to be 10 dB higher <strong>in</strong> order to<br />
0 0 1 0 0 0 28 0<br />
obta<strong>in</strong> similar recognition performance. This is consistent with<br />
0 1 -2 0 0 0 5 0<br />
the model of human speech perception us<strong>in</strong>g an auditory model<br />
0 2 -10 5 2 0 1 -2<br />
as front-end to ASR as presented <strong>in</strong> [8].<br />
0 The 0 vowel 1 2 recognition 2 0 3 rates 4 for both HSR conditions show<br />
that the <strong>in</strong>formation loss dur<strong>in</strong>g feature calculation is particularly<br />
problematic for vowels, as accuracy drops by 10% when<br />
us<strong>in</strong>g resynthesized <strong>in</strong>stead of orig<strong>in</strong>al signals even though the<br />
SNR is lower for the orig<strong>in</strong>al signals. Although MFCCs have<br />
been found to encode the spectral shape of vowels well, the<br />
reduced frequency resolution may result <strong>in</strong> <strong>in</strong>ferior differentiation<br />
between proximate formants compared to human listeners.
Kann man so e<strong>in</strong>stellen, dass vowel und consonant CM die gleiche Breite haben.<br />
HSR DIALECT ORIGINAL -10db HSR DIALECT RESYNTH 0 DB ASR 0 DB<br />
a a: ´ e ˆ i ø o ¨ u a a: ´ e ˆ i ø o ¨ u a a: ´ e ˆ i ø o ¨ u<br />
a 80 13 4 4 a 74 13 5 0 1 8 a 71 19 3 0 7<br />
a: 5 85 0 0 7 3 a: 4 85 5 6 a: 16 77 7<br />
´ 0 83 11 6 ´ 2 1 76 13 9 0 0 ´ 2 1 87 1 8 0<br />
e 0 1 85 7 8 0 e 1 2 85 4 9 0 e 3 89 5 4<br />
ˆ 4 4 73 19 1 ˆ 16 8 64 12 0 0 ˆ 18 3 64 14 0<br />
i 9 3 89 0 i 0 16 8 76 1 i 9 4 86 0<br />
ø 2 2 1 82 5 9 ø 13 4 1 1 68 4 10 ø 5 6 0 1 81 2 6<br />
o 0 1 88 7 4 o 3 84 8 5 o 1 2 80 12 5<br />
¨ 0 4 1 1 7 69 19 ¨ 2 18 7 60 13 ¨ 0 2 1 25 10 50 12<br />
u 0 0 2 0 14 3 81 u 0 31 6 63 u 0 0 2 0 11 7 78<br />
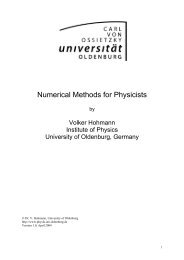
Figure 3: CMs for vowel phonemes, derived from HSR tests with orig<strong>in</strong>al signals at -10 dB SNR (left panel), from resynthesized signals<br />
at 0 dB SNR (middle panel) <strong>and</strong> from ASR experiments at 0 dB SNR (right panel). Gray-shaded elements highlight degradations that<br />
emerge when resynthesized a -5.5 0.0 0.5 signals 0.3 0.8 <strong>in</strong>stead 0.0 4.0of 0.0 the 0.0 orig<strong>in</strong>al 0.0 ones are used. Encircled cells show improvements of ASR compared to<br />
resynthesized features, while color-<strong>in</strong>verted elements show degradations. See Fig. 1 for details.<br />
a a: ´ e ˆ i ø o ¨ u a a: ´ e ˆ i ø o ¨ u a a: ´ e ˆ i ø o ¨ u<br />
a: -0.8 0.0 -0.3 -0.3 0.0 0.0 -2.2 3.5 0.0 0.0<br />
´ 1.5 0.5 -7.5 2.0 3.0 0.3 0.3 0.0 0.0 0.0<br />
e 0.0 0.2 1.0 0.3 -2.5 1.0 0.0 0.0 0.0 0.0<br />
The performance drop may also be caused by discard<strong>in</strong>g the<br />
ˆ 0.0 0.0 12.5 4.0 -9.5 -6.8 0.3 0.0 -0.8 0.3<br />
phase component. Correspond<strong>in</strong>g f<strong>in</strong>d<strong>in</strong>gs have been obta<strong>in</strong>ed<br />
i 0.0 0.0 0.3 7.5 4.7 -12.7 0.0 0.0 0.0 0.2<br />
for ASR where performance was improved by exploit<strong>in</strong>g phase<br />
<strong>in</strong>formation [6] <strong>and</strong> ø 11.0 <strong>in</strong> HSR 3.5 -0.8 when 0.0 the 0.0 audible 0.0 -14.0 <strong>in</strong>formation -1.0 1.3 0.0 was<br />
limited to the power o 0.0spectrum 0.0 0.0 -0.3 of noisy 0.0 0.0 signals 2.3 -4.3 [7]. 1.3 1.0 Prelimi-<br />
nary measurements<br />
¨<br />
have shown that the <strong>in</strong>formation conta<strong>in</strong>ed<br />
0.0 0.0 0.0 -0.3 -1.2 -1.0 16.7 0.5 -8.7 -6.0<br />
<strong>in</strong> MFCCs is sufficient to recognize speech <strong>in</strong> the absence of<br />
u 0.0 0.0 0.0 -0.3 -0.3 -1.5 0.0 16.8 2.7 -17.5<br />
noise, s<strong>in</strong>ce the <strong>in</strong>telligibility <strong>in</strong> HSR is not degraded when us<strong>in</strong>g<br />
resynthesized signals <strong>in</strong>stead of the orig<strong>in</strong>al ones. However,<br />
the presented measurements <strong>in</strong> noise clearly show that dur<strong>in</strong>g<br />
Resynth. schlechter als Orig<strong>in</strong>al<br />
the calculation of MFCCs a significant amount of useful <strong>in</strong>formation<br />
is removed. These conclusions are based on the assumption<br />
that the decod<strong>in</strong>g algorithm for MFCCs uses all the <strong>in</strong>formation<br />
conta<strong>in</strong>ed <strong>in</strong> MFCCs.<br />
A comparison of the CMs shows that <strong>in</strong> some cases recognition<br />
performance is severely degraded when present<strong>in</strong>g resynthesized<br />
signals <strong>in</strong>stead of orig<strong>in</strong>al ones (gray-shaded elements<br />
<strong>in</strong> Fig. 3). This suggests that too much redundancy is removed<br />
by the feature calculation process so that the accord<strong>in</strong>g<br />
phonemes cannot be dist<strong>in</strong>guished. In other cases, ASR performance<br />
is higher than HSR with resynthesized features (encircled<br />
elements) which suggests that either the feature <strong>in</strong>formation<br />
is not completely made audible by the decod<strong>in</strong>g algorithm<br />
or the auditory model of the ASR back-end covers the acoustic<br />
space optimally <strong>and</strong> is thus superior to HSR for these microscopic<br />
confusions. F<strong>in</strong>ally, color-<strong>in</strong>verted elements <strong>in</strong> the CMs<br />
(Figs. 1-3) denote cases <strong>in</strong> which ASR performs worse than humans<br />
with resynthesized signals which means that the feature<br />
<strong>in</strong>formation is not optimally exploited by the back-end. Many<br />
of the observed errors can either be attributed to feature extraction<br />
or to the back-end, which might be helpful to improve ASR.<br />
5. Conclusions<br />
1. Even for the relatively simple task of phoneme classification,<br />
the difference between HSR <strong>and</strong> ASR rema<strong>in</strong>s considerably<br />
large: The <strong>in</strong>crease of relative WER is larger than 150% at<br />
-10 dB SNR. If the <strong>in</strong>formation conta<strong>in</strong>ed <strong>in</strong> MFCC features<br />
is resynthesized <strong>and</strong> presented to human listeners, the gap<br />
narrows, but error rates are still 20% higher for ASR.<br />
2. The <strong>in</strong>formation loss caused by the calculation of Melfrequency<br />
cepstral coefficients can be expressed <strong>in</strong> terms of<br />
the signal-to-noise ratio: Similar recognition results <strong>in</strong> HSR<br />
are obta<strong>in</strong>ed when the SNR is 10 dB higher for resynthesized<br />
8.4 -6.2 1.5 0.0 -0.4 0.0 -3.2 0.0 0.0 0.0 -2.9 6.2 -2.0 -0.3 -0.4 0.0 -0.8 0.0 0.0 0.0<br />
-11.0 7.9 0.3 0.3 0.0 0.0 -0.1 2.8 0.0 0.0 11.8 -7.9 0.0 0.0 0.0 0.0 2.3 -6.3 0.0 0.0<br />
-1.8 -0.8 -4.0 9.5 -2.4 0.0 0.0 0.0 -0.4 0.0 0.3 0.3 11.5 -11.5 -0.6 -0.3 -0.3 0.0 0.4 0.0<br />
signals <strong>in</strong>stead of unaltered speech files.<br />
3. Regard<strong>in</strong>g dialect, no major differences between resynthesized<br />
<strong>and</strong> orig<strong>in</strong>al signals can be observed. This suggests that<br />
<strong>in</strong>formation is equally well encoded <strong>in</strong> MFCCs for the dialects<br />
which were subject of the analysis.<br />
4. For the analyzed SNR conditions, <strong>in</strong>formation needed to<br />
dist<strong>in</strong>guish between vowel phonemes seems to be encoded<br />
suboptimally by MFCCs which may be caused by miss<strong>in</strong>g<br />
phase <strong>in</strong>formation or reduced spectral resolution.<br />
0.0 0.3 -2.0 -4.3 1.5 4.2 0.0 0.3 0.0 0.0 0.0 -0.5 1.0 4.0 1.0 -5.2 0.0 -0.3 0.0 0.0<br />
0.0 0.0 -14.6 0.5 9.4 4.6 0.0 0.0 0.4 0.0 0.0 0.0 2.1 -4.5 0.1 2.2 -0.3 0.0 0.4 -0.3<br />
0.0 0.0 0.0 -0.7 -1.4 2.3 0.0 0.0 0.0 -0.1 0.0 0.0 -0.3 -6.8 -3.3 10.4 0.0 0.0 0.0 -0.1<br />
-2.7 -5.5 1.4 0.0 0.0 0.0 0.9 3.1 3.0 0.0 -8.3 2.0 -0.6 0.0 0.0 0.0 13.1 -2.1 -4.3 0.0<br />
0.0 0.0 0.0 -0.5 0.0 0.0 -1.6 8.0 -5.1 -0.6 0.0 0.0 0.0 0.8 0.0 0.0 -0.7 -3.7 3.8 -0.4<br />
0.0 0.0 0.0 -0.1 1.4 0.2 -23.4 -3.1 18.3 6.9 0.0 0.0 0.0 0.4 -0.2 0.8 6.7 2.6 -9.6 -0.9<br />
-0.4 0.0 0.0 -0.1 0.3 -0.2 -0.1 2.7 -4.1 2.1 0.4 0.0 0.0 0.4 0.0 1.7 0.1 -19.5 1.4 15.4<br />
Acknowledgements: Supported by the DFG (SFB/TR<br />
31 ’The active auditory system’; URL: http://www.unioldenburg.de/sfbtr31).<br />
6. References<br />
[1] Lippmann, R.P., ”Speech Recognition by Mach<strong>in</strong>es <strong>and</strong><br />
<strong>Human</strong>s”, Speech Communication 22 (1) 1-15, 1997.<br />
[2] Wesker T. et al., ”Oldenburg Logatome Speech Corpus<br />
(OLLO) for Speech Recognition Experiments with <strong>Human</strong>s<br />
<strong>and</strong> Mach<strong>in</strong>es”, In Proc. Interspeech 2005, Lisbon,<br />
Portugal, pp. 1273-1276.<br />
[3] Demuynck, K., Garcia, O. <strong>and</strong> Dirk Van Compernolle.,<br />
”Synthesiz<strong>in</strong>g Speech from Speech Recognition Parameters”,<br />
In Proc. ICSLP 2004, volume II, pages 945–948.<br />
[4] Sroka, J.J. <strong>and</strong> Braida, L.D., ”<strong>Human</strong> <strong>and</strong> Mach<strong>in</strong>e Consonant<br />
Recognition”, Speech Communication 45 (401-<br />
423), 2005.<br />
[5] Meyer, B.T. <strong>and</strong> Wesker, T., ”A <strong>Human</strong>-Mach<strong>in</strong>e Comparison<br />
<strong>in</strong> Speech Recognition Based on a Logatome Corpus”,<br />
Workshop on Speech Recognition <strong>and</strong> Intr<strong>in</strong>sic Variation,<br />
May 2006, Toulouse, France.<br />
[6] Schlüter, R. <strong>and</strong> Ney, H., ”Us<strong>in</strong>g Phase Spectrum Information<br />
for Improved Speech Recognition Performance”,<br />
In Proc. ICASSP, 2001.<br />
[7] Peters, S.D., Stubley <strong>and</strong> P., Val<strong>in</strong>, J.-M., ”On the Limits<br />
of Speech Recognition <strong>in</strong> Noise”, In Proc. ICASSP, 1999.<br />
[8] Jürgens, T., Br<strong>and</strong>, T. <strong>and</strong> Kollmeier, B., ”Modell<strong>in</strong>g the<br />
<strong>Human</strong>-Mach<strong>in</strong>e Gap <strong>in</strong> Speech Reception: Microscopic<br />
Speech Intelligibility Prediction for Normal-Hear<strong>in</strong>g<br />
Subjects with an Auditory Model”, this issue.