Evaluation of a Learning Collaborative to Improve the Delivery of ...
Evaluation of a Learning Collaborative to Improve the Delivery of ...
Evaluation of a Learning Collaborative to Improve the Delivery of ...

You also want an ePaper? Increase the reach of your titles
YUMPU automatically turns print PDFs into web optimized ePapers that Google loves.
<strong>Evaluation</strong> <strong>of</strong> a <strong>Learning</strong> <strong>Collaborative</strong> <strong>to</strong> <strong>Improve</strong> <strong>the</strong> <strong>Delivery</strong> <strong>of</strong> Preventive<br />
Services by Pediatric Practices<br />
Paul C. Young, Gordon B. Glade, Gregory J. S<strong>to</strong>ddard and Chuck Norlin<br />
Pediatrics 2006;117;1469-1476<br />
DOI: 10.1542/peds.2005-2210<br />
The online version <strong>of</strong> this article, along with updated information and services, is<br />
located on <strong>the</strong> World Wide Web at:<br />
http://www.pediatrics.org/cgi/content/full/117/5/1469<br />
PEDIATRICS is <strong>the</strong> <strong>of</strong>ficial journal <strong>of</strong> <strong>the</strong> American Academy <strong>of</strong> Pediatrics. A monthly<br />
publication, it has been published continuously since 1948. PEDIATRICS is owned, published,<br />
and trademarked by <strong>the</strong> American Academy <strong>of</strong> Pediatrics, 141 Northwest Point Boulevard, Elk<br />
Grove Village, Illinois, 60007. Copyright © 2006 by <strong>the</strong> American Academy <strong>of</strong> Pediatrics. All<br />
rights reserved. Print ISSN: 0031-4005. Online ISSN: 1098-4275.<br />
Downloaded from<br />
www.pediatrics.org at Eccles Health Sciences Lib on August 18, 2008
ARTICLE<br />
<strong>Evaluation</strong> <strong>of</strong> a <strong>Learning</strong> <strong>Collaborative</strong> <strong>to</strong> <strong>Improve</strong><br />
<strong>the</strong> <strong>Delivery</strong> <strong>of</strong> Preventive Services by<br />
Pediatric Practices<br />
Paul C. Young, MD a,b , Gordon B. Glade, MD a,c , Gregory J. S<strong>to</strong>ddard, MPH d , Chuck Norlin, MD a,b<br />
a Utah Pediatric Partnership <strong>to</strong> <strong>Improve</strong> Healthcare Quality, Salt Lake City, Utah; b Department <strong>of</strong> Pediatrics, University <strong>of</strong> Utah School <strong>of</strong> Medicine, Salt Lake City, Utah;<br />
c Utah Valley Pediatrics, American Fork, Utah; d Department <strong>of</strong> Medicine, University <strong>of</strong> Utah School <strong>of</strong> Medicine, Salt Lake City, Utah<br />
The authors have indicated <strong>the</strong>y have no financial relationships relevant <strong>to</strong> this article <strong>to</strong> disclose.<br />
ABSTRACT<br />
OBJECTIVE. Effective delivery <strong>of</strong> preventive services is an essential component <strong>of</strong><br />
high-quality pediatric health care. However, both variation in and deviation from<br />
accepted guidelines have been reported. <strong>Learning</strong> collaboratives (LCs) have been<br />
shown <strong>to</strong> result in improvement in several aspects <strong>of</strong> pediatric care. The objective<br />
<strong>of</strong> this study was <strong>to</strong> determine whe<strong>the</strong>r pediatric practices that participated in a<br />
preventive services LC would improve <strong>the</strong>ir delivery <strong>of</strong> preventive services.<br />
METHODS. After conducting an initial audit <strong>of</strong> <strong>the</strong> medical records <strong>of</strong> twenty 2-yearolds<br />
and twenty 4-year-olds for documentation <strong>of</strong> preventive services on <strong>the</strong> basis<br />
<strong>of</strong> national standards, practice teams attended a quality improvement workshop.<br />
They were presented with evidence <strong>to</strong> support <strong>the</strong> value <strong>of</strong> preventive services and<br />
<strong>the</strong> results <strong>of</strong> <strong>the</strong>ir audits and taught quality improvement methods, eg, rapid<br />
cycles <strong>of</strong> change. Each team developed plans <strong>to</strong> improve 1 or more services. Brief<br />
audits with feedback and monthly conference calls were used <strong>to</strong> support practices<br />
<strong>to</strong> conduct rapid cycles <strong>of</strong> change, <strong>to</strong> discuss barriers and solutions, and <strong>to</strong> moni<strong>to</strong>r<br />
progress. The results <strong>of</strong> final chart audits <strong>of</strong> twenty 2-year-olds and 4-year-olds<br />
were compared with <strong>the</strong> initial chart audits. A Preventive Service Score (PSS) was<br />
assigned <strong>to</strong> each practice on <strong>the</strong> basis <strong>of</strong> <strong>the</strong> number <strong>of</strong> services provided, and<br />
initial <strong>to</strong> final comparisons were made.<br />
RESULTS. Fourteen practices participated. PSSs improved for all practices after <strong>the</strong> LC.<br />
Mean PSS for 2-year-olds increased from 4.0 1.1 <strong>to</strong> 4.9 1.2 and for 4-year-olds<br />
increased from 3.8 1.8 <strong>to</strong> 5.6 1.9. The proportions <strong>of</strong> children who received<br />
9 <strong>of</strong> <strong>the</strong> 10 individual preventive services also improved significantly.<br />
CONCLUSION. LCs are a potentially effective method <strong>of</strong> improving <strong>the</strong> quality <strong>of</strong> care<br />
that is delivered by pediatric practices.<br />
www.pediatrics.org/cgi/doi/10.1542/<br />
peds.2005-2210<br />
doi:10;1542/peds.2005-2210<br />
This work was presented in part at <strong>the</strong><br />
Pediatric Academic Societies meeting; May<br />
17, 2005; Washing<strong>to</strong>n, DC.<br />
Key Words<br />
quality improvement, preventive services<br />
Abbreviations<br />
NICHQ—National Initiative for Child<br />
Healthcare Quality<br />
LC—learning collaborative<br />
QI—quality improvement<br />
AAP—American Academy <strong>of</strong> Pediatrics<br />
IPS—Intermountain Pediatric Society<br />
UPIQ—Utah Pediatric Partnership <strong>to</strong><br />
<strong>Improve</strong> Child Healthcare Quality<br />
VCHIP—Vermont Child Health<br />
<strong>Improve</strong>ment Project<br />
PSS—preventive service score<br />
ETS—environmental <strong>to</strong>bacco smoke<br />
Accepted for publication Oct 17, 2005<br />
Address correspondence <strong>to</strong> Paul C. Young,<br />
MD, Department <strong>of</strong> Pediatrics, University <strong>of</strong><br />
Utah School <strong>of</strong> Medicine, 50 N Medical Dr, Salt<br />
Lake City, UT 84132. E-mail: paul.young@hsc.<br />
utah.edu<br />
PEDIATRICS (ISSN Numbers: Print, 0031-4005;<br />
Online, 1098-4275). Copyright © 2006 by <strong>the</strong><br />
American Academy <strong>of</strong> Pediatrics<br />
PEDIATRICS Volume 117, Number 5, May 2006 1469<br />
Downloaded from<br />
www.pediatrics.org at Eccles Health Sciences Lib on August 18, 2008
THE GAP BETWEEN <strong>the</strong> quality <strong>of</strong> health care that patients<br />
should receive and <strong>the</strong> care that <strong>the</strong>y actually<br />
do receive is widely recognized. 1–3 Increasingly, <strong>the</strong><br />
causes <strong>of</strong> this “chasm” are unders<strong>to</strong>od as defects in <strong>the</strong><br />
system in which care is delivered ra<strong>the</strong>r than as resulting<br />
from a lack <strong>of</strong> knowledge or desire on <strong>the</strong> part <strong>of</strong> individual<br />
physicians or o<strong>the</strong>r providers. 2,3 To assist providers<br />
<strong>to</strong> develop <strong>the</strong> knowledge and skills that are necessary<br />
<strong>to</strong> improve quality, national organizations such as<br />
<strong>the</strong> Institute for Healthcare <strong>Improve</strong>ment and <strong>the</strong> National<br />
Initiative for Child Healthcare Quality (NICHQ)<br />
have developed approaches called breakthrough series<br />
and learning collaboratives (LCs). These improvement<br />
partnerships bring health care provider teams <strong>to</strong>ge<strong>the</strong>r<br />
<strong>to</strong> learn how <strong>to</strong> overcome within <strong>the</strong>ir particular system<br />
(eg, a hospital, practice, clinic) <strong>the</strong> barriers that impede<br />
<strong>the</strong> delivery <strong>of</strong> high-quality care. Toge<strong>the</strong>r, <strong>the</strong>y learn <strong>to</strong><br />
identify an explicit quality goal or aim, <strong>to</strong> work with<br />
<strong>the</strong>ir team <strong>to</strong> develop innovative plans for change within<br />
<strong>the</strong>ir system, and <strong>to</strong> use appropriate measurement <strong>to</strong>ols<br />
<strong>to</strong> indicate whe<strong>the</strong>r <strong>the</strong> changes do result in <strong>the</strong> desired<br />
improvement. Two states, Vermont and North Carolina,<br />
have developed statewide improvement partnerships <strong>of</strong><br />
providers and quality experts <strong>to</strong> help pediatric practices<br />
learn about and engage in practice-based quality improvement<br />
(QI) activities. Their reports and those <strong>of</strong><br />
o<strong>the</strong>rs have demonstrated success in improving <strong>the</strong> care<br />
<strong>of</strong> children in <strong>the</strong> areas <strong>of</strong> preventive services, developmental<br />
screening, asthma, and attention/deficit-hyperactivity<br />
disorder. 4–8<br />
Preventive services, also known as well-child care or<br />
health supervision/health promotion, are <strong>the</strong> most common<br />
services delivered by primary care pediatricians.<br />
The American Academy <strong>of</strong> Pediatrics (AAP) has developed<br />
a periodicity schedule, Recommendations for Preventive<br />
Pediatric Health Care, specifying <strong>the</strong> content,<br />
frequency, and timing <strong>of</strong> <strong>the</strong> components <strong>of</strong> preventive<br />
services. 9 Most states and many insurers have adopted<br />
<strong>the</strong> schedule, and <strong>the</strong>re is general agreement that <strong>the</strong><br />
recommendations serve as a standard <strong>of</strong> preventive care<br />
for US children. However, it also is widely known that<br />
many children do not receive many <strong>of</strong> <strong>the</strong> recommended<br />
preventive services.<br />
Responding <strong>to</strong> a perceived need <strong>to</strong> improve quality at<br />
<strong>the</strong> practice level, <strong>the</strong> Utah chapter <strong>of</strong> <strong>the</strong> AAP, also<br />
known as, <strong>the</strong> Intermountain Pediatric Society (IPS),<br />
developed <strong>the</strong> Utah Pediatric Partnership <strong>to</strong> <strong>Improve</strong><br />
Child Healthcare Quality (UPIQ). UPIQ brought <strong>to</strong>ge<strong>the</strong>r<br />
many <strong>of</strong> <strong>the</strong> major stakeholders for child health care<br />
quality in Utah, including, in addition <strong>to</strong> <strong>the</strong> IPS, <strong>the</strong><br />
Department <strong>of</strong> Pediatrics <strong>of</strong> <strong>the</strong> University <strong>of</strong> Utah<br />
School <strong>of</strong> Medicine; <strong>the</strong> Division <strong>of</strong> Health Care Financing<br />
<strong>of</strong> <strong>the</strong> Utah Department <strong>of</strong> Health (Medicaid); <strong>the</strong><br />
Division <strong>of</strong> Family and Community Health Services <strong>of</strong><br />
<strong>the</strong> Utah Department <strong>of</strong> Health; Intermountain Health<br />
Care, a large vertically integrated health care corporation<br />
1470 YOUNG et al<br />
in Utah; and Health Insight, a QI organization. After<br />
consultation with <strong>the</strong> Vermont Child Health <strong>Improve</strong>ment<br />
Project (VCHIP) and <strong>the</strong> NICHQ and with initial<br />
funding from <strong>the</strong> Primary Children’s Medical Center<br />
Foundation, UPIQ conducted an LC that was designed <strong>to</strong><br />
improve <strong>the</strong> delivery <strong>of</strong> preventive services by primary<br />
care pediatrics practices. In this article, we describe how<br />
<strong>the</strong> LC functioned and report its effect on <strong>the</strong> delivery <strong>of</strong><br />
preventive services. We hypo<strong>the</strong>sized that participating<br />
practices would improve <strong>the</strong>ir delivery <strong>of</strong> preventive<br />
services after <strong>the</strong> LC.<br />
METHODS<br />
The LC<br />
Fourteen practices participated in a 4-phase LC; notices<br />
in <strong>the</strong> chapter newsletter, direct mailings <strong>to</strong> provider<br />
<strong>of</strong>fices, and personal contacts by IPS leadership were<br />
used <strong>to</strong> recruit practices for participation. Each practice<br />
formed a team that consisted <strong>of</strong> a pediatrician, a nurse or<br />
medical assistant, and a member <strong>of</strong> <strong>the</strong> <strong>of</strong>fice administrative<br />
staff (eg, receptionist, <strong>of</strong>fice manager). In phase 1<br />
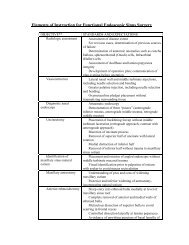
<strong>of</strong> <strong>the</strong> LC, practice teams audited <strong>the</strong> medical records <strong>of</strong><br />
20 <strong>of</strong> <strong>the</strong>ir 2-year-old and 20 <strong>of</strong> <strong>the</strong>ir 4-year-old patients<br />
for evidence that selected preventive services had been<br />
provided. Table 1 displays <strong>the</strong> services that were audited<br />
and <strong>the</strong> criteria that were used for <strong>the</strong> 2 age groups.<br />
Phase 1 was a 1-day QI workshop. In <strong>the</strong> first portion<br />
<strong>of</strong> <strong>the</strong> workshop, a local expert in prevention (Tamara<br />
Lewis, MD, Medical Direc<strong>to</strong>r, Preventive Services, Intermountain<br />
Health Care, Salt Lake City, UT) presented <strong>the</strong><br />
evidence for <strong>the</strong> value <strong>of</strong> preventive services and described<br />
<strong>the</strong> current status <strong>of</strong> prevention efforts in Utah.<br />
Teams <strong>the</strong>n were provided with <strong>the</strong> results <strong>of</strong> <strong>the</strong>ir audits<br />
and, working with UPIQ and VCHIP/NICHQ staff,<br />
identified <strong>the</strong> particular service or services that <strong>the</strong>y<br />
wanted <strong>to</strong> improve. Teams were taught <strong>the</strong> essentials <strong>of</strong><br />
practice-based QI methods on <strong>the</strong> basis <strong>of</strong> <strong>the</strong> “Model for<br />
TABLE 1 Preventive Services Audited<br />
Two-year-olds<br />
Child fully immunizeda Anemia screening by testing or questioning<br />
Dental assessmentb ETS exposurec Four-year-olds<br />
Vision screening attempted or completed<br />
Blood pressure checked<br />
BMI plotted<br />
Dental assessmentb Car seat use assessment<br />
Child fully immunizeda ETS indicates environmental <strong>to</strong>bacco smoke<br />
a Four doses <strong>of</strong> diph<strong>the</strong>ria-tetanus-acellular pertussis/diph<strong>the</strong>ria-tetanus-pertussis, 4 Haemophilus<br />
influenzae type B, 3 inactivated poliovirus, 3 hepatitis B; 1 measles-mumps-rubella,<br />
and 1 varicella zoster virus.<br />
b Oral examination and questioning regarding oral health practices (brushing, fluoride, etc).<br />
c Parent questioned regarding child’s exposure <strong>to</strong> ETS.<br />
Downloaded from<br />
www.pediatrics.org at Eccles Health Sciences Lib on August 18, 2008
<strong>Improve</strong>ment” that was developed by Associates in Process<br />
<strong>Improve</strong>ment (www.apiweb.org) and based on <strong>the</strong><br />
work <strong>of</strong> W. Edwards Deming. Emphasis on “small rapid<br />
cycles <strong>of</strong> change” and <strong>the</strong> “plan, do, study, act” approach<br />
were discussed by <strong>the</strong> VCHIP/NICHQ consultants, who<br />
provided examples that were based on <strong>the</strong> improvement<br />
activities <strong>of</strong> pediatric practices in Vermont. Practice<br />
teams <strong>the</strong>n developed specific plans for change and designed<br />
methods <strong>of</strong> measurement that would enable<br />
<strong>the</strong>m <strong>to</strong> determine whe<strong>the</strong>r <strong>the</strong> plans had resulted in <strong>the</strong><br />
desired improvement. A copy <strong>of</strong> each practice’s plan<br />
<strong>the</strong>n was submitted <strong>to</strong> <strong>the</strong> UPIQ project manager.<br />
The LC’s third phase consisted <strong>of</strong> monthly conference<br />
calls with <strong>the</strong> practices, facilitated by UPIQ staff, and<br />
brief audits <strong>of</strong> <strong>the</strong> medical records <strong>of</strong> five 2-year-olds and<br />
five 4-year-olds. Practices were provided with <strong>the</strong> results<br />
<strong>of</strong> <strong>the</strong>se audits and those <strong>of</strong> <strong>the</strong> o<strong>the</strong>r 13 practices in <strong>the</strong><br />
LC. Each practice’s results were identifiable only <strong>to</strong><br />
<strong>the</strong>m, but <strong>the</strong>y were able <strong>to</strong> compare <strong>the</strong>ir results with<br />
those <strong>of</strong> <strong>the</strong> o<strong>the</strong>r participating practices that were identified<br />
only by a number. During <strong>the</strong> conference calls,<br />
practice teams discussed with each o<strong>the</strong>r and with UPIQ<br />
staff <strong>the</strong>ir plans, results, problems, and <strong>the</strong> approaches<br />
that <strong>the</strong>y had used <strong>to</strong> overcome problems. The third<br />
phase lasted 6 months. Phase 4 was a final audit <strong>of</strong> <strong>the</strong><br />
records <strong>of</strong> twenty 2-year-olds and twenty 4-year-olds<br />
that was conducted by <strong>the</strong> practice teams and that was<br />
identical <strong>to</strong> that in phase 1.<br />
Analysis<br />
We compared <strong>the</strong> results <strong>of</strong> <strong>the</strong> phase 1 and phase 4<br />
audits for each <strong>of</strong> <strong>the</strong> preventive services. For <strong>the</strong> immunization<br />
category, we considered a child <strong>to</strong> be “fully<br />
immunized” when <strong>the</strong>y had received 4 doses <strong>of</strong> diph<strong>the</strong>ria-tetanus-acellularpertussis/diph<strong>the</strong>ria-tetanuspertussis,<br />
4 Haemophilus influenzae type B, 3 inactivated<br />
poliovirus, 3 hepatitis B; 1 measles-mumps-rubella, and<br />
1 varicella zoster virus (4,4,3,3,1,1). Some practices included<br />
audits for heptavalent pneumococcal conjugate<br />
vaccine and hepatitis A, but we did not include <strong>the</strong>se in<br />
<strong>the</strong> determination <strong>of</strong> fully immunized or not, because<br />
<strong>the</strong> recommendation for hepatitis A was relatively new<br />
and <strong>the</strong>re had been national and state shortages <strong>of</strong> heptavalent<br />
pneumococcal conjugate vaccine. We developed<br />
an overall preventive service score (PSS) for <strong>the</strong> 2<br />
age groups. The PSS was calculated by assigning 1 point<br />
for each preventive service provided and summing <strong>the</strong><br />
results. Results <strong>of</strong> <strong>the</strong> phase 1 and phase 4 audits were<br />
compared using first <strong>the</strong> patient and <strong>the</strong>n <strong>the</strong> practice as<br />
<strong>the</strong> units <strong>of</strong> analysis. When <strong>the</strong> patient was <strong>the</strong> unit <strong>of</strong><br />
analysis, each patient had a score <strong>of</strong> 1 when <strong>the</strong> preventive<br />
service was performed and 0 when it was not performed.<br />
Patients were clustered within clinics; <strong>the</strong>refore,<br />
patients in <strong>the</strong> same clinic were more alike than were<br />
patients between clinics. To account for this lack <strong>of</strong><br />
independence in <strong>the</strong> data, we used a random-effects<br />
logistic regression model. The proportion <strong>of</strong> patients<br />
with preventive service performed at phase 1 was compared<br />
with <strong>the</strong> proportion at phase 4, using <strong>the</strong> significance<br />
test for <strong>the</strong> before versus after main effect term. A<br />
matched-pairs approach was not used, because <strong>the</strong> before<br />
and after patients were different patients at <strong>the</strong> 2<br />
sampled time points. For <strong>the</strong> PSS outcome, a randomeffects<br />
linear regression model was used. When <strong>the</strong> practice<br />
or clinic was <strong>the</strong> unit <strong>of</strong> analysis, a summary measure<br />
approach was used. First, <strong>the</strong> proportion <strong>of</strong> patients<br />
for which <strong>the</strong> preventive service was performed, separately<br />
for phase 1 and phase 4, was computed. The<br />
proportions <strong>the</strong>n were compared using a paired sample t<br />
test. The PSS outcome was tested in <strong>the</strong> same way. In<br />
actuality, <strong>the</strong> patient as <strong>the</strong> unit <strong>of</strong> analysis model tested<br />
<strong>the</strong> same hypo<strong>the</strong>sis as <strong>the</strong> practice as <strong>the</strong> unit <strong>of</strong> analysis<br />
comparison. However, <strong>the</strong> paired sample t test provides<br />
a P value that is more aligned with <strong>the</strong> practicelevel<br />
descriptive statistics displayed in <strong>the</strong> corresponding<br />
table, as each practice’s proportion is given equal weight<br />
in <strong>the</strong> significance test, just as in <strong>the</strong> descriptive statistics.<br />
We also used a random-effects logistic regression model<br />
<strong>to</strong> test whe<strong>the</strong>r goal setting had an effect on whe<strong>the</strong>r a<br />
preventive service was performed. In this model, however,<br />
main effects were included for both goal setting<br />
(yes versus no) and time (phase 1 versus phase 4). A goal<br />
setting by time interaction term was used <strong>to</strong> test whe<strong>the</strong>r<br />
goal setting influences change. Specifically, it tested<br />
whe<strong>the</strong>r <strong>the</strong> change from phase 1 <strong>to</strong> phase 4 was greater<br />
when <strong>the</strong> service was set as a goal compared with when<br />
it was not. All reported P values are for 2-sided comparisons,<br />
with a P .05 considered statistically significant.<br />
The University <strong>of</strong> Utah Health Sciences Center Institutional<br />
Review Board approved <strong>the</strong> project. Each practice<br />
team member provided informed consent for his or<br />
her participation. Because no identifiable patient-related<br />
data left <strong>the</strong> practices, patient consent was not required.<br />
RESULTS<br />
Table 2 shows <strong>the</strong> results <strong>of</strong> <strong>the</strong> before and after comparisons<br />
that were performed using <strong>the</strong> <strong>to</strong>tal number <strong>of</strong><br />
patients as <strong>the</strong> unit <strong>of</strong> analysis. In this comparison, <strong>the</strong><br />
proportion <strong>of</strong> children who received 9 <strong>of</strong> <strong>the</strong> 10 preventive<br />
services improved significantly after <strong>the</strong> LC, as did<br />
<strong>the</strong> overall PSS. There was no change in <strong>the</strong> proportion<br />
<strong>of</strong> 4-year-olds who were fully immunized. Because <strong>the</strong><br />
individual practices were <strong>the</strong> targets <strong>of</strong> our intervention<br />
(<strong>the</strong> LC), we performed a second analysis <strong>to</strong> compare <strong>the</strong><br />
before and after proportions <strong>of</strong> children in each <strong>of</strong> <strong>the</strong><br />
individual practices who received <strong>the</strong> preventive services.<br />
Table 3 compares <strong>the</strong> mean proportions and<br />
ranges among <strong>the</strong> practices before and after <strong>the</strong> LC.<br />
Although this analysis revealed considerable variation in<br />
<strong>the</strong> before and after results among <strong>the</strong> practices, <strong>the</strong><br />
majority <strong>of</strong> practices improved <strong>the</strong>ir delivery <strong>of</strong> services.<br />
To determine whe<strong>the</strong>r practices were more likely <strong>to</strong><br />
PEDIATRICS Volume 117, Number 5, May 2006 1471<br />
Downloaded from<br />
www.pediatrics.org at Eccles Health Sciences Lib on August 18, 2008
TABLE 2 Before-and-After Comparisons Using <strong>the</strong> Total Number <strong>of</strong> Patients as <strong>the</strong> Unit <strong>of</strong> Analysis<br />
Preventive Service Performed Initial Final P<br />
Two-year-olds, % <strong>to</strong>tal sample (range among practices) N 267 N 265<br />
Fully immunized 64 (30–100) 81 (41–100) .001a Anemia screening 48 (5–95) 59 (0–100) .002a Dental assessment 67 (20–100) 91 (67–100) .001a ETS exposure assessment 26 (0–85) 65 (0–100) .001a PSS, <strong>to</strong>tal sample mean SD 4.0 1.1 4.9 1.2 .001b Four-year-olds, % <strong>to</strong>tal sample (range among practices) N 277 N 252<br />
Fully immunized 75 (45–100) 75 (22–100) .96a Vision screening 45 (0–100) 78 (30–100) .001a BP screening 59 (10–100) 77 (20–100) .001a BMI recorded 23 (0–90) 47 (0–100) .001a Dental assessment 30 (0–95) 67 (0–100) .001a Car seat advice 39 (0–100) 73 (10–95) .001a PSS, mean SD 3.8 1.8 5.6 1.9 .001b a Random-effects logistic regression.<br />
b Random-effects linear regression.<br />
TABLE 3 Before-and-After Comparisons Using <strong>the</strong> Practice as <strong>the</strong><br />
Unit <strong>of</strong> Analysis<br />
Preventive Service<br />
Performed<br />
Initial Final Pa Two-year-olds, mean % SD N 14 N 14<br />
Fully immunized 65 26 78 14 .15b Anemia screening 49 32 57 39 .36b Dental assessment 68 33 90 12 .034b ETS exposure assessment 29 34 65 37 .011b PSS, mean SD 4.0 0.8 4.9 0.8 .008a Four-year-olds, mean % SD N 14 N 14<br />
Fully immunized 75 17 74 21 .80b Vision screening 46 32 75 24 .007<br />
BP screening 59 35 74 30 .010<br />
BMI recorded 32 31 45 38 .078<br />
Dental assessment 39 36 64 38 .005<br />
Car seat advice 39 38 68 36 .027<br />
PSS, mean SD<br />
a Paired sample t test.<br />
3.8 1.3 5.4 1.6 .001<br />
improve <strong>the</strong> delivery <strong>of</strong> a particular service when <strong>the</strong>y<br />
made improving it a specific goal, we compared <strong>the</strong><br />
amount <strong>of</strong> change between audits for practices that<br />
chose a particular service as an improvement goal with<br />
those that had not selected that service as a goal. These<br />
results are shown in Table 4. Goal setting did seem <strong>to</strong><br />
have an effect on some <strong>of</strong> <strong>the</strong> services. For example,<br />
practices that decided <strong>to</strong> target <strong>the</strong> assessment <strong>of</strong> exposure<br />
<strong>to</strong> environmental <strong>to</strong>bacco smoke (ETS) at <strong>the</strong><br />
2-year well-child checkup demonstrated a mean improvement<br />
<strong>of</strong> 54% (from 25% <strong>to</strong> 79%), where practices<br />
that did not identify this service as a goal showed a mean<br />
improvement <strong>of</strong> 27% starting from a similar baseline. As<br />
can be seen in <strong>the</strong> tables, however, <strong>the</strong> relationship<br />
between goal setting and improvement was inconsistent.<br />
DISCUSSION<br />
There is a widely recognized need <strong>to</strong> improve <strong>the</strong> quality<br />
<strong>of</strong> <strong>the</strong> American health care system. Although <strong>the</strong>re are<br />
many aspects <strong>to</strong> QI, one that has received much atten-<br />
1472 YOUNG et al<br />
TABLE 4 Effect <strong>of</strong> Goal Setting<br />
Preventive Service % at Baseline (% Change) Pa If Service Was a<br />
Goal<br />
If Service Was Not a<br />
Goal<br />
Two-year-olds<br />
Fully immunized 55 (28) 68 (11.5) .075<br />
Anemia screening 48 (14) 48 (10) .58<br />
Dental assessment 46 (47) 76 (13.5) .002<br />
ETS exposure assessment<br />
Four-year-olds<br />
25 (54) 27 (27) .001<br />
Fully immunized 90 (20) 74 (1) .114<br />
Vision screening 42 (32) 49 (34) .80<br />
BP screening 38 (24) 68 (16) .56<br />
BMI plotted 21 (51) 25 (5) .001<br />
Dental assessment 29 (38) 31 (37) .86<br />
Car seat advice<br />
a Random-effects logistic regression.<br />
57 (36) 30 (24) .001<br />
tion is <strong>the</strong> importance <strong>of</strong> reducing deviation and variation<br />
from evidenced-based or generally agreed-on best<br />
practice guidelines for care. Just as <strong>the</strong> goal <strong>of</strong> biomedical<br />
research is <strong>to</strong> reduce <strong>the</strong> gap between “what we know<br />
and what we don’t know,” <strong>the</strong> goal <strong>of</strong> QI interventions<br />
is <strong>to</strong> narrow <strong>the</strong> gap between “what we know and what<br />
we do.” Although <strong>the</strong> evidence base for many aspects <strong>of</strong><br />
primary health care for children is ei<strong>the</strong>r thin or nonexistent,<br />
preventive services generally are agreed on <strong>to</strong> be<br />
beneficial. Their content and value for children generally<br />
are agreed on by pr<strong>of</strong>essional organizations such as <strong>the</strong><br />
AAP, 9 and most pediatricians believe that children who<br />
receive <strong>the</strong>m are likely <strong>to</strong> have better outcomes compared<br />
with those who do not. Some <strong>of</strong> <strong>the</strong> preventive<br />
services that are targeted by <strong>the</strong> UPIQ preventive services<br />
LC, such as immunizations and vision screening,<br />
have a stronger evidence base with regard <strong>to</strong> improved<br />
child health than o<strong>the</strong>rs, such as screening for exposure<br />
<strong>to</strong> ETS by questioning parents or screening for overweight<br />
by determining <strong>the</strong> BMI. 10 Although we recognize<br />
<strong>the</strong> importance <strong>of</strong> conducting research <strong>to</strong> determine<br />
Downloaded from<br />
www.pediatrics.org at Eccles Health Sciences Lib on August 18, 2008
whe<strong>the</strong>r providing preventive services actually benefits<br />
children, <strong>the</strong> mission <strong>of</strong> UPIQ is <strong>to</strong> assist pediatricians<br />
with implementing in <strong>the</strong>ir practice changes that result<br />
in consistently delivering a high level <strong>of</strong> <strong>the</strong> particular<br />
aspect <strong>of</strong> pediatric practice that UPIQ’s leadership, in<br />
collaboration with practitioners, believes <strong>to</strong> be best practice,<br />
on <strong>the</strong> basis <strong>of</strong> <strong>the</strong> available evidence and expert<br />
opinion. There is evidence <strong>to</strong> suggest that even immunizations,<br />
perhaps <strong>the</strong> most uniformly agreed-on preventive<br />
service for children, is provided inconsistently.<br />
5,11<br />
Practice-based QI projects such as <strong>the</strong> one described<br />
here assume that clinicians know what it is <strong>the</strong>y want <strong>to</strong><br />
do but face within <strong>the</strong>ir practices barriers that prevent<br />
<strong>the</strong>m from doing it consistently. They are designed <strong>to</strong><br />
help <strong>the</strong>m first <strong>to</strong> identify <strong>the</strong>se barriers and <strong>the</strong>n <strong>to</strong><br />
develop and implement quickly plans <strong>to</strong> overcome <strong>the</strong><br />
barriers, <strong>to</strong> use measurement <strong>to</strong>ols <strong>to</strong> determine<br />
whe<strong>the</strong>r <strong>the</strong> plans are working, and <strong>to</strong> use rapid small<br />
cycles <strong>of</strong> change <strong>to</strong> make any necessary adjustments.<br />
Our results add <strong>to</strong> a growing body <strong>of</strong> literature that<br />
suggests that when practice teams engage in joint improvement<br />
partnerships and receive appropriate support,<br />
quality does improve in a measurable way. 6–8,12,13<br />
We engaged 14 practices in a preventive services LC<br />
that included prework, ie, an initial determination by<br />
chart audit <strong>of</strong> how well <strong>the</strong>y were doing with delivering<br />
selected preventive services. From <strong>the</strong> list <strong>of</strong> preventive<br />
services that are recommended by <strong>the</strong> AAP’s periodicity<br />
schedule, 9 we chose some traditional services, such as<br />
being up <strong>to</strong> date for immunizations at age 2 and assessing<br />
car seat use, and some that were <strong>of</strong> particular local<br />
interest, such as assessing exposure <strong>to</strong> ETS and determining<br />
and plotting <strong>the</strong> BMI at age 4. Our goal was not<br />
<strong>to</strong> convince practices <strong>of</strong> <strong>the</strong> value <strong>of</strong> <strong>the</strong> selected services<br />
but <strong>to</strong> help practices deliver <strong>the</strong> ones that <strong>the</strong>y <strong>the</strong>mselves<br />
thought were appropriate for <strong>the</strong>ir patients. In<br />
reality, <strong>the</strong> services that we selected required little selling<br />
<strong>to</strong> <strong>the</strong> practices, but <strong>the</strong> teams varied in <strong>the</strong>ir choices <strong>of</strong><br />
services that were targeted for improvement. For example,<br />
7 <strong>of</strong> <strong>the</strong> 14 practices wanted <strong>to</strong> improve <strong>the</strong> proportion<br />
<strong>of</strong> 4-year-olds who had a BMI plotted, 7 wanted <strong>to</strong><br />
improve <strong>the</strong> proportion <strong>of</strong> <strong>the</strong>ir patients who had a<br />
vision screen, and 3 chose <strong>to</strong> improve <strong>the</strong>ir rates <strong>of</strong><br />
anemia screening. Only 1 team chose <strong>to</strong> improve <strong>the</strong><br />
proportion <strong>of</strong> 4-year-olds in <strong>the</strong>ir practice who were<br />
fully immunized. This may reflect <strong>the</strong> results <strong>of</strong> <strong>the</strong><br />
initial audits, which revealed that practices were more<br />
successful in delivering this service than any <strong>of</strong> <strong>the</strong> o<strong>the</strong>rs.<br />
The second phase <strong>of</strong> <strong>the</strong> LC was a 1-day QI workshop.<br />
Presentations were made by VCHIP staff (Drs Paula Duncan<br />
and Wendy Davis and Kim Paul, an improvement<br />
specialist) describing <strong>the</strong> Model for <strong>Improve</strong>ment and<br />
Rapid Cycles <strong>of</strong> Change using “plan, do, study, act”<br />
cycles. The Model for <strong>Improve</strong>ment includes <strong>the</strong> impor-<br />
tance <strong>of</strong> setting a goal (what are we trying <strong>to</strong> achieve?),<br />
<strong>of</strong> developing a plan (what innovative ideas for change<br />
can we develop?), and <strong>the</strong> importance <strong>of</strong> measurement<br />
(how will we know that <strong>the</strong> change resulted in an improvement?).<br />
Teams were provided with <strong>to</strong>ols <strong>to</strong> develop<br />
plans and measurement <strong>to</strong>ols. UPIQ staff <strong>the</strong>n<br />
worked with each team on <strong>the</strong> specific details <strong>of</strong> <strong>the</strong>ir<br />
plans and measures and established <strong>the</strong> pro<strong>to</strong>cols for<br />
follow-up conference calls and audits. Teams had little<br />
difficulty determining which services on which <strong>to</strong> work.<br />
However, <strong>the</strong> importance <strong>of</strong> implementing changes on a<br />
small scale right away and systematically measuring <strong>the</strong><br />
results were new <strong>to</strong> most <strong>of</strong> <strong>the</strong> practices. Those from<br />
larger practices expressed frustration with some <strong>of</strong> <strong>the</strong>ir<br />
earlier attempts at change because <strong>of</strong> a necessity <strong>to</strong> obtain<br />
agreement from everyone in <strong>the</strong> practice before<br />
anything could be changed. UPIQ and VCHIP staff suggested<br />
instead that <strong>the</strong> team start, for example, with 1<br />
physician, on 1 afternoon, with 1 subset <strong>of</strong> patients and<br />
measure what happened. In contrast, 1 solo practitioner<br />
whose entire staff, consisting <strong>of</strong> himself and 3 staff members,<br />
attended <strong>the</strong> workshop, decided on an improvement<br />
plan, and, not needing <strong>to</strong> get approval from anyone<br />
else, implemented it within a few days!<br />
The third phase <strong>of</strong> <strong>the</strong> LC was a 6-month period <strong>of</strong><br />
monthly conference calls, audit, and feedback <strong>to</strong> <strong>the</strong><br />
practices. Practice teams audited 5 charts in each <strong>of</strong> <strong>the</strong><br />
age groups, submitted <strong>the</strong> results <strong>to</strong> UPIQ, and <strong>the</strong>n<br />
were provided with <strong>the</strong>ir results and those <strong>of</strong> <strong>the</strong> o<strong>the</strong>r<br />
participating practices; <strong>the</strong> latter were presented anonymously.<br />
Participation in this phase <strong>of</strong> <strong>the</strong> LC varied from<br />
month <strong>to</strong> month and among <strong>the</strong> practices, but all practices<br />
completed some <strong>of</strong> <strong>the</strong> audits and participated in<br />
some <strong>of</strong> <strong>the</strong> conference calls.<br />
We were gratified with <strong>the</strong> overall improvement in<br />
preventive service delivery as reflected by an increased<br />
number <strong>of</strong> patients overall who received appropriate<br />
services and by improvement in <strong>the</strong> proportions <strong>of</strong> patients<br />
who received most <strong>of</strong> <strong>the</strong> services in most <strong>of</strong> <strong>the</strong><br />
practices. Viewed overall, however, some <strong>of</strong> <strong>the</strong> increases,<br />
although statistically significant, were modest.<br />
Space does not allow presentation <strong>of</strong> <strong>the</strong> results for each<br />
<strong>of</strong> <strong>the</strong> 10 services and <strong>the</strong> 2 PSSs for all 14 practices, but<br />
a few examples demonstrate variations that are obscured<br />
by combining <strong>the</strong> results from all <strong>of</strong> <strong>the</strong> practices. In <strong>the</strong><br />
case <strong>of</strong> screening for anemia, 1 practice increased <strong>the</strong><br />
proportion screened from 40% <strong>to</strong> 100%; ano<strong>the</strong>r practice,<br />
which started at 0, increased <strong>to</strong> only 10%, whereas<br />
ano<strong>the</strong>r increased from 9% <strong>to</strong> 55%. The proportion <strong>of</strong><br />
4-year-olds who had a BMI plotted appropriately increased<br />
from 0% <strong>to</strong> 95% in 1 practice but from 0 <strong>to</strong> only<br />
5% in ano<strong>the</strong>r and, in a third, from an initial rate <strong>of</strong> 90%<br />
<strong>to</strong> 100%. From <strong>the</strong> point <strong>of</strong> view <strong>of</strong> an organization such<br />
as UPIQ, success probably is determined best by an overall<br />
determination <strong>of</strong> how many <strong>of</strong> <strong>the</strong> practices improved<br />
and by how much, but this approach obscures within<br />
PEDIATRICS Volume 117, Number 5, May 2006 1473<br />
Downloaded from<br />
www.pediatrics.org at Eccles Health Sciences Lib on August 18, 2008
practice changes, which are likely <strong>to</strong> be <strong>the</strong> most important<br />
<strong>to</strong> <strong>the</strong> practice teams and will influence how likely<br />
<strong>the</strong>y are <strong>to</strong> extend <strong>the</strong> approach <strong>to</strong> o<strong>the</strong>r services.<br />
One <strong>of</strong> <strong>the</strong> reasons for variability among <strong>the</strong> practices<br />
may have been related <strong>to</strong> whe<strong>the</strong>r <strong>the</strong> practice chose a<br />
particular service as an improvement goal. We anticipated<br />
that a practice would be much more likely <strong>to</strong><br />
improve <strong>the</strong> delivery <strong>of</strong> a service when <strong>the</strong>y chose improving<br />
it as a specific goal. However, as shown in Table<br />
4, this was not consistently <strong>the</strong> case. Of <strong>the</strong> 4 practices<br />
that set improving dental screening <strong>of</strong> 4-year-olds as a<br />
goal, 1 went from 100% <strong>to</strong> 95%, 1 went from 0% <strong>to</strong><br />
60%, and 1 went from 100% <strong>to</strong> 89%, whereas <strong>the</strong> mean<br />
change for <strong>the</strong> o<strong>the</strong>r 11 practices was an improvement<br />
from an initial 33% <strong>to</strong> 65%. Conversely, all 6 practices<br />
that targeted screening for ETS exposure improved<br />
(mean from 30% <strong>to</strong> 80%), whereas only 1 <strong>of</strong> <strong>the</strong> o<strong>the</strong>r<br />
8 improved with respect <strong>to</strong> this service.<br />
O<strong>the</strong>rs have reported positive results from efforts <strong>to</strong><br />
improve quality at <strong>the</strong> practice level. Margolis et al 6<br />
described a randomized, controlled trial that compared<br />
22 primary care practices in North Carolina that received<br />
conventional continuing medical education with 22 that<br />
received continuing medical education plus training in<br />
process improvement. There was significant and sustained<br />
improvement in <strong>the</strong> intervention practices in <strong>the</strong><br />
delivery <strong>of</strong> 4 preventive services <strong>to</strong> children compared<br />
with control practices. In ano<strong>the</strong>r study, this group reported<br />
that delivery <strong>of</strong> appropriate anticipa<strong>to</strong>ry guidance<br />
<strong>to</strong> 1- and 6-month-olds increased significantly in <strong>the</strong><br />
intervention practices compared with control practices,<br />
although <strong>the</strong> final percentages achieved still were relatively<br />
low (24% in <strong>the</strong> 1-month-olds and 18% in <strong>the</strong><br />
6-month-olds). 12 Shaw et al 7 from <strong>the</strong> VCHIP described<br />
significant and clinically important improvement in <strong>the</strong><br />
delivery <strong>of</strong> preventive services by pediatric practices in<br />
Vermont. VCHIP staff served as consultants for <strong>the</strong> UPIQ<br />
project, and <strong>the</strong>re are many similarities between <strong>the</strong><br />
processes that are used by VCHIP and by UPIQ. Some<br />
outcomes <strong>of</strong> care for adults with asthma improved after<br />
a breakthrough series asthma care collaborative involving<br />
6 intervention and 3 control sites. In particular,<br />
patient self-management practices, which were targeted<br />
by <strong>the</strong> faculty and by <strong>the</strong> practices, showed clinically<br />
important levels <strong>of</strong> improvement. 13 More impressive results<br />
with respect <strong>to</strong> asthma were reported by Cloutier et<br />
al. 8 Six primary care urban clinics in Connecticut were<br />
enrolled in a disease management program that resulted<br />
not only in improved adherence <strong>to</strong> National Asthma<br />
Education and Prevention Program guidelines but also in<br />
significant reductions in rates <strong>of</strong> hospitalization and<br />
emergency department visits for children with asthma<br />
after <strong>the</strong> intervention.<br />
Despite <strong>the</strong>se reports <strong>of</strong> success, some have expressed<br />
skepticism regarding <strong>the</strong> benefits <strong>of</strong> quality collaboratives,<br />
citing highly variable results, inconsistent ap-<br />
1474 YOUNG et al<br />
proaches, and generally small sample sizes. 14–17 A recent<br />
Cochrane Review <strong>of</strong> QI interventions that were tailored<br />
specifically <strong>to</strong> identify and overcome barriers <strong>to</strong> change<br />
concluded that <strong>the</strong> effectiveness <strong>of</strong> such interventions<br />
was uncertain and that more rigorous trials were needed.<br />
16<br />
Some experts in QI characterize <strong>the</strong> goals <strong>of</strong> projects<br />
such as <strong>the</strong> one we conducted as improving <strong>the</strong> “reliability”<br />
<strong>of</strong> health care. 18–20 The reliability level is determined<br />
by dividing <strong>the</strong> number <strong>of</strong> times that a service is<br />
provided correctly by <strong>the</strong> <strong>to</strong>tal number <strong>of</strong> times that it<br />
should have been provided. According <strong>to</strong> Nolan et al 18 at<br />
<strong>the</strong> Institute for Healthcare <strong>Improve</strong>ment, level 1 reliability<br />
is achieved when 90% <strong>of</strong> <strong>the</strong> time <strong>the</strong> patient<br />
receives <strong>the</strong> desired care. Stated ano<strong>the</strong>r way, this is an<br />
error rate <strong>of</strong> 10 1 . Some segments <strong>of</strong> <strong>the</strong> American<br />
economy strive for and achieve rates <strong>of</strong> 10 6 . The approach<br />
that we evaluated for this report is unlikely <strong>to</strong><br />
achieve rates that exceed level 1, according <strong>to</strong> many<br />
experts. 18–20 However, <strong>the</strong> practices that agreed <strong>to</strong> participate<br />
in our LC were not achieving rates <strong>of</strong> 90%<br />
reliability in <strong>the</strong> delivery <strong>of</strong> preventive services. Achieving<br />
even level 1 reliability would be, we believe, <strong>of</strong> great<br />
value for our patients.<br />
Research <strong>to</strong> determine <strong>the</strong> best method <strong>of</strong> improving<br />
health care and evaluating whe<strong>the</strong>r a particular QI intervention<br />
has been successful and whe<strong>the</strong>r its results<br />
are generalizable presents numerous challenges. 14–21<br />
Krumholz and Herin 21 listed 5 challenges that those who<br />
conduct QI studies face. First are <strong>the</strong> issues <strong>of</strong> sample size<br />
and units <strong>of</strong> analysis. Because <strong>the</strong> target <strong>of</strong> most interventions<br />
is an individual hospital, practice, or physician,<br />
analysis <strong>of</strong> patient outcomes may be inappropriate because<br />
<strong>of</strong> <strong>the</strong> effect <strong>of</strong> clustering. Analyzing at <strong>the</strong> level <strong>of</strong><br />
a practice or a hospital results in much smaller sample<br />
sizes and loss <strong>of</strong> power. We analyzed our results using<br />
both patients and <strong>the</strong> practices as <strong>the</strong> units <strong>of</strong> analysis,<br />
and, although <strong>the</strong> magnitude and precision <strong>of</strong> <strong>the</strong> findings<br />
differ, <strong>the</strong> overall results were similar. A second<br />
challenge is that studies that compare an intervention<br />
with a control group are subject <strong>to</strong> “contamination.” We<br />
used a before-and-after design ra<strong>the</strong>r than a randomized<br />
cohort approach and, consistent with <strong>the</strong> “collaborative”<br />
model, encouraged <strong>the</strong> practices <strong>to</strong> communicate and<br />
share ideas, so this consideration may not apply <strong>to</strong> this<br />
type <strong>of</strong> project. A third challenge is that <strong>the</strong> ideal time <strong>to</strong><br />
assess <strong>the</strong> effect <strong>of</strong> an intervention is not clear. We<br />
assessed at <strong>the</strong> end <strong>of</strong> a 6-month intervention, but,<br />
clearly, not knowing whe<strong>the</strong>r improvements were sustained<br />
and whe<strong>the</strong>r <strong>the</strong> practices used <strong>the</strong> approach <strong>to</strong><br />
improve in o<strong>the</strong>r areas is an important limitation <strong>of</strong> our<br />
study. A fourth challenge, according <strong>to</strong> Krumholz, is <strong>the</strong><br />
generalizability <strong>of</strong> <strong>the</strong> intervention. We used <strong>the</strong> Model<br />
for <strong>Improve</strong>ment method that has been reported <strong>to</strong> be<br />
successful by o<strong>the</strong>rs, but <strong>the</strong> fact that our practices all<br />
had volunteered <strong>to</strong> participate in <strong>the</strong> LC and are in a<br />
Downloaded from<br />
www.pediatrics.org at Eccles Health Sciences Lib on August 18, 2008
particular geographic area are important for o<strong>the</strong>rs <strong>to</strong><br />
consider when developing <strong>the</strong>ir own QI initiatives. Finally,<br />
most QI interventions actually contain multiple<br />
strategies, and it is difficult <strong>to</strong> determine which component<br />
is most effective. The LC that we describe here<br />
contained at least 4 components: baseline measurement;<br />
a 1-day workshop; a 6-month period <strong>of</strong> conference calls,<br />
audit, and feedback; and a final measurement. We did<br />
not attempt <strong>to</strong> determine or compare <strong>the</strong> value <strong>of</strong> any <strong>of</strong><br />
<strong>the</strong>se individual components, and it is potentially important<br />
<strong>to</strong> do so. For example, <strong>the</strong> 1-day workshop required<br />
that a 3-person team from each practice attend, but we<br />
acknowledge that <strong>the</strong> absence <strong>of</strong> key personnel from a<br />
practice is disruptive and expensive. We believe that<br />
bringing <strong>the</strong> practice teams <strong>to</strong>ge<strong>the</strong>r <strong>to</strong> hear experts in<br />
QI <strong>to</strong> develop jointly plans for change and appropriate<br />
measurement <strong>to</strong>ols was a valuable part <strong>of</strong> <strong>the</strong> LC, but if<br />
measurement, audit, feedback, and brief conference calls<br />
alone were just as effective, <strong>the</strong>n more practices may be<br />
willing <strong>to</strong> participate. Additional research that is devoted<br />
<strong>to</strong> examining which components <strong>of</strong> a QI project or an LC<br />
and doing so in a more rigorous manner should be<br />
undertaken. 21<br />
In addition <strong>to</strong> <strong>the</strong> issues noted above, <strong>the</strong>re are several<br />
o<strong>the</strong>r important limitations <strong>to</strong> <strong>the</strong> study reported<br />
here. First, participation in <strong>the</strong> LC was voluntary; <strong>the</strong><br />
practice teams that participated may not be representative<br />
<strong>of</strong> pediatric practices in general. Second, <strong>the</strong>re were<br />
no control practices. It is possible that <strong>the</strong> practices that<br />
did participate might have improved without participating<br />
in <strong>the</strong> LC. Third, <strong>the</strong> before-and-after results are<br />
based on data from chart audits <strong>of</strong> a modest number <strong>of</strong><br />
patients. Fourth, we did not attempt <strong>to</strong> measure actual<br />
child health outcomes, and we cannot assume that even<br />
if <strong>the</strong> children had received <strong>the</strong> services, <strong>the</strong>ir health<br />
would be better. Finally, we do not know whe<strong>the</strong>r <strong>the</strong>se<br />
results will be sustained over time.<br />
Despite <strong>the</strong> limitations <strong>of</strong> our study and <strong>of</strong> those<br />
reported by o<strong>the</strong>rs, our findings are suggestive that motivated<br />
practice teams can learn and apply easily basic<br />
improvement methods and, when <strong>the</strong>y do so, that <strong>the</strong><br />
quality <strong>of</strong> <strong>the</strong> care that <strong>the</strong>y deliver seems <strong>to</strong> improve.<br />
However, we believe that pediatricians want <strong>to</strong> improve<br />
<strong>the</strong> reliability <strong>of</strong> preventive and o<strong>the</strong>r services beyond<br />
<strong>the</strong> levels achieved here. Nolan et al 18 described <strong>the</strong><br />
attitudes and innovations that are required <strong>to</strong> achieve<br />
95% <strong>to</strong> 98% reliability in health care settings, and interested<br />
readers are referred <strong>to</strong> <strong>the</strong>ir white paper, which<br />
is downloadable from <strong>the</strong> Institute for Healthcare <strong>Improve</strong>ment<br />
(www.ihi.org).<br />
Although we chose <strong>to</strong> focus on <strong>the</strong> preventive services<br />
that are listed in <strong>the</strong> AAP guidelines, 9 some have<br />
suggested that new approaches <strong>to</strong> well-child care, emphasizing<br />
behavioral and developmental issues, are<br />
needed. 22 We believe that <strong>the</strong> approach described here<br />
could be used easily <strong>to</strong> target and improve <strong>the</strong> quality <strong>of</strong><br />
care related <strong>to</strong> <strong>the</strong>se important services. We also believe<br />
that participation in LCs or similar improvement partnerships<br />
that are led by state AAP chapters or o<strong>the</strong>r<br />
pr<strong>of</strong>essional organizations would be a good way for pediatricians<br />
<strong>to</strong> meet <strong>the</strong> American Board <strong>of</strong> Pediatrics’<br />
new requirements for pediatricians <strong>to</strong> engage in QI activities<br />
<strong>to</strong> maintain <strong>the</strong>ir board certification.<br />
ACKNOWLEDGMENTS<br />
This project was supported in part by a grant from <strong>the</strong><br />
Primary Children’s Medical Center Foundation and a<br />
Building Research Infrastructure and Capacity grant<br />
from <strong>the</strong> Agency for Healthcare Research and Quality<br />
(59001414).<br />
REFERENCES<br />
1. Homer CJ. Quality in pediatrics: a progress report <strong>to</strong> <strong>the</strong> American<br />
Academy <strong>of</strong> Pediatrics. Pediatrics. 2001;108:1362–1364<br />
2. Committee on Quality <strong>of</strong> Health Care in America, Institute <strong>of</strong><br />
Medicine. Crossing <strong>the</strong> Quality Chasm: A New Health System for <strong>the</strong><br />
21st Century. Washing<strong>to</strong>n, DC: National Academy Press; 2001<br />
3. Plsek P. Quality improvement methods in clinical medicine.<br />
Pediatrics. 1999;103(1 suppl E):203–214<br />
4. Bordley WC, Margolis PA, Stuart J, Cannon C, Keyes L. Improving<br />
preventive service delivery through <strong>of</strong>fice systems.<br />
Pediatrics. 2001;108:1–8<br />
5. Bordley WC, Margolis PA, Lannon CM. The delivery <strong>of</strong> immunizations<br />
and o<strong>the</strong>r preventive services in private practices.<br />
Pediatrics. 1996;97:467–485<br />
6. Margolis PA, Lannon CM, Stuart JM, Fried BJ, Keyes-Elstein L,<br />
Moore DE Jr. Practice based education <strong>to</strong> improve delivery<br />
systems for prevention in primary care: randomized trial. BMJ.<br />
2004;328:388<br />
7. Shaw J, Wasserman R, Barry S, et al. Statewide QI outreach<br />
improves preventive services for young children [abstract].<br />
Pediatr Res. 2003;53:21A<br />
8. Cloutier MM, Hall CB, Wakefield DB, Bailit H. Use <strong>of</strong> asthma<br />
guidelines by primary care providers <strong>to</strong> reduce hospitalizations<br />
and emergency department visits in poor minority, urban children.<br />
J Pediatr. 2005;146:591–597<br />
9. American Academy <strong>of</strong> Pediatrics, Committee on Practice and<br />
Ambula<strong>to</strong>ry Medicine. Recommendations for Preventive Pediatric<br />
Health Care. Pediatrics. 2000;105:645–646<br />
10. US Preventive Services Task Force. Guide <strong>to</strong> Clinical Preventive<br />
Services. 3rd ed. 2000–2002. Washing<strong>to</strong>n, DC: Office <strong>of</strong> Disease<br />
Prevention and Health Promotion, US Government Printing<br />
Office; 2002<br />
11. Centers for Disease Control and Prevention (CDC). National,<br />
state, and urban area vaccination coverage levels among children<br />
aged 19–35 months. United States, 2000. MMWR Morb<br />
Mortal Wkly Rep. 2001;50:637–641<br />
12. Rosenthal MS, Lannon CM, Stuart JM, Brown L, Miller WC,<br />
Margolis PA. A randomized trial <strong>of</strong> practice based education <strong>to</strong><br />
improve delivery systems for anticipa<strong>to</strong>ry guidance. Arch Pediatr<br />
Adolesc Med. 2005;159:456–463<br />
13. Schonlau M, Mangione-Smith R, Chan KS, et al. <strong>Evaluation</strong> <strong>of</strong><br />
a quality improvement collaborative in asthma care: does it<br />
improve processes and outcomes <strong>of</strong> care? Ann Fam Med. 2005;<br />
3:200–208<br />
14. Ovretveit J, Bate P, Clkeary P, et al. Quality collaboratives:<br />
lessons from research. Qual Saf Health Care. 2002;11:345–351<br />
PEDIATRICS Volume 117, Number 5, May 2006 1475<br />
Downloaded from<br />
www.pediatrics.org at Eccles Health Sciences Lib on August 18, 2008
15. Solberg LI. If you’ve seen one quality improvement collaborative.<br />
...Ann Fam Med. 2005;3:198–199<br />
16. Shaw B, Cheater F, Baker R, et al. Tailored interventions <strong>to</strong><br />
overcome identified barriers <strong>to</strong> change: effects on pr<strong>of</strong>essional<br />
practice and health care outcomes [Cochrane review]. In: The<br />
Cochrane Library, Issue 3. Chichester, United Kingdom: John<br />
Wiley & Sons, Ltd; 2005<br />
17. Mittman BS. Creating <strong>the</strong> evidence base for quality improvement<br />
collaboratives. Ann Intern Med. 2004;140:897–901<br />
18. Nolan T, Resar R, Haraden C, Griffen FA. Improving <strong>the</strong> Reliability<br />
<strong>of</strong> Health Care. Cambridge, MA: Institute for Healthcare<br />
1476 YOUNG et al<br />
INTERNATIONAL TELERADIOLOGY<br />
<strong>Improve</strong>ment; 2004. Available at: www.ihi.org. Accessed Oc<strong>to</strong>ber<br />
10, 2005<br />
19. Muething SE, Kotagal U. Reliability <strong>of</strong> <strong>the</strong> health care delivery<br />
system. J Pediatr. 2005;146:581–582<br />
20. Ac<strong>to</strong>n JD, Kotegal U. <strong>Improve</strong>ments in healthcare: how can we<br />
change <strong>the</strong> outcome? J Pediatr. 2005;147:279–281<br />
21. Krumholz HM, Herin J. Quality improvement studies: <strong>the</strong><br />
need is <strong>the</strong>re but so are <strong>the</strong> challenges. Am J Med. 2000;109:<br />
501–503<br />
22. Schor EL. Rethinking well-child care. Pediatrics. 2004;114:<br />
210–216<br />
“In published studies <strong>of</strong> teleradiology, reports <strong>of</strong> technical problems have<br />
been rare, and <strong>the</strong> readings have been rapid (average turnaround, one hour)<br />
and accurate. The American College <strong>of</strong> Radiology (ACR) had, unsurprisingly,<br />
stated that it is ‘very concerned’ about overseas teleradiology, though its<br />
concern is tempered by a recognition that <strong>the</strong> practice fills a vacuum left by<br />
its own members, who would like <strong>to</strong> sleep at night. The ACR recommends<br />
that radiologists who are performing distant readings be board certified and<br />
carry licenses and malpractice coverage in <strong>the</strong> state where <strong>the</strong> image was<br />
obtained and appropriate credentials at <strong>the</strong> source facility. Several hundred<br />
US hospitals use overseas teleradiology services. Industry leaders, such as<br />
Teleradiology Solutions, NightHawk Radiology Services, and Virtual Radiologic,<br />
state that <strong>the</strong>y adhere <strong>to</strong> <strong>the</strong> ACR guidelines with respect <strong>to</strong> licensure,<br />
insurance, and hospital privileges. As for compensation, regulations <strong>of</strong> <strong>the</strong><br />
Centers for Medicare and Medicaid Services (CMS) prohibit payments <strong>to</strong><br />
providers outside <strong>the</strong> United States—an obstacle that many <strong>of</strong> <strong>the</strong> companies<br />
finesse by providing a ‘preliminary report,’ which is later followed by a US<br />
radiologist’s ‘final primary report.’ The overseas radiologists are paid directly<br />
(by <strong>the</strong> hospital or <strong>the</strong> local radiologists) at a rate <strong>of</strong> $50 <strong>to</strong> $75 per radiograph,<br />
whereas <strong>the</strong> local radiologists bill <strong>the</strong> payer.”<br />
Wachter R. The ‘dislocation’ <strong>of</strong> US medicine—<strong>the</strong> implications <strong>of</strong> medical outsourcing. N Engl J Med.<br />
354; 7, February 16, 2006<br />
Noted by JFL, MD<br />
Downloaded from<br />
www.pediatrics.org at Eccles Health Sciences Lib on August 18, 2008
<strong>Evaluation</strong> <strong>of</strong> a <strong>Learning</strong> <strong>Collaborative</strong> <strong>to</strong> <strong>Improve</strong> <strong>the</strong> <strong>Delivery</strong> <strong>of</strong> Preventive<br />
Services by Pediatric Practices<br />
Paul C. Young, Gordon B. Glade, Gregory J. S<strong>to</strong>ddard and Chuck Norlin<br />
Pediatrics 2006;117;1469-1476<br />
DOI: 10.1542/peds.2005-2210<br />
Updated Information<br />
& Services<br />
References<br />
Citations<br />
Subspecialty Collections<br />
Permissions & Licensing<br />
Reprints<br />
including high-resolution figures, can be found at:<br />
http://www.pediatrics.org/cgi/content/full/117/5/1469<br />
This article cites 18 articles, 11 <strong>of</strong> which you can access for free<br />
at:<br />
http://www.pediatrics.org/cgi/content/full/117/5/1469#BIBL<br />
This article has been cited by 3 HighWire-hosted articles:<br />
http://www.pediatrics.org/cgi/content/full/117/5/1469#o<strong>the</strong>rartic<br />
les<br />
This article, along with o<strong>the</strong>rs on similar <strong>to</strong>pics, appears in <strong>the</strong><br />
following collection(s):<br />
Office Practice<br />
http://www.pediatrics.org/cgi/collection/<strong>of</strong>fice_practice<br />
Information about reproducing this article in parts (figures,<br />
tables) or in its entirety can be found online at:<br />
http://www.pediatrics.org/misc/Permissions.shtml<br />
Information about ordering reprints can be found online:<br />
http://www.pediatrics.org/misc/reprints.shtml<br />
Downloaded from<br />
www.pediatrics.org at Eccles Health Sciences Lib on August 18, 2008