CHAPTER 35 TROPICAL CYCLONES - Maritime Safety Information
CHAPTER 35 TROPICAL CYCLONES - Maritime Safety Information
CHAPTER 35 TROPICAL CYCLONES - Maritime Safety Information

You also want an ePaper? Increase the reach of your titles
YUMPU automatically turns print PDFs into web optimized ePapers that Google loves.
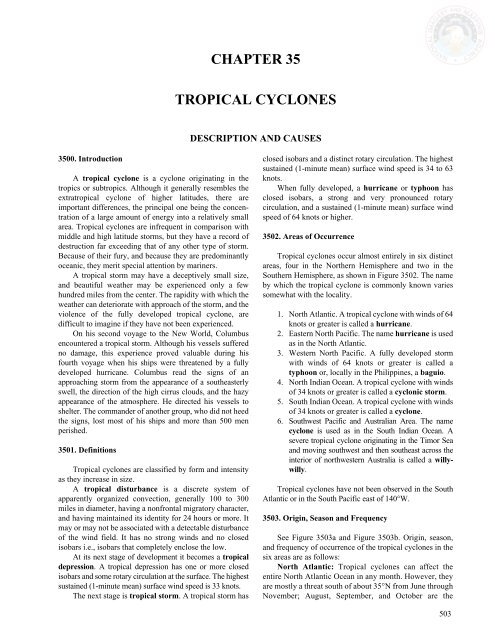
<strong>35</strong>00. Introduction<br />
A tropical cyclone is a cyclone originating in the<br />
tropics or subtropics. Although it generally resembles the<br />
extratropical cyclone of higher latitudes, there are<br />
important differences, the principal one being the concentration<br />
of a large amount of energy into a relatively small<br />
area. Tropical cyclones are infrequent in comparison with<br />
middle and high latitude storms, but they have a record of<br />
destruction far exceeding that of any other type of storm.<br />
Because of their fury, and because they are predominantly<br />
oceanic, they merit special attention by mariners.<br />
A tropical storm may have a deceptively small size,<br />
and beautiful weather may be experienced only a few<br />
hundred miles from the center. The rapidity with which the<br />
weather can deteriorate with approach of the storm, and the<br />
violence of the fully developed tropical cyclone, are<br />
difficult to imagine if they have not been experienced.<br />
On his second voyage to the New World, Columbus<br />
encountered a tropical storm. Although his vessels suffered<br />
no damage, this experience proved valuable during his<br />
fourth voyage when his ships were threatened by a fully<br />
developed hurricane. Columbus read the signs of an<br />
approaching storm from the appearance of a southeasterly<br />
swell, the direction of the high cirrus clouds, and the hazy<br />
appearance of the atmosphere. He directed his vessels to<br />
shelter. The commander of another group, who did not heed<br />
the signs, lost most of his ships and more than 500 men<br />
perished.<br />
<strong>35</strong>01. Definitions<br />
Tropical cyclones are classified by form and intensity<br />
as they increase in size.<br />
A tropical disturbance is a discrete system of<br />
apparently organized convection, generally 100 to 300<br />
miles in diameter, having a nonfrontal migratory character,<br />
and having maintained its identity for 24 hours or more. It<br />
may or may not be associated with a detectable disturbance<br />
of the wind field. It has no strong winds and no closed<br />
isobars i.e., isobars that completely enclose the low.<br />
At its next stage of development it becomes a tropical<br />
depression. A tropical depression has one or more closed<br />
isobars and some rotary circulation at the surface. The highest<br />
sustained (1-minute mean) surface wind speed is 33 knots.<br />
The next stage is tropical storm. A tropical storm has<br />
<strong>CHAPTER</strong> <strong>35</strong><br />
<strong>TROPICAL</strong> <strong>CYCLONES</strong><br />
DESCRIPTION AND CAUSES<br />
closed isobars and a distinct rotary circulation. The highest<br />
sustained (1-minute mean) surface wind speed is 34 to 63<br />
knots.<br />
When fully developed, a hurricane or typhoon has<br />
closed isobars, a strong and very pronounced rotary<br />
circulation, and a sustained (1-minute mean) surface wind<br />
speed of 64 knots or higher.<br />
<strong>35</strong>02. Areas of Occurrence<br />
Tropical cyclones occur almost entirely in six distinct<br />
areas, four in the Northern Hemisphere and two in the<br />
Southern Hemisphere, as shown in Figure <strong>35</strong>02. The name<br />
by which the tropical cyclone is commonly known varies<br />
somewhat with the locality.<br />
1. North Atlantic. A tropical cyclone with winds of 64<br />
knots or greater is called a hurricane.<br />
2. Eastern North Pacific. The name hurricane is used<br />
as in the North Atlantic.<br />
3. Western North Pacific. A fully developed storm<br />
with winds of 64 knots or greater is called a<br />
typhoon or, locally in the Philippines, a baguio.<br />
4. North Indian Ocean. A tropical cyclone with winds<br />
of 34 knots or greater is called a cyclonic storm.<br />
5. South Indian Ocean. A tropical cyclone with winds<br />
of 34 knots or greater is called a cyclone.<br />
6. Southwest Pacific and Australian Area. The name<br />
cyclone is used as in the South Indian Ocean. A<br />
severe tropical cyclone originating in the Timor Sea<br />
and moving southwest and then southeast across the<br />
interior of northwestern Australia is called a willywilly.<br />
Tropical cyclones have not been observed in the South<br />
Atlantic or in the South Pacific east of 140°W.<br />
<strong>35</strong>03. Origin, Season and Frequency<br />
See Figure <strong>35</strong>03a and Figure <strong>35</strong>03b. Origin, season,<br />
and frequency of occurrence of the tropical cyclones in the<br />
six areas are as follows:<br />
North Atlantic: Tropical cyclones can affect the<br />
entire North Atlantic Ocean in any month. However, they<br />
are mostly a threat south of about <strong>35</strong>°N from June through<br />
November; August, September, and October are the<br />
503
504 <strong>TROPICAL</strong> <strong>CYCLONES</strong><br />
Figure <strong>35</strong>02. Areas in which tropical cyclones occur. The average number of tropical cyclones per 5˚ square has been<br />
analyzed for this figure. The main season for intense tropical storm activity is also shown for each major basin.<br />
months of highest incidence. See Figure <strong>35</strong>03b. About 9<br />
or 10 tropical cyclones (tropical storms and hurricanes)<br />
form each season; 5 or 6 reach hurricane intensity (winds<br />
of 64 knots and higher). A few hurricanes have generated<br />
winds estimated as high as 200 knots. Early and late<br />
season storms usually develop west of 50°W; during<br />
August and September, this spawning ground extends to<br />
the Cape Verde Islands. These storms usually move<br />
westward or west northwestward at speeds of less than 15<br />
knots in the lower latitudes. After moving into the<br />
northern Caribbean or Greater Antilles regions, they<br />
usually either move toward the Gulf of Mexico or recurve<br />
and accelerate in the North Atlantic. Some will recurve<br />
after reaching the Gulf of Mexico, while others will<br />
continue westward to a landfall in Texas or Mexico.<br />
Eastern North Pacific: The season is from June<br />
through October, although a storm can form in any month.<br />
An average of 15 tropical cyclones form each year with<br />
about 6 reaching hurricane strength. The most intense<br />
storms are often the early- and late-season ones; these form<br />
close to the coast and far south. Mid season storms form<br />
anywhere in a wide band from the Mexican-Central<br />
American coast to the Hawaiian Islands. August and<br />
September are the months of highest incidence. These<br />
storms differ from their North Atlantic counterparts in that<br />
they are usually smaller in size. However, they can be just<br />
as intense.<br />
Western North Pacific: More tropical cyclones form<br />
in the tropical western North Pacific than anywhere else in<br />
the world. More than 25 tropical storms develop each year,<br />
and about 18 become typhoons. These typhoons are the largest<br />
and most intense tropical cyclones in the world. Each<br />
year an average of five generate maximum winds over 130<br />
knots; circulations covering more than 600 miles in diameter<br />
are not uncommon. Most of these storms form east of the<br />
Philippines, and move across the Pacific toward the Philippines,<br />
Japan, and China; a few storms form in the South<br />
China Sea. The season extends from April through December.<br />
However, tropical cyclones are more common in the<br />
off-season months in this area than anywhere else. The peak<br />
of the season is July through October, when nearly 70 percent<br />
of all typhoons develop. There is a noticeable seasonal<br />
shift in storm tracks in this region. From July through September,<br />
storms move north of the Philippines and recurve,<br />
while early- and late-season typhoons move on a more westerly<br />
track through the Philippines before recurving.
<strong>TROPICAL</strong> <strong>CYCLONES</strong> 505<br />
Figure <strong>35</strong>03a. Storm tracks.The width of the arrow indicates the approximate frequency of storms; the wider the arrow<br />
the higher the frequency. Isolines on the base map show the resultant direction toward which storms moved. Data for the<br />
entire year has been summarized for this figure.<br />
AREA AND STAGE JAN FEB MAR APR MAY JUN JUL AUG SEP OCT NOV DEC ANNUAL<br />
NORTH ATLANTIC<br />
<strong>TROPICAL</strong> STORMS * * * * 0.1 0.4 0.3 1.0 1.5 1.2 0.4 * 4.2<br />
HURRICANES * * * * * 0.3 0.4 1.5 2.7 1.3 0.3 * 5.2<br />
<strong>TROPICAL</strong> STORMS AND HURRICANES * * * * 0.2 0.7 0.8 2.5 4.3 2.5 0.7 0.1 9.4<br />
JAN FEB MAR APR MAY JUN JUL AUG SEP OCT NOV DEC ANNUAL<br />
EASTERN NORTH PACIFIC<br />
<strong>TROPICAL</strong> STORMS * * * * * 1.5 2.8 2.3 2.3 1.2 0.3 * 9.3<br />
HURRICANES * * * * 0.3 0.6 0.9 2.0 1.8 1.0 * * 5.8<br />
<strong>TROPICAL</strong> STORMS AND HURRICANES * * * * 0.3 2.0 3.6 4.5 4.1 2.2 0.3 * 15.2<br />
JAN FEB MAR APR MAY JUN JUL AUG SEP OCT NOV DEC ANNUAL<br />
WESTERN NORTH PACIFIC<br />
<strong>TROPICAL</strong> STORMS 0.2 0.3 0.3 0.2 0.4 0.5 1.2 1.8 1.5 1.0 0.8 0.6 7.5<br />
TYPHOONS 0.3 0.2 0.2 0.7 0.9 1.2 2.7 4.0 4.1 3.3 2.1 0.7 17.8<br />
<strong>TROPICAL</strong> STORMS AND TYPHOONS 0.4 0.4 0.5 0.9 1.3 1.8 3.9 5.8 5.6 4.3 2.9 1.3 25.3<br />
JAN FEB MAR APR MAY JUN JUL AUG SEP OCT NOV DEC ANNUAL<br />
SOUTHWEST PACIFIC AND AUSTRALIAN AREA<br />
<strong>TROPICAL</strong> STORMS 2.7 2.8 2.4 1.3 0.3 0.2 * * * 0.1 0.4 1.5 10.9<br />
HURRICANES 0.7 1.1 1.3 0.3 * * 0.1 0.1 * * 0.3 0.5 3.8<br />
<strong>TROPICAL</strong> STORMS AND HURRICANES 3.4 4.1 3.7 1.7 0.3 0.2 0.1 0.1 * 0.1 0.7 2.0 14.8<br />
JAN FEB MAR APR MAY JUN JUL AUG SEP OCT NOV DEC ANNUAL<br />
SOUTHWEST INDIAN OCEAN<br />
<strong>TROPICAL</strong> STORMS 2.0 2.2 1.7 0.6 0.2 * * * * 0.3 0.3 0.8 7.4<br />
HURRICANES 1.3 1.1 0.8 0.4 * * * * * * * 0.5 3.8<br />
<strong>TROPICAL</strong> STORMS AND HURRICANES 3.2 3.3 2.5 1.1 0.2 * * * * 0.3 0.4 1.4 11.2<br />
* Less than 0.05 1Winds ≥ 48 Kts.<br />
Monthly values cannot be combined because single storms overlapping two months were counted once in each month and once in the annual.<br />
Figure <strong>35</strong>03b. Monthly and annual average number of storms per year for each area.
506 <strong>TROPICAL</strong> <strong>CYCLONES</strong><br />
AREA AND STAGE<br />
NORTH INDIAN OCEAN<br />
JAN FEB MAR APR MAY JUN JUL AUG SEP OCT NOV DEC ANNUAL<br />
<strong>TROPICAL</strong> STORMS 0.1 * * 0.1 0.3 0.5 0.5 0.4 0.4 0.6 0.5 0.3 3.5<br />
<strong>CYCLONES</strong><br />
1 * * * 0.1 0.5 0.2 0.1 * 0.1 0.4 0.6 0.2 2.2<br />
<strong>TROPICAL</strong> STORMS AND <strong>CYCLONES</strong><br />
1 0.1 * 0.1 0.3 0.7 0.7 0.6 0.4 0.5 1.0 1.1 0.5 5.7<br />
* Less than 0.05 1Winds ≥ 48 Kts.<br />
Monthly values cannot be combined because single storms overlapping two months were counted once in each month and once in the annual.<br />
North Indian Ocean—Tropical cyclones develop in<br />
the Bay of Bengal and Arabian Sea during the spring and<br />
fall. Tropical cyclones in this area form between latitudes<br />
8°N and 15°N, except from June through September, when<br />
the little activity that does occur is confined north of about<br />
15°N. These storms are usually short-lived and weak;<br />
however, winds of 130 knots have been encountered. They<br />
often develop as disturbances along the Intertropical<br />
Convergence Zone (ITCZ); this inhibits summertime<br />
development, since the ITCZ is usually over land during<br />
this monsoon season. However, it is sometimes displaced<br />
southward, and when this occurs, storms will form over the<br />
monsoon-flooded plains of Bengal. On the average, six<br />
cyclonic storms form each year. These include two storms<br />
that generate winds of 48 knots or greater. Another 10<br />
tropical cyclones never develop beyond tropical<br />
depressions. The Bay of Bengal is the area of highest<br />
incidence. However, it is not unusual for a storm to move<br />
across southern India and reintensify in the Arabian Sea.<br />
This is particularly true during October, the month of<br />
highest incidence during the tropical cyclone season. It is<br />
also during this period that torrential rains from these<br />
storms, dumped over already rain-soaked areas, cause<br />
disastrous floods.<br />
South Indian Ocean—Over the waters west of 100°E,<br />
to the east African coast, an average of 11 tropical cyclones<br />
<strong>35</strong>04. Formation<br />
Figure <strong>35</strong>03b. Monthly and annual average number of storms per year for each area.<br />
Hurricane formation was once believed to result from<br />
an intensification of convective forces which produce the<br />
towering cumulonimbus clouds of the doldrums. This view<br />
of hurricane generation held that surface heating caused<br />
warm moist air to ascend convectively to levels where<br />
condensation produced cumulonimbus clouds, which, after<br />
an inexplicable drop in atmospheric pressure, coalesced<br />
and were spun into a cyclonic motion by Coriolis force.<br />
This hypothesis left much unexplained. Although some<br />
hurricanes develop from disturbances beginning in the doldrums,<br />
very few reach maturity in that region. Also, the high<br />
incidence of seemingly ideal convective situations does not<br />
match the low incidence of Atlantic hurricanes. Finally, the<br />
hypothesis did not explain the drop in atmospheric pressure,<br />
so essential to development of hurricane-force winds.<br />
There is still no exact understanding of the triggering<br />
mechanism involved in hurricane generation, the balance of<br />
ANATOMY OF <strong>TROPICAL</strong> <strong>CYCLONES</strong><br />
(tropical storms and hurricanes) form each season, and<br />
about 4 reach hurricane intensity. The season is from<br />
December through March, although it is possible for a<br />
storm to form in any month. Tropical cyclones in this<br />
region usually form south of 10°S. The latitude of<br />
recurvature usually migrates from about 20°S in January to<br />
around 15°S in April. After crossing 30°S, these storms<br />
sometimes become intense extratropical lows.<br />
Southwest Pacific and Australian Area—These<br />
tropical waters spawn an annual average of 15 tropical<br />
cyclones 4, of which reach hurricane intensity. The season<br />
extends from about December through April, although<br />
storms can form in any month. Activity is widespread in<br />
January and February, and it is in these months that<br />
tropical cyclones are most likely to affect Fiji, Samoa, and<br />
the other eastern islands. Tropical cyclones usually form<br />
in the waters from 105°E to 160°W, between 5° and 20°S.<br />
Storms affecting northern and western Australia often<br />
develop in the Timor or Arafura Sea, while those that<br />
affect the east coast form in the Coral Sea. These storms<br />
are often small, but can develop winds in excess of 130<br />
knots. New Zealand is sometimes reached by decaying<br />
Coral Sea storms, and occasionally by an intense<br />
hurricane. In general, tropical cyclones in this region<br />
move southwestward and then recurve southeastward.<br />
conditions needed to generate hurricane circulation, and the<br />
relationships between large- and small-scale atmospheric<br />
processes. But scientists today, treating the hurricane system<br />
as an atmospheric heat engine, present a more<br />
comprehensive and convincing view.<br />
They begin with a starter mechanism in which either<br />
internal or external forces intensify the initial disturbance.<br />
The initial disturbance becomes a region into which lowlevel<br />
air from the surrounding area begins to flow,<br />
accelerating the convection already occurring inside the<br />
disturbance. The vertical circulation becomes increasingly<br />
well organized as water vapor in the ascending moist layer<br />
is condensed (releasing large amounts of heat energy to<br />
drive the wind system), and as the system is swept into a<br />
counterclockwise cyclonic spiral. But this incipient<br />
hurricane would soon fill up because of inflow at lower<br />
levels, unless the chimney in which converging air surges<br />
upward is provided the exhaust mechanism of high-altitude<br />
winds.
These high-altitude winds pump ascending air out of<br />
the cyclonic system, into a high-altitude anticyclone, which<br />
transports the air well away from the disturbance, before<br />
sinking occurs. See Figure <strong>35</strong>04. Thus, a large scale vertical<br />
circulation is set up, in which low-level air is spiraled up the<br />
cyclonic twisting of the disturbance, and, after a trajectory<br />
over the sea, returned to lower altitudes some distance from<br />
the storm. This pumping action-and the heat released by the<br />
ascending air may account for the sudden drop of<br />
atmospheric pressure at the surface, which produces the<br />
steep pressure gradient along which winds reach hurricane<br />
proportions.<br />
It is believed that the interaction of low-level and highaltitude<br />
wind systems determines the intensity the hurricane<br />
will attain. If less air is pumped out than converges at low<br />
levels, the system will fill and die out. If more is pumped out<br />
than flows in, the circulation will be sustained and will<br />
intensify.<br />
Scientists have found that any process which increases<br />
the rate of low-level inflow is favorable for hurricane<br />
development, provided the inflowing air carries sufficient<br />
heat and moisture to fuel the hurricane’s power system. It has<br />
also been shown that air above the developing disturbance, at<br />
altitudes between 20,000 and 40,000 feet, increases 1° to 3°F<br />
in temperature about 24 hours before the disturbance<br />
develops into a hurricane. But it is not known whether lowlevel<br />
inflow and high-level warming cause hurricanes. They<br />
could very well be measurable symptoms of another effect<br />
which actually triggers the storm’s increase to hurricane<br />
intensity.<br />
The view of hurricanes as atmospheric engines is<br />
necessarily a general one. The exact role of each contributor<br />
is not completely understood. The engine seems to be both<br />
inefficient and unreliable; a myriad of delicate conditions<br />
must be satisfied for the atmosphere to produce a hurricane.<br />
Their relative infrequency indicates that many potential<br />
hurricanes dissipate before developing into storms.<br />
<strong>TROPICAL</strong> <strong>CYCLONES</strong> 507<br />
Figure <strong>35</strong>04. Pumping action of high-altitude winds.<br />
<strong>35</strong>05. Portrait of a Hurricane<br />
In the early life of the hurricane, the spiral covers an<br />
area averaging 100 miles in diameter with winds of 64<br />
knots and greater, and spreads gale-force winds over a 400mile<br />
diameter. The cyclonic spiral is marked by heavy<br />
cloud bands from which torrential rains fall, separated by<br />
areas of light rain or no rain at all. These spiral bands<br />
ascend in decks of cumulus and cumulonimbus clouds to<br />
the convective limit of cloud formation, where condensing<br />
water vapor is swept off as ice-crystal wisps of cirrus<br />
clouds. See Figure <strong>35</strong>05. Thunderstorm electrical activity is<br />
observed in these bands, both as lightning and as tiny<br />
electrostatic discharges.<br />
In the lower few thousand feet, air flows in through the cyclone,<br />
and is drawn upward through ascending columns of air<br />
near the center. The size and intensity decrease with altitude,<br />
the cyclonic circulation being gradually replaced above 40,000<br />
feet by an anticyclonic circulation centered hundreds of miles<br />
away, which is the exhaust system of the hurricane heat engine.<br />
At lower levels, where the hurricane is more intense,<br />
winds on the rim of the storm follow a wide pattern, like the<br />
slower currents around the edge of a whirlpool; and, like<br />
those currents, these winds accelerate as they approach the<br />
center of the vortex. The outer band has light winds at the<br />
rim of the storm, perhaps no more than 25 knots; within 30<br />
miles of the center, winds may have velocities exceeding<br />
130 knots. The inner band is the region of maximum wind<br />
velocity, where the storm’s worst winds are felt, and where<br />
ascending air is chimneyed upward, releasing heat to drive<br />
the storm. In most hurricanes, these winds reach 85 knots,<br />
and more than 170 knots in severe storms.<br />
In the hurricane, winds flow toward the low pressure in<br />
the warm, comparatively calm core. There, converging air<br />
is whirled upward by convection, the mechanical thrusting<br />
of other converging air, and the pumping action of highaltitude<br />
circulations. This spiral is marked by the thick
508 <strong>TROPICAL</strong> <strong>CYCLONES</strong><br />
Figure <strong>35</strong>05. Cutaway view of a hurricane greatly exaggerated in vertical dimension. Actual hurricanes are less than<br />
50,000 feet high and may have a diameter of several hundred miles.<br />
cloud walls curling inward toward the storm center,<br />
releasing heavy precipitation and enormous quantities of<br />
heat energy. At the center, surrounded by a band in which<br />
this strong vertical circulation is greatest, is the eye of the<br />
hurricane.<br />
On the average, eye diameter is about 14 miles,<br />
although diameters of 25 miles are not unusual. From the<br />
heated tower of maximum winds and cumulonimbus<br />
clouds, winds diminish rapidly to something less than 15<br />
miles per hour in the eye; at the opposite wall, winds<br />
increase again, but come from the opposite direction<br />
because of the cyclonic circulation of the storm. This<br />
sudden transformation of storm into comparative calm, and<br />
from calm into violence from another quarter is spectacular.<br />
The eye’s abrupt existence in the midst of opaque rain<br />
squalls and hurricane winds, the intermittent bursts of blue<br />
sky and sunlight through light clouds in the core of the<br />
cyclone, and the galleried walls of cumulus and<br />
cumulonimbus clouds are unforgettable.<br />
Every hurricane is individual, and the more or less<br />
orderly circulation described here omits the extreme<br />
variability and instability within the storm system. Pressure<br />
and temperature gradients fluctuate wildly across the storm<br />
as the hurricane maintains its erratic life. If it is an August<br />
storm, its average life expectancy is 12 days; if a July or<br />
November storm, it lives an average of 8 days.<br />
<strong>35</strong>06. Life of a Tropical Cyclone<br />
Reports from ships in the vicinity of an easterly wave<br />
(a westward-moving trough of low pressure embedded in<br />
deep easterlies) may indicate that the atmospheric pres-<br />
sure in the region has fallen more than 5 hectopascals<br />
(hPa) in the past 24 hours. This is cause for alarm, because<br />
in the Tropics pressure varies little; the normal diurnal<br />
pressure change is only about 3 hPa. Satellite pictures may<br />
indicate thickening middle and high clouds. Squalls are<br />
reported ahead of the easterly wave, and wind reports indicate<br />
a cyclonic circulation is forming. The former<br />
easterly wave, now classified a tropical disturbance, is<br />
moving westward at 10 knots under the canopy of a large<br />
high-pressure system aloft. Sea surface temperatures in<br />
the vicinity are in the 28°-30°C range.<br />
Within 48 hours winds increase to 25 knots near the<br />
center of definite circulation, and central pressure has<br />
dropped below 1000 hPa. The disturbance is now classified<br />
as a tropical depression. Soon the circulation extends out to<br />
100 miles and upward to 20,000 feet. Winds near the center<br />
increase to gale force, central pressure falls below 990 hPa,<br />
and towering cumulonimbus clouds shield a developing<br />
eye; a tropical storm has developed.<br />
Satellite photographs now reveal a tightly organized<br />
tropical cyclone, and reconnaissance reports indicate maximum<br />
winds of 80 knots around a central pressure of 980<br />
hPa; a hurricane has developed. A ship to the right (left in<br />
the Southern Hemisphere) of the hurricane’s center (looking<br />
toward the direction of storm movement) reports 30foot<br />
seas. The hurricane is rapidly maturing as it continues<br />
westward.<br />
A few days later the hurricane reaches its peak. The<br />
satellite photographs show a textbook picture (Figure<br />
<strong>35</strong>06), as 120-knot winds roar around a 940-hPa pressure<br />
center; hurricane-force winds extend 50 miles in all<br />
directions, and seas are reported up to 40 feet. There is no
further deepening now, but the hurricane begins to expand.<br />
In 2 days, gales extend out to 200 miles, and hurricane<br />
winds out to 75 miles. Then the hurricane slows and begins<br />
to recurve; this turning marks the beginning of its final<br />
phase.<br />
The hurricane accelerates, and, upon reaching<br />
temperate latitudes, it begins to lose its tropical characteristics.<br />
The circulation continues to expand, but now cold air<br />
<strong>TROPICAL</strong> <strong>CYCLONES</strong> 509<br />
Figure <strong>35</strong>06. Satellite photograph of a hurricane.<br />
is intruding. (Cold air, cold water, dry air aloft, and land aid<br />
in the decay of a tropical cyclone.) The winds gradually<br />
abate as the concentrated storm disintegrates. The warm<br />
core survives for a few more days before the transformation<br />
to a large extratropical low-pressure system is complete.<br />
Not all tropical cyclones follow this average pattern.<br />
Most falter in the early stages, some dissipate over land, and<br />
others remain potent for several weeks.
510 <strong>TROPICAL</strong> <strong>CYCLONES</strong><br />
FORECASTING AND PREDICTING <strong>TROPICAL</strong> <strong>CYCLONES</strong><br />
<strong>35</strong>07. Weather Broadcasts and Radiofacsimile<br />
The marine weather broadcast and radiofacsimile<br />
weather maps are the most important tools for avoiding<br />
tropical cyclones. These broadcasts, covering all tropical<br />
areas, provide information about the tropical cyclone’s<br />
location, maximum winds and seas, and future conditions<br />
expected.<br />
The U S. Navy, the National Oceanic and Atmospheric<br />
Administration, and the U.S. Air Force have developed a<br />
highly effective surveillance system for the tropical<br />
cyclone-prone areas of the world. Routine and special<br />
weather reports enable accurate detection, location, and<br />
tracking of tropical cyclones. International cooperation is<br />
effective. These reports originate from land stations, ships<br />
at sea, aircraft, weather satellite imagery, and specially<br />
instrumented weather reconnaissance aircraft of National<br />
Oceanic and Atmospheric Administration and the U.S. Air<br />
Force. Data buoys, both moored and drifting, provide<br />
another source of information.<br />
The tropical warning services have three principal<br />
functions:<br />
1. Collection and analysis of data<br />
2. Preparation of timely and accurate warnings<br />
3. The distribution of advisories<br />
To provide timely and accurate information and<br />
warnings regarding tropical cyclones, the oceans have<br />
been divided into overlapping geographical areas of<br />
responsibility.<br />
For detailed information on the areas of responsibility of<br />
the countries participating in the international forecasting<br />
and warning program, and radio aids, refer to Selected<br />
Worldwide Marine Weather Broadcasts, published jointly by<br />
the Naval Meteorology and Oceanography Command and<br />
the National Weather Service.<br />
Although the areas of forecasting responsibility are<br />
fairly well defined for the Department of Defense, the international<br />
and domestic civilian system provides many<br />
overlaps and is dependent upon qualitative factors. For example,<br />
when a tropical storm or hurricane is traveling<br />
westward and crosses <strong>35</strong>°W longitude, the continued issuance<br />
of forecasts and warnings to the general public,<br />
shipping interests, etc., becomes the responsibility of the<br />
National Hurricane Center of the National Weather Service<br />
at Miami, Florida. When a tropical storm or hurricane<br />
crosses <strong>35</strong>°W longitude traveling from west to east, the National<br />
Hurricane Center ceases to issue formal public<br />
advisories, but will issue marine bulletins on any dangerous<br />
tropical cyclone in the North Atlantic, if it is of importance<br />
or constitutes a threat to shipping and other interests. These<br />
advisories are included in National Weather Service Marine<br />
Bulletins broadcast to ships over radio station NAM Nor-<br />
folk, Virginia. Special advisories may be issued at any time.<br />
In the Atlantic Ocean, Department of Defense responsibility<br />
rests with the Naval Atlantic Meteorology and<br />
Oceanography Center in Norfolk, Virginia.<br />
In the eastern Pacific east of longitude 140°W, responsibility<br />
for the issuance of tropical storm and hurricane<br />
advisories and warnings for the general public, merchant<br />
shipping, and other interests rests with the National Weather<br />
Service Eastern Pacific Hurricane Center, San Francisco,<br />
California. The Department of Defense responsibility rests<br />
with the Naval Pacific Meteorology and Oceanography<br />
Center, Pearl Harbor, Hawaii. Formal advisories and warnings<br />
are issued daily and are included in the marine<br />
bulletins broadcast by radio stations KFS, NMC, and NMQ.<br />
In the central Pacific (between the meridian and longitude<br />
140°W), the civilian responsibility rests with the<br />
National Weather Service Central Pacific Hurricane Center,<br />
Honolulu, Hawaii. Department of Defense<br />
responsibility rests with the Naval Pacific Meteorology and<br />
Oceanography Center in Pearl Harbor. Formal tropical<br />
storm and hurricane advisories and warnings are issued daily<br />
and are included in the marine bulletins broadcast by<br />
radio station NMO and NRV.<br />
Tropical cyclone messages contain position of the<br />
storm, intensity, direction and speed of movement, and a<br />
description of the area of strong winds. Included is a forecast<br />
of future movement and intensity. When the storm is<br />
likely to affect any land area, details on when and where it<br />
will be felt, and data on tides, rain, floods, and maximum<br />
winds are also included. Figure <strong>35</strong>07 provides an example<br />
of a marine advisory issued by the National Hurricane<br />
Center.<br />
The Naval Pacific Meteorology and Oceanography<br />
Center Center-West/Joint Typhoon Warning Center (NP-<br />
MOC-W/JTWC) in Guam is responsible for all U.S.<br />
tropical storm and typhoon advisories and warnings from<br />
the 180th meridian westward to the mainland of Asia. A<br />
secondary area of responsibility extends westward to longitude<br />
90°E. Whenever a tropical cyclone is observed in<br />
the western North Pacific area, serially numbered warnings,<br />
bearing an “immediate” precedence are broadcast<br />
from the NPMOC-W/JTWC at 0000, 0600, 1200, and<br />
1800 GMT.<br />
The responsibility for issuing gale and storm warnings<br />
for the Indian Ocean, Arabian Sea, Bay of Bengal, Western<br />
Pacific, and South Pacific rests with many countries. In<br />
general, warnings of approaching tropical cyclones will include<br />
the following information: storm type, central<br />
pressure given in hPa, wind speed observed within the<br />
storm, storm location, speed and direction of movement,<br />
the extent of the affected area, visibility, and the state of the<br />
sea, as well as any other pertinent information received. All<br />
storm warning messages commence with the international<br />
call sign “TTT.”
These warnings are broadcast on specified radio frequency<br />
bands immediately upon receipt of the information<br />
and at specific intervals thereafter. Generally, the broadcast<br />
interval is every 6 to 8 hours, depending upon receipt of<br />
<strong>TROPICAL</strong> <strong>CYCLONES</strong> 511<br />
NOAA/NATIONAL HURRICANE CENTER MARINE ADVISORY NUM-<br />
BER 13 HURRICANE LADY 0400Z SEPTEMBER 21 20--.<br />
HURRICANE WARNINGS ARE DISPLAYED FROM KEY LARGO TO<br />
CAPE KENNEDY. GALE WARNINGS ARE DISPLAYED FROM KEY<br />
WEST TO JACKSONVILLE AND FROM FLORIDA BAY TO CEDAR KEY.<br />
HURRICANE CENTER LOCATED NEAR LATITUDE 25.5 NORTH<br />
LONGITUDE 78.5 WEST AT 21/0400Z. POSITION EXCELLENT AC-<br />
CURATE WITHIN 10 MILES BASED ON AIR FORCE RECONNAISSANCE<br />
AND SYNOPTIC REPORTS.<br />
PRESENT MOVEMENT TOWARD THE WEST NORTHWEST OR 285<br />
DEGREES AT 10 KT. MAX SUSTAINED WINDS OF 100 KT NEAR<br />
CENTER WITH GUSTS TO 160 KT.<br />
MAX WINDS OVER INLAND AREAS <strong>35</strong> KT.<br />
RAD OF 65 KT WINDS 90 NE 60 SE 80 SW 90 NW QUAD.<br />
RAD OF 50 KT WINDS 120 NE 70 SE 90 SW 120 NW QUAD.<br />
RAD OF 30 KT WINDS 210 NE 210 SE 210 SW 210 NW QUAD.<br />
REPEAT CENTER LOCATED 25.5N 78.3W AT 21/0400Z.<br />
12 HOUR FORECAST VALID 21/1600Z LATITUDE 26.0N LONGI-<br />
TUDE 80.5W.<br />
MAX WINDS OF 100 KT NEAR CENTER WITH GUSTS TO 160 KT.<br />
MAX WINDS OVER INLAND AREAS 65 KT.<br />
RADIUS OF 50 KT WINDS 120 NE 70 SE 90 SW 120 NW QUAD.<br />
24 HOUR FORECAST VALID 22/0400Z LATITUDE 26.0N<br />
LONGITUDE 83.0W.<br />
MAX WINDS OF 75 KT NEAR CENTER WITH GUSTS TO 120 KT.<br />
MAX WINDS OVER INLAND AREAS 45 KT.<br />
RADIUS OF 50 KT WINDS 120 NE 120 SE 120 SW 120 NW QUAD.<br />
STORM TIDE OF 9 TO 12 FT SOUTHEAST FLA COAST GREATER<br />
MIAMI AREA TO THE PALM BEACHES.<br />
NEXT ADVISORY AT 21/1000Z.<br />
Figure <strong>35</strong>07. Example of marine advisory issued by the National Hurricane Center.<br />
<strong>35</strong>08. Approach and Passage of a Tropical Cyclone<br />
An early indication of the approach of a tropical<br />
cyclone is the presence of a long swell. In the absence of a<br />
tropical cyclone, the crests of swell in the deep waters of the<br />
Atlantic pass at the rate of perhaps eight per minute. Swell<br />
generated by a hurricane is about twice as long, the crests<br />
passing at the rate of perhaps four per minute. Swell may be<br />
observed several days before arrival of the storm.<br />
When the storm center is 500 to 1,000 miles away, the<br />
barometer usually rises a little, and the skies are relatively<br />
clear. Cumulus clouds, if present at all, are few in number<br />
and their vertical development appears suppressed. The<br />
AVOIDING <strong>TROPICAL</strong> <strong>CYCLONES</strong><br />
new information.<br />
Bulletins and forecasts are excellent guides to the<br />
present and future behavior of the tropical cyclone, and a<br />
plot should be kept of all positions.<br />
barometer usually appears restless, pumping up and down a<br />
few hundredths of an inch.<br />
As the tropical cyclone comes nearer, a cloud sequence<br />
begins which resembles that associated with the approach<br />
of a warm front in middle latitudes. Snow-white, fibrous<br />
“mare’s tails” (cirrus) appear when the storm is about 300<br />
to 600 miles away. Usually these seem to converge, more<br />
or less, in the direction from which the storm is approaching.<br />
This convergence is particularly apparent at about the<br />
time of sunrise and sunset.<br />
Shortly after the cirrus appears, but sometimes before,<br />
the barometer starts a long, slow fall. At first the fall is so<br />
gradual that it only appears to alter somewhat the normal
512 <strong>TROPICAL</strong> <strong>CYCLONES</strong><br />
daily cycle (two maxima and two minima in the Tropics).<br />
As the rate of fall increases, the daily pattern is completely<br />
lost in the more or less steady fall.<br />
The cirrus becomes more confused and tangled, and<br />
then gradually gives way to a continuous veil of cirrostratus.<br />
Below this veil, altostratus forms, and then stratocumulus.<br />
These clouds gradually become more dense, and as they do<br />
so, the weather becomes unsettled. A fine, mist-like rain begins<br />
to fall, interrupted from time to time by rain showers.<br />
The barometer has fallen perhaps a tenth of an inch.<br />
As the fall becomes more rapid, the wind increases in<br />
gustiness, and its speed becomes greater, reaching perhaps<br />
22 to 40 knots (Beaufort 6-8). On the horizon appears a dark<br />
wall of heavy cumulonimbus, called the bar of the storm.<br />
This is the heavy bank of clouds comprising the main mass<br />
of the cyclone. Portions of this heavy cloud become<br />
detached from time to time, and drift across the sky,<br />
accompanied by rain squalls and wind of increasing speed.<br />
Between squalls, the cirrostratus can be seen through<br />
breaks in the stratocumulus.<br />
As the bar approaches, the barometer falls more rapidly<br />
and wind speed increases. The seas, which have been<br />
gradually mounting, become tempestuous. Squall lines, one<br />
after the other, sweep past in ever increasing number and<br />
intensity.<br />
With the arrival of the bar, the day becomes very dark,<br />
squalls become virtually continuous, and the barometer<br />
falls precipitously, with a rapid increase in wind speed. The<br />
center may still be 100 to 200 miles away in a fully<br />
developed tropical cyclone. As the center of the storm<br />
comes closer, the ever-stronger wind shrieks through the<br />
rigging, and about the superstructure of the vessel. As the<br />
center approaches, rain falls in torrents. The wind fury<br />
Figure <strong>35</strong>08. Typical hurricane cloud formations.<br />
increases. The seas become mountainous. The tops of huge<br />
waves are blown off to mingle with the rain and fill the air<br />
with water. Visibility is virtually zero in blinding rain and<br />
spray. Even the largest and most seaworthy vessels become<br />
virtually unmanageable, and may sustain heavy damage.<br />
Less sturdy vessels may not survive. Navigation virtually<br />
stops as safety of the vessel becomes the only consideration.<br />
The awesome fury of this condition can only be<br />
experienced. Words are inadequate to describe it.<br />
If the eye of the storm passes over the vessel, the winds<br />
suddenly drop to a breeze as the wall of the eye passes. The<br />
rain stops, and the skies clear sufficiently to permit the Sun<br />
or stars to shine through holes in the comparatively thin<br />
cloud cover. Visibility improves. Mountainous seas<br />
approach from all sides in complete confusion. The<br />
barometer reaches its lowest point, which may be 1 1 / 2 or 2<br />
inches below normal in fully developed tropical cyclones.<br />
As the wall on the opposite side of the eye arrives, the full<br />
fury of the wind strikes as suddenly as it ceased, but from<br />
the opposite direction. The sequence of conditions that<br />
occurred during approach of the storm is reversed, and<br />
passes more quickly, as the various parts of the storm are<br />
not as wide in the rear of a storm as on its forward side.<br />
Typical cloud formations associated with a hurricane<br />
are shown in Figure <strong>35</strong>08.<br />
<strong>35</strong>09. Locating the Center of a Tropical Cyclone<br />
If intelligent action is to be taken to avoid the full fury<br />
of a tropical cyclone, early determination of its location and<br />
direction of travel relative to the vessel is essential. The bulletins<br />
and forecasts are an excellent general guide, but they<br />
are not infallible, and may be sufficiently in error to induce
a mariner in a critical position to alter course so as to unwittingly<br />
increase the danger to his vessel. Often it is possible,<br />
using only those observations made aboard ship, to obtain a<br />
sufficiently close approximation to enable the vessel to maneuver<br />
to the best advantage.<br />
The presence of an exceptionally long swell is usually<br />
the first visible indication of the existence of a tropical<br />
cyclone. In deep water it approaches from the general<br />
direction of origin (the position of the storm center when<br />
the swell was generated). However, in shoaling water this<br />
is a less reliable indication because the direction is changed<br />
by refraction, the crests being more nearly parallel to the<br />
bottom contours.<br />
When the cirrus clouds appear, their point of<br />
convergence provides an indication of the direction of the<br />
storm center. If the storm is to pass well to one side of the<br />
observer, the point of convergence shifts slowly in the<br />
direction of storm movement. If the storm center will pass<br />
near the observer, this point remains steady. When the bar<br />
becomes visible, it appears to rest upon the horizon for<br />
several hours. The darkest part of this cloud is in the<br />
<strong>TROPICAL</strong> <strong>CYCLONES</strong> 513<br />
Figure <strong>35</strong>09a. Approximate relationship of wind to isobars and storm center in the Northern Hemisphere.<br />
direction of the storm center. If the storm is to pass to one<br />
side, the bar appears to drift slowly along the horizon. If the<br />
storm is heading directly toward the observer, the position<br />
of the bar remains fixed. Once within the area of the dense,<br />
low clouds, one should observe their direction of<br />
movement, which is almost exactly along the isobars, with<br />
the center of the storm being 90° from the direction of cloud<br />
movement (left of direction of movement in the Northern<br />
Hemisphere, and right in the Southern Hemisphere).<br />
The winds are probably the best guide to the direction of the<br />
center of a tropical cyclone. The circulation is cyclonic, but<br />
because of the steep pressure gradient near the center, the<br />
winds there blow with greater violence and are more nearly<br />
circular than in extratropical cyclones.<br />
According to Buys Ballot’s law, an observer whose<br />
back is to the wind has the low pressure on his left in the<br />
Northern Hemisphere, and on his right in the Southern Hemisphere.<br />
If the wind followed circular isobars exactly, the<br />
center would be exactly 90° from behind when facing away<br />
from the wind. However, the track of the wind is usually inclined<br />
somewhat toward the center, so that the angle from
514 <strong>TROPICAL</strong> <strong>CYCLONES</strong><br />
Figure <strong>35</strong>09b. Radar PPI presentation of a tropical<br />
cyclone.<br />
dead astern varies between perhaps 90° to 1<strong>35</strong>°. The inclination<br />
varies in different parts of the same storm. It is least in<br />
front of the storm, and greatest in the rear, since the actual<br />
wind is the vector sum of the pressure gradient and the motion<br />
of the storm along the track. A good average is perhaps<br />
110° in front, and 120-1<strong>35</strong>° in the rear. These values apply<br />
when the storm center is still several hundred miles away.<br />
Closer to the center, the wind blows more nearly along the<br />
isobars, the inclination being reduced by one or two points at<br />
the wall of the eye. Since wind direction usually shifts temporarily<br />
during a squall, its direction at this time should not<br />
be used for determining the position of the center. The approximate<br />
relationship of wind to isobars and storm center in<br />
the Northern Hemisphere is shown in Figure <strong>35</strong>09a.<br />
When the center is within radar range, it will probably<br />
be visible on the scope. However, since the radar return is<br />
predominantly from the rain, results can be deceptive, and<br />
other indications should not be neglected. Figure <strong>35</strong>09b<br />
shows a radar PPI presentation of a tropical cyclone. If the<br />
eye is out of range, the spiral bands (Figure <strong>35</strong>09b) may indicate<br />
its direction from the vessel. Tracking the eye or<br />
upwind portion of the spiral bands enables determining the<br />
direction and speed of movement; this should be done for at<br />
least 1 hour because the eye tends to oscillate. The tracking<br />
of individual cells, which tend to move tangentially around<br />
the eye, for 15 minutes or more, either at the end of the band<br />
or between bands, will provide an indication of the wind<br />
speed in that area of the storm.<br />
Distance from the storm center is more difficult to<br />
determine than direction. Radar is perhaps the best guide.<br />
However, the rate of fall of the barometer is some<br />
indication.<br />
<strong>35</strong>10. Statistical Analysis of Barometric Pressure<br />
The lowest-sea-level pressure ever recorded was 877<br />
hPa in typhoon Ida, on September 24, 1958. The<br />
observation was taken by a reconnaissance aircraft<br />
dropsonde, some 750 miles east of Luzon, Philippines. This<br />
observation was obtained again in typhoon Nora on<br />
October 6, 1973. The lowest barometric reading of record<br />
for the United States is 892.3 hPa, obtained during a<br />
hurricane at Lower Matecumbe Key, Florida, in September<br />
19<strong>35</strong>. In hurricane Camille in 1969, a 905 hPa pressure was<br />
measured by reconnaissance aircraft. During a 1927<br />
typhoon, the S.S. Sapoeroea recorded a pressure of 886.6<br />
hPa, the lowest sea-level pressure reported from a ship.<br />
Pressure has been observed to drop more than 33 hPa per<br />
hour, with a pressure gradient amounting to a change of 3.7<br />
hPa per mile.<br />
A method for alerting the mariner to possible tropical<br />
cyclone formation involves a statistical comparison of<br />
observed weather parameters with the climatology (30 year<br />
averaged conditions) for those parameters. Significant<br />
fluctuations away from these average conditions could<br />
mean the onset of severe weather. One such statistical<br />
method involves a comparison of mean surface pressure in<br />
the tropics with the standard deviation (s.d.) of surface<br />
pressure. Any significant deviation from the norm could<br />
indicate proximity to a tropical cyclone. Analysis shows<br />
that surface pressure can be expected to be lower than the<br />
mean minus 1 s.d. less than 16% of the time, lower than the<br />
mean minus 1.5 s.d. less than 7% of the time, and lower<br />
than the mean minus 2 s.d. less than 3% of the time.<br />
Comparison of the observed pressure with the mean will<br />
indicate how unusual the present conditions are.<br />
As an example, assume the mean surface pressure in<br />
the South China Sea to be about 1005 mb during August<br />
with a s.d. of about 2 mb. Therefore, surface pressure can<br />
be expected to fall below 1003 mb about 16% of the time<br />
and below 1000 mb about 7% of the time. Ambient pressure<br />
any lower than that would alert the mariner to the possible<br />
onset of heavy weather. Charts showing the mean surface<br />
pressure and the s.d. of surface pressure for various global<br />
regions can be found in the U.S. Navy Marine Climatic<br />
Atlas of the World.<br />
<strong>35</strong>11. Maneuvering to Avoid the Storm Center<br />
The safest procedure with respect to tropical cyclones<br />
is to avoid them. If action is taken sufficiently early, this is<br />
simply a matter of setting a course that will take the vessel<br />
well to one side of the probable track of the storm, and then<br />
continuing to plot the positions of the storm center as given<br />
in the weather bulletins, revising the course as needed.<br />
However, this is not always possible. If the ship is<br />
found to be within the storm area, the proper action to take<br />
depends in part upon its position relative to the storm center<br />
and its direction of travel. It is customary to divide the<br />
circular area of the storm into two parts.<br />
In the Northern Hemisphere, that part to the right of the<br />
storm track (facing in the direction toward which the storm<br />
is moving) is called the dangerous semicircle. It is<br />
considered dangerous because (1) the actual wind speed is
greater than that due to the pressure gradient alone, since it<br />
is augmented by the forward motion of the storm, and (2)<br />
the direction of the wind and sea is such as to carry a vessel<br />
into the path of the storm (in the forward part of the<br />
semicircle).<br />
The part to the left of the storm track is called the less<br />
dangerous semicircle, ornavigable semicircle. In this<br />
part, the wind is decreased by the forward motion of the<br />
storm, and the wind blows vessels away from the storm<br />
track (in the forward part). Because of the greater wind<br />
speed in the dangerous semicircle, the seas are higher than<br />
in the less dangerous semicircle. In the Southern<br />
Hemisphere, the dangerous semicircle is to the left of the<br />
storm track, and the less dangerous semicircle is to the right<br />
of the storm track.<br />
A plot of successive positions of the storm center should<br />
indicate the semicircle in which a vessel is located. However,<br />
if this is based upon weather bulletins, it may not be a reliable<br />
guide because of the lag between the observations upon<br />
which the bulletin is based and the time of reception of the<br />
bulletin, with the ever-present possibility of a change in the<br />
direction of the storm. The use of radar eliminates this lag at<br />
short range, but the return may not be a true indication of the<br />
center. Perhaps the most reliable guide is the wind. Within<br />
the cyclonic circulation, a wind shifting to the right in the<br />
northern hemisphere and to the left in the southern<br />
hemisphere indicates the vessel is probably in the dangerous<br />
semicircle. A steady wind shift opposite to this indicates the<br />
vessel is probably in the less dangerous semicircle.<br />
However, if a vessel is underway, its own motion<br />
should be considered. If it is outrunning the storm or pulling<br />
rapidly toward one side (which is not difficult during the<br />
early stages of a storm, when its speed is low), the opposite<br />
effect occurs. This should usually be accompanied by a rise<br />
in atmospheric pressure, but if motion of the vessel is nearly<br />
along an isobar, this may not be a reliable indication. If in<br />
doubt, the safest action is usually to stop long enough to<br />
define the proper semicircle. The loss in time may be more<br />
than offset by the minimizing of the possibility of taking the<br />
wrong action, increasing the danger to the vessel. If the<br />
wind direction remains steady (for a vessel which is<br />
stopped), with increasing speed and falling barometer, the<br />
vessel is in or near the path of the storm. If it remains steady<br />
with decreasing speed and rising barometer, the vessel is<br />
near the storm track, behind the center.<br />
The first action to take if the ship is within the cyclonic<br />
circulation is to determine the position of his vessel with<br />
respect to the storm center. While the vessel can still make<br />
considerable way through the water, a course should be<br />
selected to take it as far as possible from the center. If the<br />
vessel can move faster than the storm, it is a relatively<br />
simple matter to outrun the storm if sea room permits. But<br />
when the storm is faster, the solution is not as simple. In this<br />
case, the vessel, if ahead of the storm, will approach nearer<br />
to the center. The problem is to select a course that will<br />
produce the greatest possible minimum distance. This is<br />
<strong>TROPICAL</strong> <strong>CYCLONES</strong> 515<br />
best determined by means of a relative movement plot, as<br />
shown in the following example solved on a maneuvering<br />
board.<br />
Example: A tropical cyclone is estimated to be moving<br />
in direction 320° at 19 knots. Its center bears 170°, atan<br />
estimated distance of 200 miles from a vessel which has a<br />
maximum speed of 12 knots.<br />
Required:<br />
(1) The course to steer at 12 knots to produce the<br />
greatest possible minimum distance between the<br />
vessel and the storm center.<br />
(2) The distance to the center at nearest approach.<br />
(3) Elapsed time until nearest approach.<br />
Solution: (Figure <strong>35</strong>11) Consider the vessel remaining<br />
at the center of the plot throughout the solution, as<br />
on a radar PPI.<br />
(1) To locate the position of the storm center relative to<br />
the vessel, plot point C at a distance of 200 miles (scale 20:1)<br />
in direction 170° from the center of the diagram. From the<br />
center of the diagram, draw RA, the speed vector of the storm<br />
center, in direction 320°, speed 19 knots (scale 2:1). From A<br />
draw a line tangent to the 12-knot speed circle (labeled 6 at<br />
scale 2:1) on the side opposite the storm center. From the<br />
center of the diagram, draw a perpendicular to this tangent<br />
line, locating point B. The line RB is the required speed vector<br />
for the vessel. Its direction, 011°, is the required course.<br />
(2) The path of the storm center relative to the vessel will<br />
be along a line from C in the direction BA, if both storm and<br />
vessel maintain course and speed. The point of nearest<br />
approach will be at D, the foot of a perpendicular from the<br />
center of the diagram. This distance, at scale 20:1, is 187<br />
miles.<br />
(3) The length of the vector BA (14.8 knots) is the speed<br />
of the storm with respect to the vessel. Mark this on the<br />
lowest scale of the nomogram at the bottom of the diagram.<br />
The relative distance CD is 72 miles, by measurement. Mark<br />
this (scale 10:1) on the middle scale at the bottom of the<br />
diagram. Draw a line between the two points and extend it to<br />
intersect the top scale at 29.2 (292 at 10:1 scale). The<br />
elapsed time is therefore 292 minutes, or 4 hours 52 minutes.<br />
Answers: (1) C 011°, (2) D 187 mi., (3) 4 h 52 m.<br />
The storm center will be dead astern at its nearest<br />
approach.<br />
As a general rule, for a vessel in the Northern<br />
Hemisphere, safety lies in placing the wind on the starboard<br />
bow in the dangerous semicircle and on the starboard<br />
quarter in the less dangerous semicircle. If on the storm<br />
track ahead of the storm, the wind should be put about 160°<br />
on the starboard quarter until the vessel is well within the<br />
less dangerous semicircle, and the rule for that semicircle<br />
then followed. In the Southern Hemisphere the same rules
516 <strong>TROPICAL</strong> <strong>CYCLONES</strong><br />
Figure <strong>35</strong>11. Determining the course to avoid the storm center.<br />
hold, but with respect to the port side. With a faster than<br />
average vessel, the wind can be brought a little farther aft in<br />
each case. However, as the speed of the storm increases<br />
along its track, the wind should be brought farther forward.<br />
If land interferes with what would otherwise be the best<br />
maneuver, the solution should be altered to fit the<br />
circumstances.<br />
If the vessel is faster than the storm, it is possible to<br />
overtake it. In this case, the only action usually needed is to<br />
slow enough to let the storm pull ahead.<br />
In all cases, one should be alert to changes in the<br />
direction of movement of the storm center, particularly in<br />
the area where the track normally curves toward the pole. If<br />
the storm maintains its direction and speed, the ship’s<br />
course should be maintained as the wind shifts.<br />
If it becomes necessary for a vessel to heave to, the<br />
characteristics of the vessel should be considered. A power<br />
vessel is concerned primarily with damage by direct action<br />
of the sea. A good general rule is to heave to with head to<br />
the sea in the dangerous semicircle, or stern to the sea in the<br />
less dangerous semicircle. This will result in greatest<br />
amount of headway away from the storm center, and least<br />
amount of leeway toward it. If a vessel handles better with<br />
the sea astern or on the quarter, it may be placed in this<br />
position in the less dangerous semicircle or in the rear half<br />
of the dangerous semicircle, but never in the forward half of<br />
the dangerous semicircle. It has been reported that when the<br />
wind reaches hurricane speed and the seas become<br />
confused, some ships ride out the storm best if the engines<br />
are stopped, and the vessel is left to seek its own position,<br />
or lie ahull. In this way, it is said, the ship rides with the<br />
storm instead of fighting against it.<br />
In a sailing vessel attempting to avoid a storm<br />
center, one should steer courses as near as possible to<br />
those prescribed above for power vessels. However, if it<br />
becomes necessary for such a vessel to heave to, the<br />
wind is of greater concern than the sea. A good general<br />
rule always is to heave to on whichever tack permits the<br />
shifting wind to draw aft. In the Northern Hemisphere,<br />
this is the starboard tack in the dangerous semicircle, and
the port tack in the less dangerous semicircle. In the<br />
Southern Hemisphere these are reversed.<br />
While each storm requires its own analysis, and<br />
frequent or continual resurvey of the situation, the general<br />
rules for a steamer may be summarized as follows:<br />
Northern Hemisphere<br />
Right or dangerous semicircle: Bring the wind on the<br />
starboard bow (045˚ relative), hold course and<br />
make as much way as possible. If necessary, heave<br />
to with head to the sea.<br />
Left or less dangerous semicircle: Bring the wind on<br />
the starboard quarter (1<strong>35</strong>° relative), hold course<br />
and make as much way as possible. If necessary,<br />
heave to with stern to the sea.<br />
On storm track, ahead of center: Bring the wind 2<br />
points on the starboard quarter (about 160°<br />
relative), hold course and make as much way as<br />
possible. When well within the less dangerous<br />
semicircle, maneuver as indicated above.<br />
On storm track, behind center: Avoid the center by<br />
the best practicable course, keeping in mind the<br />
tendency of tropical cyclones to curve northward<br />
and eastward.<br />
Southern Hemisphere<br />
Left or dangerous semicircle: Bring the wind on the<br />
port bow (315° relative), hold course and make as<br />
<strong>35</strong>12. High Winds and Flooding<br />
<strong>TROPICAL</strong> <strong>CYCLONES</strong> 517<br />
much way as possible. If necessary, heave to with<br />
head to the sea.<br />
Right or less dangerous semicircle: Bring the wind<br />
on the port quarter (225° relative), hold course and<br />
make as much way as possible. If necessary, heave<br />
to with stern to the sea.<br />
On storm track, ahead of center: Bring the wind<br />
about 200° relative, hold course and make as much<br />
way as possible. When well within the less<br />
dangerous semicircle, maneuver as indicated<br />
above.<br />
On storm track, behind center: Avoid the center by the<br />
best practicable course, keeping in mind the tendency<br />
of tropical cyclones to curve southward and eastward.<br />
It is possible, particularly in temperate latitudes after<br />
the storm has recurved, that the dangerous semicircle is the<br />
left one in the Northern Hemisphere (right one in the<br />
Southern Hemisphere). This can occur if a large high lies<br />
north of the storm and causes a tightening of the pressure<br />
gradient in the region.<br />
The Typhoon Havens Handbook for the Western<br />
Pacific and Indian Oceans is published by the Naval<br />
Oceanographic and Atmospheric Research Lab<br />
(NOARL) Monterey, California, as an aid to captains<br />
and commanding officers of ships in evaluating a<br />
typhoon situation, and to assist them in deciding whether<br />
to sortie, to evade, to remain in port, or to head for the<br />
shelter of a specific harbor.<br />
CONSEQUENCES OF <strong>TROPICAL</strong> <strong>CYCLONES</strong><br />
The high winds of a tropical cyclone inflict widespread<br />
damage when such a storm leaves the ocean and crosses<br />
land. Aids to navigation may be blown out of position or<br />
destroyed. Craft in harbors, often lifted by the storm surge,<br />
break moorings or drag anchor and are blown ashore and<br />
against obstructions. Ashore, trees are blown over, houses<br />
are damaged, power lines are blown down, etc. The greatest<br />
damage usually occurs in the dangerous semicircle a short<br />
distance from the center, where the strongest winds occur.<br />
As the storm continues on across land, its fury subsides<br />
faster than it would if it had remained over water.<br />
Wind instruments are usually incapable of measuring<br />
the 175 to 200 knot winds of the more intense hurricanes.<br />
Even if the instrument holds up, often the supporting<br />
structure is destroyed. Doppler radar may be effective in<br />
determining wind speeds, but may also be blown away.<br />
Wind gusts, which are usually 30 to 50 percent higher<br />
than sustained winds, add significantly to the destructiveness<br />
of the tropical cyclone. Many tropical cyclones<br />
that reach hurricane intensity develop winds of more than<br />
90 knots sometime during their lives, but few develop<br />
winds of more than 130 knots.<br />
Tropical cyclones have produced some of the world’s<br />
heaviest rainfalls. While average amounts range from 6 to<br />
10 inches, totals near 100 inches over a 4-day period have<br />
been observed. A 24-hour world’s record of 73.62 inches<br />
fell at Reunion Island during a tropical cyclone in 1952.<br />
Forward movement of the storm and land topography have<br />
a considerable influence on rainfall totals. Torrential rains<br />
can occur when a storm moves against a mountain range;<br />
this is common in the Philippines and Japan, where even<br />
weak tropical depressions produce considerable rainfall. A<br />
24-hour total of 46 inches was recorded in the Philippines<br />
during a typhoon in 1911. As hurricane Camille crossed<br />
southern Virginia’s Blue Ridge Mountains in August of<br />
1969, there was nearly 30 inches of rain in about 8 hours.<br />
This caused some of the most disastrous floods in the state’s<br />
history.<br />
Flooding is an extremely destructive by-product of the<br />
tropical cyclone’s torrential rains. Whether an area will be<br />
flooded depends on the physical characteristics of the<br />
drainage basin, rate and accumulation of precipitation, and<br />
river stages at the time the rains begin. When heavy rains<br />
fall over flat terrain, the countryside may lie under water for
518 <strong>TROPICAL</strong> <strong>CYCLONES</strong><br />
a month or so, and while buildings, furnishings, and<br />
underground power lines may be damaged, there are<br />
usually few fatalities. In mountainous or hill country,<br />
disastrous floods develop rapidly and can cause a great loss<br />
of life.<br />
There have been occasional reports in tropical cyclones of<br />
waves greater than 40 feet in height, and numerous reports in<br />
the 30- to 40-foot category. However, in tropical cyclones,<br />
strong winds rarely persist for a sufficiently long time or over<br />
a large enough area to permit enormous wave heights to<br />
develop. The direction and speed of the wind changes more<br />
rapidly in tropical cyclones than in extratropical storms. Thus,<br />
the maximum duration and fetch for any wind condition is<br />
often less in tropical cyclones than in extratropical storms, and<br />
the waves accompanying any given local wind conditions are<br />
generally not so high as those expected, with similar local<br />
wind conditions, in the high-latitude storms. In hurricane<br />
Camille, significant waves of 43 feet were recorded; an<br />
extreme wave height reached 72 feet.<br />
Exceptional conditions may arise when waves of<br />
certain dimensions travel within the storm at a speed equal<br />
to the storm’s speed, thus, in effect, extending the duration<br />
and fetch of the wave and significantly increasing its<br />
height. This occurs most often to the right of the track in the<br />
Northern Hemisphere (left of the track in the Southern<br />
Hemisphere). Another condition that may give rise to<br />
exceptional wave heights is the intersection of waves from<br />
two or more distinct directions. This may lead to a zone of<br />
confused seas in which the heights of some waves will<br />
equal the sums of each individual wave train. This process<br />
can occur in any quadrant of the storm, so it should not be<br />
assumed that the highest waves will always be encountered<br />
to the right of the storm track in the Northern Hemisphere<br />
(left of the track in the Southern Hemisphere).<br />
When these waves move beyond the influence of the<br />
generating winds, they become known as swell. They are<br />
recognized by their smooth, undulating form, in contrast to<br />
the steep, ragged crests of wind waves. This swell, particularly<br />
that generated by the right side of the storm, can<br />
travel a thousand miles or more and may produce tides 3 or<br />
4 feet above normal along several hundred miles of<br />
coastline. It may also produce tremendous surf over<br />
offshore reefs which normally are calm.<br />
When a tropical cyclone moves close to a coast, wind<br />
often causes a rapid rise in water level, and along with the<br />
falling pressure may produce a storm surge. This surge is<br />
usually confined to the right of the track in the Northern<br />
Hemisphere (left of the track in the Southern Hemisphere)<br />
and to a relatively small section of the coastline. It most<br />
often occurs with the approach of the storm, but in some<br />
cases, where a surge moves into a long channel, the effect<br />
may be delayed. Occasionally, the greatest rise in water is<br />
observed on the opposite side of the track, when northerly<br />
winds funnel into a partially landlocked harbor. The surge<br />
could be 3 feet or less, or it could be 20 feet or more,<br />
depending on the combination of factors involved.<br />
There have been reports of a “hurricane wave,”<br />
described as a “wall of water,” which moves rapidly toward<br />
the coastline. Authenticated cases are rare, but some of the<br />
world’s greatest natural disasters have occurred as a result<br />
of this wave, which may be a rapidly rising and abnormally<br />
high storm surge. In India, such a disaster occurred in 1876,<br />
between Calcutta and Chittagong, and drowned more than<br />
100,000 persons.<br />
Along the coast, greater damage may be inflicted by<br />
water than by the wind. There are at least four sources of<br />
water damage. First, the unusually high seas generated by<br />
the storm winds pound against shore installations and craft<br />
in their way. Second, the continued blowing of the wind<br />
toward land causes the water level to increase perhaps 3 to<br />
10 feet above its normal level. This storm tide, which may<br />
begin when the storm center is 500 miles or even farther<br />
from the shore, gradually increases until the storm passes.<br />
The highest storm tides are caused by a slow-moving<br />
tropical cyclone of large diameter, because both of these<br />
effects result in greater duration of wind in the same<br />
direction. The effect is greatest in a partly enclosed body of<br />
water, such as the Gulf of Mexico, where the concave<br />
coastline does not readily permit the escape of water. It is<br />
least on small islands, which present little obstruction to the<br />
flow of water. Third, the furious winds which blow around<br />
the wall of the eye create a ridge of water called a storm<br />
wave, which strikes the coast and often inflicts heavy<br />
damage. The effect is similar to that of a seismic sea wave,<br />
caused by an earthquake in the ocean floor. Both of these<br />
waves are popularly called tidal waves. Storm waves of 20<br />
feet or more have occurred. About 3 or 4 feet of this wave<br />
might be due to the decrease in atmospheric pressure as the<br />
sea surface is drawn up into the low pressure area, and the<br />
rest to winds. Like the damage caused by wind, damage due<br />
to high seas, the storm surge and tide, and the storm wave<br />
is greatest in the dangerous semicircle, near the center. The<br />
fourth source of water damage is the heavy rain that<br />
accompanies a tropical cyclone. This causes floods that add<br />
to the damage caused in other ways.<br />
There have been many instances of tornadoes<br />
occurring within the circulation of tropical cyclones. Most<br />
of these have been associated with tropical cyclones of the<br />
North Atlantic Ocean and have occurred in the West Indies<br />
and along the gulf and Atlantic coasts of the United States.<br />
They are usually observed in the forward semicircle or<br />
along the advancing periphery of the storm. These<br />
tornadoes are usually short-lived and less intense than those<br />
that occur in the midwestern United States.<br />
When proceeding along a shore recently visited by a<br />
tropical cyclone, a navigator should remember that time is<br />
required to restore aids to navigation which have been<br />
blown out of position or destroyed. In some instances the<br />
aid may remain but its light, sound apparatus, or<br />
radiobeacon may be inoperative. Landmarks may have<br />
been damaged or destroyed, and in some instances the<br />
coastline and hydrography may be changed.