

Environmental Impact Assessment - Municipal
Environmental Impact Assessment - Municipal
Environmental Impact Assessment - Municipal

You also want an ePaper? Increase the reach of your titles
YUMPU automatically turns print PDFs into web optimized ePapers that Google loves.
EA for the Proposed STP<br />
3.3 MICROMETEROLOGY<br />
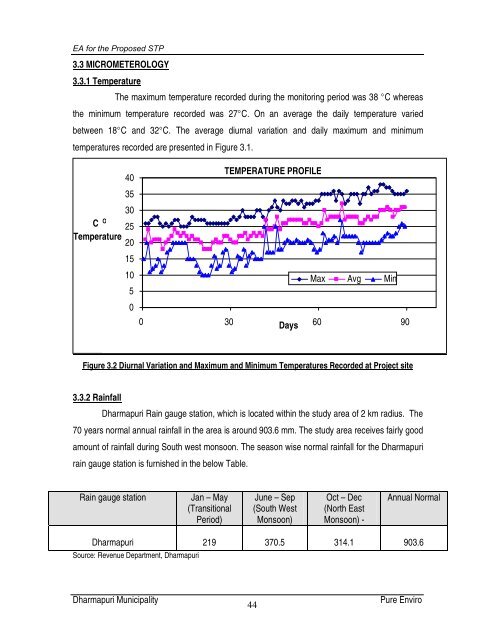
3.3.1 Temperature<br />
The maximum temperature recorded during the monitoring period was 38 °C whereas<br />
the minimum temperature recorded was 27°C. On an average the daily temperature varied<br />
between 18°C and 32°C. The average diurnal variation and daily maximum and minimum<br />
temperatures recorded are presented in Figure 3.1.<br />
Figure 3.2 Diurnal Variation and Maximum and Minimum Temperatures Recorded at Project site<br />
3.3.2 Rainfall<br />
40<br />
35<br />
30<br />
O C 25<br />
Temperature<br />
20<br />
15<br />
10<br />
5<br />
0<br />
Dharmapuri Rain gauge station, which is located within the study area of 2 km radius. The<br />
70 years normal annual rainfall in the area is around 903.6 mm. The study area receives fairly good<br />
amount of rainfall during South west monsoon. The season wise normal rainfall for the Dharmapuri<br />
rain gauge station is furnished in the below Table.<br />
Rain gauge station Jan – May<br />
(Transitional<br />
Period)<br />
Dharmapuri<br />
Source: Revenue Department, Dharmapuri<br />
219<br />
TEMPERATURE PROFILE<br />
June – Sep<br />
(South West<br />
Monsoon)<br />
370.5<br />
Max Avg Min<br />
0 30 60 90<br />
Days<br />
Oct – Dec<br />
(North East<br />
Monsoon) -<br />
314.1<br />
Annual Normal<br />
903.6<br />
Dharmapuri <strong>Municipal</strong>ity Pure Enviro<br />
44


