New Perspectives in Energy Storage Materials
New Perspectives in Energy Storage Materials
New Perspectives in Energy Storage Materials

Create successful ePaper yourself
Turn your PDF publications into a flip-book with our unique Google optimized e-Paper software.
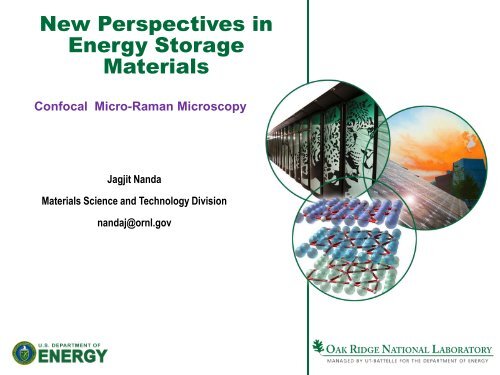
<strong>New</strong> <strong>Perspectives</strong> <strong>in</strong><br />
<strong>Energy</strong> <strong>Storage</strong><br />
<strong>Materials</strong><br />
Confocal Micro-Raman Microscopy<br />
Jagjit Nanda<br />
<strong>Materials</strong> Science and Technology Division<br />
nandaj@ornl.gov
t<br />
10 3 s<br />
1 s<br />
10 -3 s 10 -6 s<br />
10 -9 s<br />
The Scale of Th<strong>in</strong>gs<br />
Primary<br />
Particles<br />
Secondary<br />
Particles<br />
Cell<br />
Electrode<br />
10 -9 m 10 -6 m 10 -3 m 1 m<br />
• Complex electrode assembly<br />
• Multiple transport regime<br />
• Spatio-temporal variation<br />
Courtesy : Sreekanth Pannala<br />
Battery Pack<br />
x
Work<strong>in</strong>g of a Li-ion full cell
Connect<strong>in</strong>g Fundamental Material Properties<br />
to Macroscopic Parameters<br />
• S<strong>in</strong>gle particle “State of Charge” (SOC).<br />
“Enabler for full capacity utilization”<br />
• Observation of “Lithium Gradient” <strong>in</strong> an <strong>in</strong>homogeneous<br />
medium.<br />
4 Managed by UT-Battelle<br />
for the U.S. Department of <strong>Energy</strong><br />
“ Transport <strong>in</strong> a complex electrode assembly”
5 Managed by UT-Battelle<br />
for the U.S. Department of <strong>Energy</strong><br />
Confocal Raman-AFM Setup<br />
Support from <strong>Energy</strong> <strong>Storage</strong>, OVT, EERE DOE<br />
Spatial Resolution ~ 300 nm<br />
Peizo driven mapp<strong>in</strong>g stage<br />
Multiple excitation wavelength<br />
Raman Imag<strong>in</strong>g plus topography
60 µm 5 µm 700 nm<br />
6 Managed by UT-Battelle<br />
for the U.S. Department of <strong>Energy</strong><br />
High <strong>Energy</strong> and Power Li-ion Electrodes<br />
Electrode Secondary particle Primary particle<br />
Edge<br />
25 µm<br />
LiNi 0.80Co 0.15Al 0.05O 2 (NCA)<br />
LiNi 0.33Co 0.33Mn 0.33O 2 (NCM)<br />
xLi 2MnO 3 (1-x)LiMO 2 ( Excess Lithia compounds)
Counts<br />
1200<br />
1100<br />
1000<br />
900<br />
800<br />
700<br />
600<br />
500<br />
400<br />
Orig<strong>in</strong> of spectroscopic “SOC”<br />
475 cm -1<br />
E g<br />
550 cm -1<br />
300 400 500 600 700 800<br />
Raman shift / cm-1<br />
A 1g<br />
Charged NCA cathode (3.77V)<br />
a - NaFeO 2 structure<br />
oxygen<br />
metal<br />
• A1g – oxygen atoms vibrate <strong>in</strong> opposite directions parallel to c-axis<br />
• Eg – oxygen atoms vibrate alternately <strong>in</strong> opposite directions parallel to Li and<br />
transition metal planes.<br />
• SOC proportional to A 1<br />
A 1<br />
/ <br />
475 cm 550cm<br />
a<br />
c<br />
LiMO 2<br />
M = Ni, Co
Counts<br />
1200<br />
1100<br />
1000<br />
900<br />
800<br />
700<br />
600<br />
500<br />
400<br />
Micro-Raman Technique<br />
Positive Electrode Negative Electrode<br />
Raman spectrum of charged<br />
Raman Spectrum of Graphite<br />
(3.77 V) NCA Cathode<br />
Anode<br />
~470 cm-1 ~550 cm-1<br />
300 400 500 600 700 800<br />
Raman shift / cm-1<br />
A 470/A 550 ~ to SOC<br />
Counts<br />
1300<br />
1200<br />
1100<br />
1000<br />
900<br />
800<br />
700<br />
600<br />
500<br />
400<br />
300<br />
200<br />
D1 -Band<br />
G -Band<br />
1200 1300 1400 1500 1600 1700<br />
Raman shift / cm-1<br />
A D1/A G ~ Disorder<br />
Spectra can be obta<strong>in</strong>ed as a function of position on the surface and<br />
edge of the electrode material.<br />
8
9 Managed by UT-Battelle<br />
for the U.S. Department of <strong>Energy</strong><br />
Carbon Coverage : Cont<strong>in</strong>ued<br />
Intensity<br />
3000<br />
2500<br />
2000<br />
1500<br />
1000<br />
500<br />
X = -5, Y=1<br />
X = 5, Y = 1<br />
Fresh Sample (uncycled)<br />
0<br />
200 400 600 800 1000 1200 1400 1600 1800<br />
Raman Shift (cm -1 )<br />
Similar carbon coverage different particle “SOC”<br />
Uncharged<br />
NCA
Intensity Map<br />
Carbon<br />
J. Nanda et al. 2010<br />
10 Managed by UT-Battelle<br />
for the U.S. Department of <strong>Energy</strong><br />
Raman Mapp<strong>in</strong>g : What it can do ?<br />
Optical Micrograph Intensity Map (NCA)<br />
Micron<br />
State of Charge : (A 475 / A 550) × (I 475 / I 550)<br />
SOC Map<br />
NCA
Counts<br />
Counts<br />
Mapp<strong>in</strong>g Lithium Deficiency Regions : Li 1-xNi 0.80Co 0.20Al 0.05<br />
7000<br />
6000<br />
5000<br />
4000<br />
3000<br />
2000<br />
1000<br />
900<br />
800<br />
700<br />
600<br />
500<br />
400<br />
300<br />
Spectroscopic Signature<br />
300 400 500 600 700 800<br />
11 Managed by UT-Battelle<br />
for the U.S. Department of <strong>Energy</strong><br />
A 470/A 550 ~ 0.4<br />
Raman shift / cm-1<br />
A 470/A 550 ~ 1.2<br />
300 400 500 600 700 800<br />
Raman shift / cm-1<br />
Edge<br />
Mapp<strong>in</strong>g Pattern Surface<br />
Microns
Y (µm)<br />
X (µm)<br />
12 Managed by UT-Battelle<br />
for the U.S. Department of <strong>Energy</strong><br />
Severely degraded Sample<br />
SOC Map<br />
Current Current collector collector side side<br />
Count<br />
180<br />
160<br />
140<br />
120<br />
100<br />
J. Nanda et al. Under reveiw 2010<br />
Extreme charged regions<br />
80<br />
60<br />
40<br />
20<br />
degraded band cathode cross-section<br />
0<br />
0 1 2 3 4 5<br />
area x <strong>in</strong>tensity
Counts<br />
Counts<br />
1300<br />
1200<br />
1100<br />
1000<br />
900<br />
800<br />
700<br />
600<br />
500<br />
400<br />
300<br />
1700<br />
1600<br />
1500<br />
1400<br />
1300<br />
1200<br />
1100<br />
1000<br />
900<br />
800<br />
700<br />
600<br />
500<br />
400<br />
A D1/A G ~ 0.1<br />
1200 1300 1400 1500 1600 1700<br />
13 Managed by UT-Battelle<br />
for the U.S. Department of <strong>Energy</strong><br />
Spatial anode maps of A D1/A G -greater<br />
value, more graphite disorder (damage)<br />
Raman shift / cm-1<br />
1200 1300 1400 1500 1600 1700<br />
Raman shift / cm-1<br />
A D1/A G ~ 1.8
In situ Li-transport <strong>in</strong> Li-ion full cell<br />
Al<br />
e -<br />
Li +<br />
Separator<br />
Cathode Anode<br />
14 Managed by UT-Battelle<br />
for the U.S. Department of <strong>Energy</strong><br />
30µm<br />
Cu<br />
current<br />
collector
Counts<br />
Counts<br />
Counts<br />
Counts<br />
Counts<br />
2500<br />
2000<br />
1500<br />
2500<br />
2000<br />
1500<br />
3000<br />
2500<br />
2000<br />
1500<br />
2500<br />
2400<br />
2300<br />
2200<br />
2100<br />
2000<br />
1900<br />
1800<br />
1700<br />
1600<br />
1500<br />
1400<br />
1300<br />
1200<br />
1100<br />
2400<br />
2300<br />
2200<br />
2100<br />
2000<br />
1900<br />
1800<br />
1700<br />
1600<br />
1500<br />
1400<br />
1300<br />
S<strong>in</strong>gle Particle Charge-discharge of an <strong>in</strong> situ edge cell<br />
300 400 500 600 700 800<br />
1 – 0.98<br />
Raman shift / cm-1<br />
300 400 500 600 700 800<br />
2 – Raman shift 1.00<br />
/ cm-1<br />
300 400 500 600 700 800<br />
3 – Raman 1.12<br />
shift / cm-1<br />
300 400 500 600 700 800<br />
4 – Raman 1.05<br />
shift / cm-1<br />
300 400 500 600 700 800<br />
Raman shift / cm-1<br />
300 5 – 1.12<br />
15 Managed by UT-Battelle<br />
for the U.S. Department of <strong>Energy</strong><br />
5<br />
7<br />
Counts<br />
2200<br />
2100<br />
2000<br />
1900<br />
1800<br />
1700<br />
1600<br />
1500<br />
1400<br />
1300<br />
1200<br />
3<br />
1 2<br />
Cell voltage 3.7 V<br />
Avg. Area 474/Area 551 = 1.02 ± 0.10<br />
400 500 600 700 800<br />
Raman shift / cm-1 7 – 1.11 300<br />
Counts<br />
2500<br />
2400<br />
2300<br />
2200<br />
2100<br />
2000<br />
1900<br />
1800<br />
1700<br />
1600<br />
1500<br />
1400<br />
1300<br />
1200<br />
10<br />
9<br />
6<br />
8<br />
4<br />
8 – 1.12 300<br />
400 500 600 700 800<br />
Raman shift / cm-1<br />
Pos. → 472.1 ± 0.76 cm -1<br />
Width → 56.4 ± 2.2 cm -1<br />
Counts<br />
Counts<br />
2400<br />
2300<br />
2200<br />
2100<br />
2000<br />
1900<br />
1800<br />
1700<br />
1600<br />
1500<br />
1400<br />
1300<br />
1200<br />
1100<br />
2400<br />
2300<br />
2200<br />
2100<br />
2000<br />
1900<br />
1800<br />
1700<br />
1600<br />
1500<br />
1400<br />
1300<br />
1200<br />
1100<br />
electrode<br />
300 400 500 600 700 800<br />
10 – 0.99<br />
Raman shift / cm-1<br />
9 – 0.98<br />
400 500 600 700 800<br />
Raman shift / cm-1<br />
x<br />
Pos. → 547.2 ± 0.91 cm -1<br />
Width → 56.9 ± 2.0 cm -1
Intensity<br />
4000<br />
3000<br />
2000<br />
1000<br />
3.93 V<br />
3.77 V<br />
3.6 V<br />
3.52 V<br />
3.47 V<br />
3.1 V<br />
472 (60.8)<br />
Observ<strong>in</strong>g “s<strong>in</strong>gle particle” state of charge<br />
Cathode Particle<br />
475.5 (55.42)<br />
475.9 (51.3)<br />
476.3 (51)<br />
Cathode Particle 2<br />
Near Separator<br />
473.9 (52.9) 550.3 (56.1) 0.84<br />
200 300 400 500 600 700 800<br />
Raman Shift (cm -1 )<br />
547.5 (61.8)<br />
471.33 (54.42) 448.3.5 (61.6) 0.71<br />
550.5 (48.7)<br />
553.1 (50)<br />
553 (50)<br />
0.87<br />
0.94<br />
1.03<br />
1.43<br />
Separator<br />
Intensity<br />
20 µm<br />
7000<br />
6000<br />
5000<br />
4000<br />
3000<br />
2000<br />
3.93 V<br />
3.73 V<br />
3.65 V<br />
3.52V<br />
3.34 V<br />
3.0 V<br />
Anode Particle<br />
Galvanostatic at 1C rate<br />
10 µm<br />
Anode Particle Near Separator<br />
1300 1400 1500 1600 1700<br />
Raman Shift (cm -1 )<br />
1581.0 cm -1<br />
1589.0 cm -1<br />
1589.77 cm -1<br />
Graphite<br />
Li xC 6<br />
~ LiC 6
Intensity<br />
4000<br />
3000 3.41 V<br />
2000<br />
3.68 V<br />
1000<br />
3.1 V<br />
3.1 V<br />
3.51 V<br />
3.84 V<br />
4.17 V<br />
4.00 V<br />
3.87 V<br />
474.8 (54.1)<br />
474.8 (51.0)<br />
Dynamical Potentiostatic Condition<br />
In-situ Cell<br />
Cat Spot 3<br />
May 21<br />
0<br />
300 400 500 600 700<br />
Raman Shift (cm -1 )<br />
549 (50.64)<br />
550.1 (53.8)<br />
-145 Ah<br />
-145 Ah<br />
-200 Ah<br />
-200 Ah<br />
-200 Ah<br />
+444 Ah<br />
1.01<br />
+200 Ah<br />
0.89<br />
SOC α<br />
A<br />
Intensity<br />
2500<br />
2000<br />
1500<br />
1000<br />
500<br />
J. Nanda et. al. Manuscript (2010)<br />
4.15V<br />
4.05V<br />
3.75 V<br />
3.5 V<br />
In-Situ Cell<br />
Cat Spot 3<br />
May 21<br />
0<br />
300 400 500 600 700<br />
A<br />
1<br />
/ 1<br />
475 cm 550cm<br />
Raman Shift (cm -1 )<br />
+ 373 A<br />
+ 310 A<br />
+ 386 A<br />
+ 200 A
Intensity<br />
Intensity<br />
8000<br />
7000<br />
6000<br />
5000<br />
4000<br />
3000<br />
2000<br />
1000<br />
13000<br />
12000<br />
11000<br />
10000<br />
9000<br />
8000<br />
7000<br />
6000<br />
5000<br />
4000<br />
3000<br />
2000<br />
1000<br />
Fully Discharged<br />
1b: 700 - 639 A<br />
1c: 471 - 439 A<br />
1 d: 353 - 335 A<br />
Particle 1<br />
1e: PS @ 3.85V (599 - 462 A)<br />
1f: PS @ 3.95V (487 - 404 A)<br />
1g: PS @ 3.95V (228 - 222 A)<br />
1 h: PS @ 3.95V (142 - 137 A)<br />
1I: PS @ 4.05 V (107 - 102 A)<br />
1J PS @ 4.15 V (134 - 111 A)<br />
1 k PS @ 4.2 V( 55 - 54 A)<br />
Dynamical Potentiostatic Condition<br />
Data recorded dur<strong>in</strong>g PS @ 3.75 V<br />
1300 1400 1500 1600 1700<br />
Raman Shift (cm -1 )<br />
1589.45<br />
1589<br />
1586.8 (13.7)<br />
1582 (17)<br />
1589.5<br />
( 30 averages)<br />
J. Nanda et al. (unpublished)<br />
Hardwick et al. Solid State Ionics 177 (2006)
Intensity Intensity<br />
µm<br />
600<br />
500<br />
400<br />
300<br />
200<br />
100<br />
Si Si<br />
High Capacity Si-C Composite Anode<br />
D D 1 I<br />
Raman Shift (cm-1 Raman Shift (cm ) -1 )<br />
G<br />
G<br />
0<br />
400 600 800 1000 1200 1400 1600<br />
µm<br />
D D II 2<br />
Raman Raman Raman Intensity Intensity Intensity (arbitary (arbitary (arbitary units) units) units)<br />
20000<br />
16000<br />
12000<br />
1st 1 discharge cycle<br />
st 1 discharge cycle<br />
st discharge cycle<br />
0.85 V<br />
0.45 V<br />
0.35 V<br />
0.2 V<br />
0.08 V<br />
0.05 V<br />
1st 1 charge cycle<br />
st 1 charge cycle<br />
st charge cycle<br />
µm In-situ observation of lithiation of silicon-rich region <strong>in</strong> Si-C composite<br />
Ratio of Si area to G-Band area<br />
(a)<br />
Nanda et al. Electrochem. Comm. (2009)<br />
10 µm<br />
(b)<br />
10 µm<br />
475 500 525 550 575<br />
Wave Number (cm -1 475 500 525 550 575<br />
Wave Number (cm )<br />
-1 475 500 525 550 575<br />
Wave Number (cm )<br />
-1 )<br />
1V<br />
0.6V<br />
0.4 V<br />
500 550<br />
19
Conclusions<br />
• Relative measure of spatial SOC distribution of cathode<br />
particle aggregates.<br />
• Raman Intensity versus State of Charge : Sk<strong>in</strong> Depth<br />
Effect.<br />
• Micron level mapp<strong>in</strong>g of electrodes: Observation of Ligradient.<br />
• K<strong>in</strong>etics of lithiation-delithiation at the primarysecondary<br />
particle <strong>in</strong>terface<br />
20 Managed by UT-Battelle<br />
for the U.S. Department of <strong>Energy</strong>