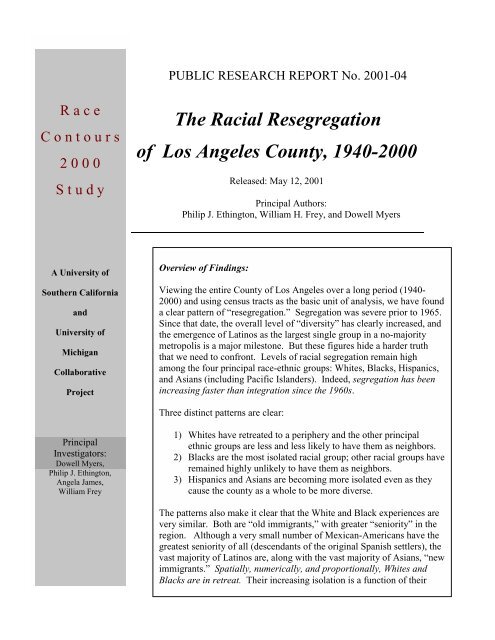
The Racial Resegregation of Los Angeles County, 1940-2000
The Racial Resegregation of Los Angeles County, 1940-2000
The Racial Resegregation of Los Angeles County, 1940-2000

Create successful ePaper yourself
Turn your PDF publications into a flip-book with our unique Google optimized e-Paper software.
R a c e<br />
C o n t o u r s<br />
2 0 0 0<br />
S t u d y<br />
A University <strong>of</strong><br />
Southern California<br />
and<br />
University <strong>of</strong><br />
Michigan<br />
Collaborative<br />
Project<br />
Principal<br />
Investigators:<br />
Dowell Myers,<br />
Philip J. Ethington,<br />
Angela James,<br />
William Frey<br />
PUBLIC RESEARCH REPORT No. 2001-04<br />
<strong>The</strong> <strong>Racial</strong> <strong>Resegregation</strong><br />
<strong>of</strong> <strong>Los</strong> <strong>Angeles</strong> <strong>County</strong>, <strong>1940</strong>-<strong>2000</strong><br />
Released: May 12, 2001<br />
Principal Authors:<br />
Philip J. Ethington, William H. Frey, and Dowell Myers<br />
Overview <strong>of</strong> Findings:<br />
Viewing the entire <strong>County</strong> <strong>of</strong> <strong>Los</strong> <strong>Angeles</strong> over a long period (<strong>1940</strong>-<br />
<strong>2000</strong>) and using census tracts as the basic unit <strong>of</strong> analysis, we have found<br />
a clear pattern <strong>of</strong> “resegregation.” Segregation was severe prior to 1965.<br />
Since that date, the overall level <strong>of</strong> “diversity” has clearly increased, and<br />
the emergence <strong>of</strong> Latinos as the largest single group in a no-majority<br />
metropolis is a major milestone. But these figures hide a harder truth<br />
that we need to confront. Levels <strong>of</strong> racial segregation remain high<br />
among the four principal race-ethnic groups: Whites, Blacks, Hispanics,<br />
and Asians (including Pacific Islanders). Indeed, segregation has been<br />
increasing faster than integration since the 1960s.<br />
Three distinct patterns are clear:<br />
1) Whites have retreated to a periphery and the other principal<br />
ethnic groups are less and less likely to have them as neighbors.<br />
2) Blacks are the most isolated racial group; other racial groups have<br />
remained highly unlikely to have them as neighbors.<br />
3) Hispanics and Asians are becoming more isolated even as they<br />
cause the county as a whole to be more diverse.<br />
<strong>The</strong> patterns also make it clear that the White and Black experiences are<br />
very similar. Both are “old immigrants,” with greater “seniority” in the<br />
region. Although a very small number <strong>of</strong> Mexican-Americans have the<br />
greatest seniority <strong>of</strong> all (descendants <strong>of</strong> the original Spanish settlers), the<br />
vast majority <strong>of</strong> Latinos are, along with the vast majority <strong>of</strong> Asians, “new<br />
immigrants.” Spatially, numerically, and proportionally, Whites and<br />
Blacks are in retreat. <strong>The</strong>ir increasing isolation is a function <strong>of</strong> their
shrinking size and location vis-à-vis the “new immigrants.” Latinos and Asians, by<br />
contrast, are dynamic populations, growing spatially, numerically, and proportionally.<br />
<strong>The</strong>ir communities are exploding around many nodes <strong>of</strong> original settlement. <strong>The</strong>ir<br />
increasing isolation is a function <strong>of</strong> the classic “immigrant enclave” effect. As our use <strong>of</strong><br />
the “exposure index” makes clear, Whites and Blacks together have been somewhat more<br />
likely to have Latino and Asian neighbors (simply because they are outnumbered), but<br />
Latinos and Asians are decreasingly likely to have White or Black neighbors.<br />
While we find these patterns to be very clear, we also want to emphasize that they are not<br />
the whole story. This study treats <strong>Los</strong> <strong>Angeles</strong> <strong>County</strong>, the nation’s most populous at 9.5<br />
million persons) as a single continuous space. Two companion Public Research Reports<br />
from our study group analyze the wide variance <strong>of</strong> conditions among the many specific<br />
places within LA <strong>County</strong>. 1<br />
It is also too early draw a complete set <strong>of</strong> conclusions about many <strong>of</strong> the possible causes<br />
or effects <strong>of</strong> these findings. “Segregation” is used here as a descriptive term, rather than<br />
as a normative one. It has had, and certainly can have reprehensible causes and socially<br />
destructive effects. It can still be, can certainly has been, caused by overt or systematic<br />
housing or job discrimination. When linked to locational disadvantages such as high<br />
crime rates, low job opportunity, and poor schools, it can have very negative effects. We<br />
have other research projects 2 under way to identify these causes and effects, but this<br />
paper sets out primarily to establish the patterns themselves.<br />
Even within the descriptive boundaries <strong>of</strong> this analysis we have been able to identify two<br />
“causes” that have operated to produced the resegregation <strong>of</strong> <strong>Los</strong> <strong>Angeles</strong> <strong>County</strong>:<br />
a) <strong>The</strong> simple spatial arithmetic <strong>of</strong> population dynamics. <strong>The</strong> explosion <strong>of</strong> Latino<br />
and Asian immigrant populations and steady shrinkage <strong>of</strong> White and Black<br />
populations “explains,” in a statistical sense, the moderate increase in White<br />
exposure to people <strong>of</strong> color and the rising levels <strong>of</strong> isolation among the new<br />
immigrants.<br />
b) <strong>The</strong> patterns <strong>of</strong> White residential behavior. Alone among the four principle racial<br />
groups, we can say with confidence that Whites have had the freedom to settle<br />
wherever their wealth enables them to purchase a home. <strong>The</strong>y have used that<br />
freedom to flee the growing diversity <strong>of</strong> the metropolis, either by moving out <strong>of</strong><br />
the county completely or by retreating to its edges. 3<br />
1 Myers and Park (Race Contours <strong>2000</strong> Public Research Report 2001-05) emphasize the growth <strong>of</strong><br />
“<strong>Racial</strong>ly Balanced” cities since 1980 among the 177 cities <strong>of</strong> <strong>Los</strong> <strong>Angeles</strong> <strong>County</strong>, Orange, Riverside, San<br />
Bernardino, and Ventura counties. Frey and Ethington (Race Contours Public Research Report 2001-06)<br />
emphasize the variance in segregation indices among 77 cities <strong>of</strong> <strong>Los</strong> <strong>Angeles</strong> <strong>County</strong> from 1990 to <strong>2000</strong>.<br />
2 Ethington, “Segregated Diversity” (Haynes Foundation Final Report, August <strong>2000</strong>) shows a very<br />
strong correlation between White residential location and high median home prices, suggesting that the<br />
“cause” <strong>of</strong> White/nonwhite segregation is a barrier <strong>of</strong> very high property values that prevents Blacks and<br />
new immigrants (all upwardly mobile groups) from entering White neighborhoods.<br />
3 To some extent, members <strong>of</strong> each racial group have freedom to settle where their wealth can<br />
afford a home, and a crucial effort in our ongoing research is to better understand the voluntary decisions <strong>of</strong><br />
Race Contours <strong>2000</strong> –<strong>Resegregation</strong> <strong>of</strong> <strong>Los</strong> <strong>Angeles</strong> <strong>County</strong>, <strong>1940</strong>-<strong>2000</strong> 2
Table <strong>of</strong> Contents:<br />
Page<br />
1.0 Overview <strong>of</strong> Findings 1<br />
2.0 Overview <strong>of</strong> Methods 4<br />
2.1 <strong>The</strong> <strong>1940</strong>-<strong>2000</strong> Dataset 4<br />
2.2 Definition <strong>of</strong> <strong>Racial</strong> Groups 4<br />
2.3 Explanation <strong>of</strong> the Segregation Indices 5<br />
2.31 <strong>The</strong> Diversity Index 5<br />
2.32 <strong>The</strong> Index <strong>of</strong> Dissimilarity 5<br />
2.33 <strong>The</strong> Exposure Index 6<br />
3.0 Summary <strong>of</strong> Specific Findings 8<br />
4.0 Detailed Findings 10<br />
Chart 1: Overall Population Figures 10<br />
Chart 2: Diversity Index 11<br />
Chart 3: Index <strong>of</strong> Dissimilarity 12<br />
Chart 4a: Exposure Index – White Neighbors 13<br />
Chart 4b: Exposure Index – White Settlers 14<br />
Chart 5a: Exposure Index – Black Neighbors 15<br />
Chart 5b: Exposure Index – Black Settlers 16<br />
Chart 6a: Exposure Index – Hispanic Neighbors 17<br />
Chart 6b: Exposure Index – Black Settlers 18<br />
Chart 7a: Exposure Index – Asian Neighbors 19<br />
Chart 7b: Exposure Index – Asian Settlers 20<br />
Map : White Majority Census Tracts, <strong>1940</strong>-<strong>2000</strong> 21<br />
Bibliography: Works Cited 22<br />
people <strong>of</strong> color to locate among neighbors <strong>of</strong> their own racial group. Notwithstanding this phenomenon,<br />
however, housing market discrimination against affluent people <strong>of</strong> color is very well documented, and<br />
conversely, discrimination against affluent Whites has never been documented.<br />
Race Contours <strong>2000</strong> –<strong>Resegregation</strong> <strong>of</strong> <strong>Los</strong> <strong>Angeles</strong> <strong>County</strong>, <strong>1940</strong>-<strong>2000</strong> 3
2.0 Overview <strong>of</strong> Methods<br />
Questions <strong>of</strong> method loom large in studies <strong>of</strong> U.S. Census data. <strong>The</strong> two crucial areas <strong>of</strong><br />
methodological concern in this study are: 1) “Why are the data from <strong>1940</strong>-<strong>2000</strong><br />
comparable and uniform?”; 2) “How did we define the four principal racial groups?” and<br />
3) “What do the different measures <strong>of</strong> segregation mean?”<br />
2.1 <strong>The</strong> <strong>1940</strong>-<strong>2000</strong> Dataset<br />
This study is based on a uniform dataset, in which comparable data has been organized<br />
into the <strong>2000</strong> Census tract boundaries, from <strong>1940</strong> through <strong>2000</strong> (N=2,055 census tracts).<br />
We began with the <strong>Los</strong> <strong>Angeles</strong> <strong>County</strong> Union Census Tract Data Series, <strong>1940</strong>-1990<br />
(Ethington Kooista and DeYoung <strong>2000</strong>), which is fitted to the 1990 census tract<br />
boundaries. Upon release <strong>of</strong> the California census data in March <strong>of</strong> 2001, we constructed<br />
variables for the four principal race-ethnic groups (see below) that were most compatible<br />
with the way those racial variables were defined in 1990. <strong>The</strong> entire <strong>1940</strong>-1990 data<br />
series were then fitted to the <strong>2000</strong> census tract boundaries using ESRI’s ArcInfo ®<br />
s<strong>of</strong>tware to reallocate 1990 tract aggregates in areal proportion to the polygonal overlays<br />
<strong>of</strong> the <strong>2000</strong> boundaries.<br />
2.2 Definition <strong>of</strong> <strong>Racial</strong> Groups<br />
By convention and by virtue <strong>of</strong> their numerical prominence, social scientists and public<br />
policy makers have come to focus on four principal racial-ethnic groups: White, African-<br />
American or Black, Hispanic or Latino, and Asian and Pacific Islanders. For technical<br />
and also political reasons, Hispanics have been treated by the U.S. Census Bureau as an<br />
“ethnic” rather than a “racial” category. Respondents have been asked wither they hare<br />
“Hispanic” separately from what racial group they belong to. Hispanics, in other words,<br />
can be <strong>of</strong> any race. We have termed this classification method “Hispanic categorical<br />
dominance.” (Meyers and James 2001). By convention and also political necessity,<br />
researchers have essentially “racialized” the supposedly “ethnic” Hispanic category, by<br />
treating “Hispanics” as a comparable category to those <strong>of</strong> “Non-Hispanic Whites,” and<br />
“Non-Hispanic Blacks” In everyday life and ordinary speech, “Hispanic” or “Latino” is<br />
used in the same sense as “White” or “Black” or “Asian.” Thus, we have dispensed with<br />
the cumbersome pretense <strong>of</strong> the race versus ethnic distinction and refer hereafter only to<br />
“racial groups.” Moreover, the <strong>2000</strong> Census famously allowed each respondent to<br />
identify as a member <strong>of</strong> more than one race. <strong>The</strong>re are many ways <strong>of</strong> classifying the<br />
races now, thanks to the millions who have chosen more than one race. In this study, the<br />
most important consideration was to classify races to be most compatible with the 1990<br />
and earlier classification methods. <strong>The</strong> method used here is the “Hispanic categorical<br />
dominance” with “fractional apportionment <strong>of</strong> multiracials.” All persons reporting<br />
Hispanic identity are reserved for the Hispanic category. <strong>The</strong>n, persons reporting more<br />
than one race are fractionally apportioned to the races they report. A person reporting<br />
herself to be “African American or Black” and “White” is apportioned ½ to Black and ½<br />
to White. If she had reported “Hispanic” in addition to these “racial” categories, then<br />
100% <strong>of</strong> her would have gone to the Hispanic category. “Asians” include, <strong>of</strong> course, a<br />
Race Contours <strong>2000</strong> –<strong>Resegregation</strong> <strong>of</strong> <strong>Los</strong> <strong>Angeles</strong> <strong>County</strong>, <strong>1940</strong>-<strong>2000</strong> 4
great variety <strong>of</strong> race-ethnic identities, from Vietnamese to Chinese, Korean, and<br />
Japanese. We cannot deal with the rationality <strong>of</strong> this system here, but again we are<br />
following convention by treating Asians as a single category. We include as well Pacific<br />
Islanders and Native Hawaiians in this category. Native Americans and all those<br />
classified as “other race,” all totaling less than 1% <strong>of</strong> the <strong>Los</strong> <strong>Angeles</strong> <strong>County</strong> population,<br />
have also been added to the Asian category, for reasons <strong>of</strong> compatibility with the <strong>1940</strong>-<br />
1990 data series.<br />
Thus, for reasons <strong>of</strong> simplicity and common sense, “Whites” (in reality Euro-Americans)<br />
are called “Whites,” Non-Hispanic African Americans are called “Blacks”; “Hispanics”<br />
and “Latinos” are used interchangeably and Asians and Pacific Islanders are called<br />
“Asians.”<br />
2.3 Explanation <strong>of</strong> the Segregation Indices<br />
For a complete discussion <strong>of</strong> the three main indices <strong>of</strong> segregation used in this study, see<br />
Lieberson (1981), Massey and Denton (1988), White (1983), and White (1986). <strong>The</strong><br />
following is only a brief overview.<br />
2.31 <strong>The</strong> Diversity Index<br />
<strong>The</strong> Diversity Index ranges from 0 to about 1.4, and increases as the four racial groups<br />
become more balanced within tracts, regardless <strong>of</strong> their proportion in the <strong>County</strong> as a<br />
whole. <strong>The</strong> table below shows the Diversity Index and percentage racial populations for<br />
five tracts in the year <strong>2000</strong>: the least diverse, the 25 th percentile, the median, the 75th<br />
percentile, and the most diverse. Note that the actual population proportions for the<br />
county as a whole in <strong>2000</strong> were 32% White; 9.7% Black, 44.6% Hispanic, and 13.7%<br />
Asian.<br />
Tract Diversity<br />
Index<br />
White Black Hispanic Asian Percentile<br />
6<strong>2000</strong>3 0.00 100% 0% 0% 0% Lowest<br />
541400 0.66 1% 26% 73% 1% 25 th<br />
297000 0.87 69% 3% 21% 7% Median<br />
311800 1.06 36% 3% 50% 10% 75 th<br />
572201 1.37 24% 19% 25% 32% Highest<br />
2.32 <strong>The</strong> Index <strong>of</strong> Dissimilarity<br />
<strong>The</strong> Index <strong>of</strong> Dissimilarity, or “ID,”is the most commonly used measure <strong>of</strong> “segregation” in<br />
American social science since the 1950s. Based always on a comparison <strong>of</strong> two groups (eg,<br />
White vs. Nonwhites, Blacks vs. Nonblacks), this measure is very easy to interpret. <strong>The</strong> Index <strong>of</strong><br />
Dissimilarity ranges from 0 to 1 (or 0% to 100%), and tells us the percentage <strong>of</strong> a given<br />
population that would have to change its residential location in order to even-out the distribution<br />
<strong>of</strong> that groups across the metropolitan space. If Blacks were evenly settled across the entire<br />
Race Contours <strong>2000</strong> –<strong>Resegregation</strong> <strong>of</strong> <strong>Los</strong> <strong>Angeles</strong> <strong>County</strong>, <strong>1940</strong>-<strong>2000</strong> 5
county, for example, their ID would be 0 (perfectly integrated). If Blacks only lived in census<br />
tracts that were 100% Black, and no where else, then their ID score would be 1 (or 100% --<br />
perfectly segregated). Scores <strong>of</strong> 70% or higher are considered to show serious segregation.<br />
Blacks in U.S. cities have shown scores higher than this figure since the Second World War, and<br />
yet in many western cities this figure has come down significantly. Here in <strong>Los</strong> <strong>Angeles</strong> the ID<br />
for Blacks has decreased significantly from the very high 88% in 1960 and 1970 to the relatively<br />
moderate 57% in <strong>2000</strong>. Characterizing 57% as “moderate” is merely a relative judgment. It still<br />
means that 57% <strong>of</strong> all Blacks would need to move their place <strong>of</strong> residence in order to achieve<br />
perfectly even distribution across the county.<br />
Although the ID is important and useful, at least because it is so widely used, it is also a rather<br />
crude measure <strong>of</strong> segregation and needs to be supplemented with more nuanced measures. It is<br />
totally insensitive to actual and relative group population sizes, for instance. For example, Blacks<br />
in <strong>Los</strong> <strong>Angeles</strong> <strong>County</strong> might have the same ID score <strong>of</strong>, say, 57%, if there were only 10 Blacks<br />
in the county, 1,000 Blacks, or 1,000,000. It only tells us how many Blacks would have to move<br />
to even out the distribution, and it does not say anything about relative group sizes or their<br />
relative location.<br />
2.33 <strong>The</strong> Exposure Index<br />
<strong>The</strong> Exposure Index is the central tool used to evaluate trends in segregation in this study.<br />
<strong>The</strong> Exposure Index takes into account the relative sizes and locations <strong>of</strong> the various<br />
groups in the county and calculates the probability (ranging from 0% to 100%) that<br />
members <strong>of</strong> one group will have members <strong>of</strong> the other groups (or members <strong>of</strong> their own<br />
group) as neighbors. <strong>The</strong> unit <strong>of</strong> analysis is the census tract, which is taken to represent<br />
the “neighborhood.” <strong>The</strong> median tract population in <strong>Los</strong> <strong>Angeles</strong> <strong>County</strong> in <strong>2000</strong> was<br />
4,461; the average was 4,633. <strong>The</strong> “probability” <strong>of</strong> “exposure” then, is that a person will<br />
have a member <strong>of</strong> X group as a residential neighbor within their own census tract <strong>of</strong><br />
residence. <strong>The</strong> Exposure Index is a measure <strong>of</strong> residential segregation only. It does not<br />
measure the “exposure” <strong>of</strong> groups to one another in the workplace or in public places<br />
such as parks or shopping malls.<br />
<strong>The</strong> most powerful feature <strong>of</strong> the Exposure Index is that it is asymmetric. For example,<br />
Blacks in <strong>1940</strong> had a 45% chance <strong>of</strong> having White neighbors, but Whites only had a 1%<br />
chance <strong>of</strong> having a Black neighbor. Why this asymmetry? Whites (at 2.6 million in<br />
<strong>1940</strong>) vastly outnumbered Blacks (75,000 in that year) in <strong>Los</strong> <strong>Angeles</strong> <strong>County</strong>.<br />
Moreover, the vast majority <strong>of</strong> Whites lived in segregated neighborhoods in which<br />
Blacks were not permitted to live. Conversely a great many Whites lived in the<br />
neighborhoods segregated for nonwhite residence (very few tracts were more than 50%<br />
Black even in Jim Crow’s heyday). Thus, by virtue <strong>of</strong> the specific locational and<br />
proportional conditions <strong>of</strong> the county in <strong>1940</strong>, Blacks were “exposed” to Whites much<br />
more frequently than Whites were to Blacks, and a strong measure or segregation should<br />
tell us this.<br />
<strong>The</strong> very strength <strong>of</strong> the Exposure Index—that it allows us to see the segregation<br />
condition between more than one group at a time and from the different perspectives <strong>of</strong><br />
each <strong>of</strong> these groups, also leads to a confusing number <strong>of</strong> indexes: Between Blacks and<br />
Race Contours <strong>2000</strong> –<strong>Resegregation</strong> <strong>of</strong> <strong>Los</strong> <strong>Angeles</strong> <strong>County</strong>, <strong>1940</strong>-<strong>2000</strong> 6
Hispanics, Hispanics and Blacks, Blacks and Asians, Asians and Blacks, Blacks and<br />
Whites, Whites and Blacks, and so on. In order to manage this complexity and also to<br />
make the greatest sense <strong>of</strong> the data, we have paired the charts displaying trends in the<br />
Exposure Index by the two underlying “perspectives” implied by the asymmetric pairs.<br />
We call these two perspectives “Neighbors” and “Settlers.”<br />
Example: “White Neighbors” (Asks: what is the probability that Whites, Blacks,<br />
Hispanics, and Asians will have White neighbors?)<br />
Whites<br />
Blacks<br />
Latinos Whites ?<br />
Asians<br />
Example: “White Settlers” (Asks: what is the probability that Whites will have<br />
Whites, Blacks, Latinos, and Asians as neighbors?)<br />
Whites<br />
Whites ?<br />
Blacks ?<br />
Latinos ?<br />
Asians ?<br />
We have also taken care to explain our findings in straightforward, intuitive terms. Each<br />
chart is accompanied with an explanation <strong>of</strong> the trends represented in it.<br />
Race Contours <strong>2000</strong> –<strong>Resegregation</strong> <strong>of</strong> <strong>Los</strong> <strong>Angeles</strong> <strong>County</strong>, <strong>1940</strong>-<strong>2000</strong> 7
3.0 Summary <strong>of</strong> Specific Findings:<br />
Great differences in the historical and recent dynamics <strong>of</strong> each <strong>of</strong> the major racial<br />
groups requires us to look at the question <strong>of</strong> “segregation” from each group’s<br />
perspective:<br />
WHITES<br />
• Whites became less isolated from all other racial groups, but only relatively so.<br />
Most <strong>of</strong> this “desegregation” is merely attributable to the simple decline in the<br />
number and proportion <strong>of</strong> Whites in the county (from 81% in 1960 to 32% in<br />
<strong>2000</strong>). Indeed, all four principal racial groups (Whites, Blacks, Hispanics, and<br />
Asians) were less likely to have White neighbors.<br />
• While the Index <strong>of</strong> Diversity has steadily increased for the entire <strong>Los</strong> <strong>Angeles</strong><br />
<strong>County</strong>, the Index <strong>of</strong> Dissimilarity (the standard measure <strong>of</strong> segregation), has<br />
remained constant for Whites since 1970, at exactly 57.<br />
• If Whites have any neighbors <strong>of</strong> color, they are most likely in <strong>2000</strong> to be Hispanic<br />
(25% probability). Twenty-five percent is the greatest chance Whites have ever<br />
faced <strong>of</strong> having a nonwhite neighbor. Whites had very little likelihood <strong>of</strong> having<br />
a Black or Asian neighbor through 1970 (no greater than 2%), but this likelihood<br />
increased only slightly by <strong>2000</strong>. Whites have a 14% probability <strong>of</strong> having an<br />
Asian neighbor; they still have only a 5% probability <strong>of</strong> having a Black neighbor.<br />
• Thus, from a White perspective, sharing neighborhoods with persons <strong>of</strong> color has<br />
only advanced for the two groups whose population explosion since 1960 has<br />
virtually forced this sharing.<br />
• As a rule, Whites have resegregated themselves as the county as a whole has<br />
become hugely diverse. Simply by being outnumbered, the White population<br />
only seems less spatially exclusive on the face <strong>of</strong> certain indices. Examination <strong>of</strong><br />
maps shows that the White population has retreated to the suburban fringe <strong>of</strong> the<br />
metropolis, barricaded now behind the highest property values.<br />
BLACKS<br />
• Blacks have seen a very different transformation than Whites. <strong>The</strong> probability<br />
that blacks would have White neighbors actually fell steeply from <strong>1940</strong> through<br />
1970, from 45% to 15%, and has stayed virtually constant ever since (hovering<br />
between 17% and 18%. Blacks have far fewer White neighbors than they did two<br />
generations ago, and no progress has been made since the nadir <strong>of</strong> the “urban<br />
crisis” in 1970. Blacks have a slightly greater chance <strong>of</strong> having Asian neighbors<br />
since 1970, but this figure is still only 9% in <strong>2000</strong>. Most striking is that Blacks<br />
are far more likely to have Hispanic neighbors. This probability shot up from<br />
11% in 1970 to 41% in <strong>2000</strong>. Like Whites, Blacks have been less and less likely<br />
Race Contours <strong>2000</strong> –<strong>Resegregation</strong> <strong>of</strong> <strong>Los</strong> <strong>Angeles</strong> <strong>County</strong>, <strong>1940</strong>-<strong>2000</strong> 8
to have members <strong>of</strong> their own race as neighbors (since 1970), but the probability<br />
that any other group would have Blacks as neighbors has stayed virtually constant<br />
at less than 10% since <strong>1940</strong> (except for three decades, 1950-1970, when Asians<br />
were slightly more likely to have Black neighbors).<br />
• Blacks remain the most segregated racial group in <strong>Los</strong> <strong>Angeles</strong> <strong>County</strong>, by any<br />
measure. Like Whites, the movement <strong>of</strong> Blacks displays a “retreat” pattern in the<br />
face <strong>of</strong> growing Hispanic and Asian populations. Moreover, the compactness <strong>of</strong><br />
the Black population seems to be reinforced by the voluntary self-segregation <strong>of</strong><br />
affluent Blacks, who may choose not to assert their relatively greater freedom to<br />
settle in non-Black neighborhoods since the Civil Rights movement.<br />
ASIANS AND HISPANICS<br />
• Asians and Hispanics, as “new immigrants” both differ from the experience <strong>of</strong><br />
Whites and Blacks, who are best classified as “old immigrants.” Both <strong>of</strong> these<br />
groups have been less and less likely to have White neighbors, and more likely to<br />
have only members <strong>of</strong> their own racial group as neighbors. But neither Asians<br />
nor Hispanics are more likely to have Blacks as neighbors. Asians had a 16%<br />
chance <strong>of</strong> having a Black neighbor in 1960, but only a 4% probability <strong>of</strong> that now.<br />
For Hispanics, the figure has simply remained consistently low, ranging between<br />
5% and 9% since <strong>1940</strong>.<br />
• Both Hispanics and Asians are in a classic clustering enclave phase <strong>of</strong><br />
immigration, but unlike historic waves <strong>of</strong> European immigrants, their enclaves are<br />
highly dispersed, and this sets the stage <strong>of</strong> much lower rates <strong>of</strong> segregation in the<br />
future.<br />
Race Contours <strong>2000</strong> –<strong>Resegregation</strong> <strong>of</strong> <strong>Los</strong> <strong>Angeles</strong> <strong>County</strong>, <strong>1940</strong>-<strong>2000</strong> 9
4.0 DETAILED FINDINGS<br />
10,000,000<br />
9,000,000<br />
8,000,000<br />
7,000,000<br />
6,000,000<br />
5,000,000<br />
4,000,000<br />
3,000,000<br />
2,000,000<br />
1,000,000<br />
0<br />
CHART 1: OVERALL POPULATION FIGURES<br />
Total and Proportional <strong>Racial</strong> Population <strong>of</strong> <strong>Los</strong> <strong>Angeles</strong> <strong>County</strong>, <strong>1940</strong>-<strong>2000</strong><br />
1.9%<br />
2.2%<br />
2.7%<br />
93.3%<br />
5.8%<br />
1.3%<br />
5.0%<br />
87.9%<br />
2.0%<br />
9.6%<br />
7.6%<br />
80.8%<br />
19 4 0 19 50 19 6 0 19 70 19 8 0 19 9 0 2 0 0 0<br />
Asian 52,911 57,582 123,638 201,704 536,241 963,642 1,308,766<br />
Hispanic 61,248 249,173 582,309 1,288,716 2,071,530 3,359,526 4,242,213<br />
Black 75,206 214,897 459,806 755,719 924,774 931,449 924,518<br />
White 2,620,450 3,796,190 4,897,580 4,798,872 3,977,480 3,647,555 3,043,840<br />
Chart 1, “Total and Proportional <strong>Racial</strong> Population <strong>of</strong> <strong>Los</strong> <strong>Angeles</strong> <strong>County</strong>, <strong>1940</strong>-<br />
<strong>2000</strong>,” displays the total population, total subgroup population, and proportional share <strong>of</strong><br />
each population in percentages, from <strong>1940</strong> to <strong>2000</strong>.<br />
Race Contours <strong>2000</strong> –<strong>Resegregation</strong> <strong>of</strong> <strong>Los</strong> <strong>Angeles</strong> <strong>County</strong>, <strong>1940</strong>-<strong>2000</strong> 10<br />
Asian<br />
Hispanic<br />
While the most obvious fact about the county is its great diversity, notice also that even by<br />
1980, a most important feature <strong>of</strong> the overall patterns is that Whites reached the apogee <strong>of</strong><br />
their population size as early as 1960, and have been declining in absolute numbers ever<br />
since.<br />
<strong>The</strong> Black population peaked in 1990, but has remained almost constant since 1980, at just<br />
under one million persons.<br />
Indeed, despite spectacular growth <strong>of</strong> the <strong>Los</strong> Angels metropolis since <strong>1940</strong>, Whites in <strong>2000</strong><br />
are only slightly more numerous than they were in before the Second World War.<br />
In other words, the growth <strong>of</strong> <strong>Los</strong> <strong>Angeles</strong> <strong>County</strong> since 1960 is almost entirely the work <strong>of</strong><br />
non-White and non-Black groups.<br />
2.9%<br />
18.3%<br />
10.7%<br />
68.2%<br />
7.1%<br />
27.6%<br />
12.3%<br />
53.0%<br />
10.8%<br />
37.7%<br />
10.5%<br />
41.0%<br />
13.7%<br />
44.6%<br />
9.7%<br />
32.0%<br />
Black<br />
White
0.9<br />
0.8<br />
0.7<br />
0.6<br />
0.5<br />
0.4<br />
0.3<br />
0.2<br />
0.1<br />
0<br />
CHART 2: DIVERSITY INDEX<br />
Diversity Index: <strong>Los</strong> <strong>Angeles</strong> <strong>County</strong>, <strong>1940</strong>-<strong>2000</strong><br />
<strong>1940</strong> 1950 1960 1970 1980 1990 <strong>2000</strong><br />
Diversity Index 0.22 0.23 0.38 0.54 0.73 0.82 0.84<br />
Diversity Index<br />
Chart 2: “Diversity Index: <strong>Los</strong> <strong>Angeles</strong> <strong>County</strong>, <strong>1940</strong>-<strong>2000</strong>,” is a very important<br />
measure <strong>of</strong> the increasing balance <strong>of</strong> the <strong>County</strong>’s four principal racial groups since <strong>1940</strong>.<br />
In 1990, it was not clear if the Diversity Index was beginning to flatten-out, but the <strong>2000</strong><br />
data clearly show that it is. <strong>Los</strong> <strong>Angeles</strong> <strong>County</strong> may be stabilizing in the extent <strong>of</strong> its<br />
diversity.<br />
This graph <strong>of</strong> the sharply increasing Diversity Index can be very misleading, however. It<br />
seems to suggest that the Metropolis is becoming a multiracial borderland, wherein the<br />
races mix freely. Such is not at all the case, as the following Charts will make clear.<br />
Race Contours <strong>2000</strong> –<strong>Resegregation</strong> <strong>of</strong> <strong>Los</strong> <strong>Angeles</strong> <strong>County</strong>, <strong>1940</strong>-<strong>2000</strong> 11
1<br />
0.9<br />
0.8<br />
0.7<br />
0.6<br />
0.5<br />
0.4<br />
0.3<br />
0.2<br />
0.1<br />
0<br />
CHART 3: INDEX OF DISSIMILARITY<br />
Index <strong>of</strong> Dissimilarity for Whites, Blacks, Hispanics and Asians<br />
in <strong>Los</strong> <strong>Angeles</strong> <strong>County</strong>, <strong>1940</strong>-<strong>2000</strong><br />
<strong>1940</strong> 1950 1960 1970 1980 1990 <strong>2000</strong><br />
Blacks 0.82 0.82 0.88 0.88 0.76 0.64 0.57<br />
Whites 0.62 0.71 0.64 0.57 0.57 0.57 0.56<br />
Asians 0.57 0.7 0.5 0.44 0.51 0.5 0.51<br />
Hispanics 0.58 0.85 0.56 0.48 0.36 0.41 0.43<br />
Chart 3: “Index <strong>of</strong> Dissimilarity for Whites, Blacks, Hispanics and Asians<br />
in <strong>Los</strong> <strong>Angeles</strong> <strong>County</strong>, <strong>1940</strong>-<strong>2000</strong>,” displays the most commonly used measure <strong>of</strong> “segregation” in<br />
American social science since the 1950s. Based always on a comparison <strong>of</strong> two groups (eg, White vs.<br />
Nonwhites, Blacks vs. Nonblacks), this measure is very easy to interpret. <strong>The</strong> Index <strong>of</strong> Dissimilarity<br />
or “ID” ranges from 0 to 1, and tells us the percentage <strong>of</strong> a given population that would have to<br />
change its residential location in order to even-out the distribution <strong>of</strong> that groups across the<br />
metropolitan space. If Blacks were evenly settled across the entire county, for example, their ID<br />
would be 0 (perfectly integrated). If Blacks only lived in census tracts that were 100% Black, and no<br />
where else, then their ID score would be 1 (perfectly segregated).<br />
Scores <strong>of</strong> 70% or higher are considered to show serious segregation. Blacks in U.S. cities have<br />
shown scores higher than this figure since the Second World War, and yet in many western cities this<br />
figure has come down significantly. Here in <strong>Los</strong> <strong>Angeles</strong> the ID for Blacks has decreased<br />
significantly from the very high 88% in 1960 and 1970 to the relatively moderate 57% in <strong>2000</strong>.<br />
Just as remarkable, however, is how little the ID for Whites has changed: almost not at all since 1960.<br />
<strong>The</strong> figure has remained frozen at 57 or 56 since 1970, which is precisely the same in <strong>2000</strong> as the ID<br />
for Blacks. In other words, the ID also shows us that Whites and Blacks are equally segregated, and<br />
that most members <strong>of</strong> each group would need to move to achieve integration.<br />
<strong>The</strong> ID scores for Hispanics and Asians are also significant. Hispanics are the least segregated racial<br />
group by this measure. Less than half <strong>of</strong> all Hispanics would need to move in order to achieve full<br />
spatial integration. <strong>The</strong>ir score fell from 1950 to 1980, but is clearly on the rise again.<br />
Asians are only moderately segregated, and have remained at the same level <strong>of</strong> segregations by the ID<br />
measure since 1980. About half would need to move to even out the spatial distribution in the county.<br />
Race Contours <strong>2000</strong> –<strong>Resegregation</strong> <strong>of</strong> <strong>Los</strong> <strong>Angeles</strong> <strong>County</strong>, <strong>1940</strong>-<strong>2000</strong> 12<br />
Blacks<br />
Whites<br />
Asians<br />
Hispanics
1.0 0<br />
0.90<br />
0.80<br />
0.70<br />
0.60<br />
0.50<br />
0.40<br />
0.30<br />
0.20<br />
0.10<br />
0.00<br />
CHART 4a: WHITE NEIGHBORS<br />
Probability that Whites, Blacks, Hispanics, and Asians<br />
in <strong>Los</strong> <strong>Angeles</strong> <strong>County</strong> w ill have White Neighbors, <strong>1940</strong>-<strong>2000</strong><br />
19 4 0 19 50 19 6 0 19 70 19 8 0 19 9 0 2 0 0 0<br />
Whites with Whites 0.95 0.94 0.90 0.81 0.72 0.64 0.57<br />
Asians wit h Whites 0.77 0.63 0.57 0.53 0.49 0.39 0.23<br />
Hispanics with Whites 0.82 0.55 0.58 0.52 0.34 0.23 0.18<br />
Blacks with Whites 0.45 0.32 0.22 0.15 0.17 0.18 0.17<br />
Chart 4a, “Probability that Whites, Blacks, Hispanics, and Asians in <strong>Los</strong> <strong>Angeles</strong> <strong>County</strong> will<br />
have White Neighbors, <strong>1940</strong>-<strong>2000</strong>,” uses a much more powerful and revealing measure or<br />
segregation than the Index <strong>of</strong> Dissimilarity. <strong>The</strong> measure used in Charts 4a through 7b is the<br />
“Exposure Index,” which measures the probability that members <strong>of</strong> one group will have neighbors <strong>of</strong><br />
any other group. It ranges from 0 to 1. Unlike the relatively crude Index <strong>of</strong> Dissimilarity, the<br />
Exposure Index takes into account the relative size <strong>of</strong> different groups, and is capable <strong>of</strong> measuring<br />
the segregation conditions between multiple racial groups simultaneously. In order to make these<br />
patterns as clear as possible, we present them in pairs, each pair exploring the experience <strong>of</strong> each <strong>of</strong><br />
the four principal racial groups.<br />
Chart 4a tells us the probability that Whites, Blacks, Hispanics and Asians will have White neighbors.<br />
<strong>The</strong> probability that Whites will have white neighbors is a measure <strong>of</strong> their “isolation,” and we see<br />
here that Whites have become less and less likely to have White neighbors. On the face <strong>of</strong> it, this<br />
seems like clear evidence <strong>of</strong> desegregation. But that is not the case. Notice that all racial groups have<br />
been less and less likely to have White neighbors since <strong>1940</strong>! Indeed, Asians, Hispanics and Blacks in<br />
<strong>2000</strong> had less than a 24% chance <strong>of</strong> sharing their neighborhoods with Whites.<br />
Blacks have been no more likely to have White neighbors in all the years since 1960.<br />
Whites with Whites<br />
Asians with Whit es<br />
Hispanics with Whites<br />
Blacks with Whites<br />
<strong>The</strong> simple fact explaining the patterns in Chart 4a is that Whites are only seeming to be less<br />
isolated because they are grossly outnumbered, and some greater level <strong>of</strong> “exposure” to other<br />
racial groups is inevitable as the length <strong>of</strong> the perimeter, or circumference, around the<br />
segregated core <strong>of</strong> the metropolis continues to grow. Chart 4b will better clarify this<br />
situation.<br />
Race Contours <strong>2000</strong> –<strong>Resegregation</strong> <strong>of</strong> <strong>Los</strong> <strong>Angeles</strong> <strong>County</strong>, <strong>1940</strong>-<strong>2000</strong> 13
Chart 4b: WHITE SETTLERS<br />
Probability that Whites w ill have Black, Hispanic, or Asian Neighbors<br />
in <strong>Los</strong> <strong>Angeles</strong> <strong>County</strong>, <strong>1940</strong>-<strong>2000</strong><br />
0.30<br />
0.25<br />
0.20<br />
0.15<br />
0.10<br />
0.05<br />
0.00<br />
<strong>1940</strong> 1950 1960 1970 1980 1990 <strong>2000</strong><br />
Whites w ith Hispanics 0.02 0.04 0.07 0.14 0.18 0.22 0.25<br />
Whites w ith Asians 0.01 0.01 0.01 0.02 0.07 0.1 0.14<br />
Whites w ith Blacks 0.01 0.02 0.02 0.02 0.04 0.05 0.05<br />
Whites w ith Hispanics<br />
Whites w ith Asians<br />
Whites w ith Blacks<br />
Chart 4b, “Probability that Whites will have Black, Hispanic, or Asian Neighbors<br />
in <strong>Los</strong> <strong>Angeles</strong> <strong>County</strong>, <strong>1940</strong>-<strong>2000</strong>,” looks at the White residential experience from the other direction as that<br />
shown in 4a. <strong>The</strong> Exposure Index is “asymmetric,” which means that we can see the segregation relation from<br />
two different perspectives for each pair <strong>of</strong> racial groups. Since the groups are all very different in size and<br />
location, these figures are not simple the inverse, but reveal the less obvious conditions <strong>of</strong> segregation that are<br />
a function <strong>of</strong> location. Thus, for example, looking back at Chart 4a, we see that Blacks had a 45% chance <strong>of</strong><br />
having White neighbors in <strong>1940</strong>, but here in Chart 4b we see that Whites in that same year had only a 1%<br />
chance <strong>of</strong> having a Black neighbor. This asymmetry can easily be explained by the fact that Blacks were<br />
vastly outnumbered in <strong>1940</strong>, and because most Black neighborhoods had significant White populations as well<br />
(which is no longer the case: Whites have almost completely removed themselves from Black neighborhoods).<br />
<strong>The</strong> hard fact is that this severe level <strong>of</strong> segregation has not changed significantly in 60 years <strong>of</strong> struggles<br />
against the White-Black divide. White families in <strong>Los</strong> <strong>Angeles</strong> <strong>County</strong> in <strong>2000</strong> still had only a 5% chance <strong>of</strong><br />
sharing their neighborhood with African American families.<br />
Whites are significantly more likely to have Hispanic neighbors, 25% in <strong>2000</strong> compared with 14% in 1970.<br />
But again, this figure is easy to explain by rapid increase in the Hispanic population and the steady decrease <strong>of</strong><br />
the White population. <strong>The</strong> Hispanic population has grown around many clusters <strong>of</strong> settlement in the <strong>County</strong>,<br />
and so the “edges” between Hispanic and White areas have grown in length, making increasing “exposure”<br />
more likely. To put this figure in perspective, we must again refer back to Chart 4a: Hispanics are less likely<br />
to have Whites as neighbors (18%), and this figure has been steadily declining.<br />
Whites are only in the year <strong>2000</strong> significantly likely to have Asian neighbors (14%), but again, Chart 4a<br />
shows that as Asians grow in population size, they are less likely to have White neighbors (down to 23% in<br />
<strong>2000</strong> from 49% in 1980).<br />
Race Contours <strong>2000</strong> –<strong>Resegregation</strong> <strong>of</strong> <strong>Los</strong> <strong>Angeles</strong> <strong>County</strong>, <strong>1940</strong>-<strong>2000</strong> 14
0.80<br />
0.70<br />
0.60<br />
0.50<br />
0.40<br />
0.30<br />
0.20<br />
0.10<br />
0.00<br />
Chart 5a: BLACK NEIGHBORS<br />
Probability that Blacks, Whites, Hispanics, and Asians<br />
will have Black Neighbors in <strong>Los</strong> <strong>Angeles</strong> <strong>County</strong>, <strong>1940</strong>-<strong>2000</strong><br />
<strong>1940</strong> 1950 1960 1970 1980 1990 <strong>2000</strong><br />
Blacks with Blacks 0.46 0.55 0.64 0.72 0.60 0.42 0.34<br />
Hispanics with Blacks 0.05 0.08 0.08 0.06 0.08 0.09 0.09<br />
Asians wit h Blacks 0.06 0.14 0.16 0.11 0.08 0.06 0.04<br />
Whit es wit h Blacks 0.01 0.02 0.02 0.02 0.04 0.05 0.05<br />
Blacks with Blacks<br />
Hispanics with Blacks<br />
Asians with Blacks<br />
Whites wit h Blacks<br />
Chart 5a, “Probability that Blacks, Whites, Hispanics, and Asians will have Black<br />
Neighbors in <strong>Los</strong> <strong>Angeles</strong> <strong>County</strong>, <strong>1940</strong>-<strong>2000</strong>,” Shows first <strong>of</strong> all that Whites,<br />
Hispanics, and Asians are very unlikely to have Black neighbors in <strong>2000</strong>. Indeed, Whites<br />
and Hispanics are no more likely to have Black neighbors than they were in <strong>1940</strong> (or<br />
insignificantly so).<br />
<strong>The</strong> second most striking pattern in Chart 5a is that Blacks become increasingly isolated<br />
from other groups (more likely to have only other Blacks as neighbors), from <strong>1940</strong> though<br />
1970, and then that trend reverses. In 1970, Blacks had a 72% <strong>of</strong> having black neighbors,<br />
but by <strong>2000</strong>, Blacks had only a 34% chance <strong>of</strong> having a Black neighbor.<br />
How is this second finding consistent with the first finding: that other groups re very<br />
unlikely to have Black neighbors? Looking at Chart 5b explains what is happening.<br />
Race Contours <strong>2000</strong> –<strong>Resegregation</strong> <strong>of</strong> <strong>Los</strong> <strong>Angeles</strong> <strong>County</strong>, <strong>1940</strong>-<strong>2000</strong> 15
Chart 5b BLACK SETTLERS<br />
Probability that Blacks will have White, Hispanic, or Asian Neighbors<br />
in <strong>Los</strong> <strong>Angeles</strong> <strong>County</strong>, <strong>1940</strong>-<strong>2000</strong><br />
0.50<br />
0.45<br />
0.40<br />
0.35<br />
0.30<br />
0.25<br />
0.20<br />
0.15<br />
0.10<br />
0.05<br />
0.00<br />
19 4 0 19 50 19 6 0 19 70 19 8 0 19 9 0 2 0 0 0<br />
Blacks with Whites 0.45 0.32 0.22 0.15 0.17 0.18 0.17<br />
Blacks with Hispanics 0.04 0.09 0.10 0.11 0.19 0.34 0.41<br />
Blacks with Asians 0.04 0.04 0.04 0.03 0.04 0.06 0.09<br />
Blacks with Whites<br />
Blacks with Hispanics<br />
Blacks with Asians<br />
Chart 5b, “Probability that Blacks will have White, Hispanic, or Asian Neighbors<br />
in <strong>Los</strong> <strong>Angeles</strong> <strong>County</strong>, <strong>1940</strong>-<strong>2000</strong>,” shows that the reason for Blacks’ decreasing<br />
isolation is an increased sharing <strong>of</strong> neighborhood space with Hispanics, the most dynamic<br />
and rapidly expanding racial group in the metropolis.<br />
Blacks are no more likely to have Whites as neighbors than they were at the peak <strong>of</strong> their<br />
isolation, in 1970. This probability has<br />
And Blacks are still quite unlikely to have Asian neighbors, a rate which has increased<br />
from a mere 4% from <strong>1940</strong> through 1980 to 9% in <strong>2000</strong>.<br />
This chart points up the very serious question <strong>of</strong> Black-Hispanic territorial transitions.<br />
<strong>The</strong> time-series maps show high levels <strong>of</strong> displacement <strong>of</strong> Blacks by Hispanics since the<br />
1960s.<br />
Race Contours <strong>2000</strong> –<strong>Resegregation</strong> <strong>of</strong> <strong>Los</strong> <strong>Angeles</strong> <strong>County</strong>, <strong>1940</strong>-<strong>2000</strong> 16
0.70<br />
0.60<br />
0.50<br />
0.40<br />
0.30<br />
0.20<br />
0.10<br />
0.00<br />
Charts 6a HISPANIC NEIGHBORS<br />
Probability that Hispanics, Blacks, Whites, and Asians<br />
will have Hispanic Neighbors in <strong>Los</strong> <strong>Angeles</strong> <strong>County</strong>, <strong>1940</strong>-<strong>2000</strong><br />
<strong>1940</strong> 1950 1960 1970 1980 1990 <strong>2000</strong><br />
Hispanics with Hispanics 0.09 0.34 0.31 0.38 0.50 0.58 0.63<br />
Blacks with Hispanics 0.04 0.09 0.10 0.11 0.19 0.34 0.41<br />
Asians with Hispanics 0.05 0.15 0.16 0.24 0.27 0.32 0.24<br />
Whites with Hispanics 0.02 0.04 0.07 0.14 0.18 0.22 0.25<br />
Hispanics with Hispanics<br />
Blacks with Hispanics<br />
Asians with Hispanics<br />
Whites with Hispanics<br />
Chart 6a, “Probability that Hispanics, Blacks, Whites, and Asians will have Hispanic<br />
Neighbors in <strong>Los</strong> <strong>Angeles</strong> <strong>County</strong>, <strong>1940</strong>-<strong>2000</strong>,” shows first <strong>of</strong> all that all groups have<br />
been increasingly likely to have Hispanic neighbors since <strong>1940</strong>.<br />
<strong>The</strong> most dramatic increase has been in the isolation <strong>of</strong> Hispanics. By <strong>2000</strong> Hispanics were<br />
63% likely to have only other Hispanic neighbors.<br />
Next most dramatic has been the increase in likelihood that Blacks will have Hispanic<br />
neighbors, a pattern we already explored in Table 5b. However, here we can see that<br />
Blacks have increased their exposure to Hispanics at a higher rate and at greater levels that<br />
either Whites or Asians.<br />
Whites and Asians have the lowest probability <strong>of</strong> sharing neighborhoods with Hispanics,<br />
and the score for Asians has actually decreased since 1990, from 32% to 24%.<br />
Bear in mind, however, that the “Hispanic Neighbors” perspective is looking at Hispanics<br />
from the outside in. Table 6b shows what Hispanics see from the inside <strong>of</strong> their<br />
community looking out at Whites, Blacks, and Asians. <strong>The</strong> story is very different.<br />
Race Contours <strong>2000</strong> –<strong>Resegregation</strong> <strong>of</strong> <strong>Los</strong> <strong>Angeles</strong> <strong>County</strong>, <strong>1940</strong>-<strong>2000</strong> 17
0.90<br />
0.80<br />
0.70<br />
0.60<br />
0.50<br />
0.40<br />
0.30<br />
0.20<br />
0.10<br />
0.00<br />
Chart 6a HISPANIC SETTLERS<br />
Probability that Hispanics will have Black, White, or Asian<br />
Neighbors in <strong>Los</strong> <strong>Angeles</strong> <strong>County</strong>, <strong>1940</strong>-<strong>2000</strong><br />
<strong>1940</strong> 1950 1960 1970 1980 1990 <strong>2000</strong><br />
Hispanics wit h Whit es 0.82 0.55 0.58 0.52 0.34 0.23 0.18<br />
Hispanics wit h Blacks 0.05 0.08 0.08 0.06 0.08 0.09 0.09<br />
Hispanics wit h Asians 0.04 0.03 0.03 0.04 0.07 0.09 0.10<br />
Hispanics wit h Whit es<br />
Hispanics wit h Blacks<br />
Hispanics wit h Asians<br />
Table 6b, “Probability that Hispanics will have Black, White, or Asian Neighbors in<br />
<strong>Los</strong> <strong>Angeles</strong> <strong>County</strong>, <strong>1940</strong>-<strong>2000</strong>,” tells a very striking story. Hispanics are increasingly<br />
unlikely to have non-Hispanic neighbors.<br />
<strong>The</strong> steepest decline has been in the chances Hispanics have <strong>of</strong> sharing neighborhoods with<br />
Whites. This was a very high 82% in <strong>1940</strong> and has plummeted ever since, to only 18% in<br />
<strong>2000</strong>.<br />
Just as striking is that Hispanics have never had much exposure to Blacks or Asians as<br />
neighbors. <strong>The</strong>se figures have remained almost flat at less than 10% since <strong>1940</strong>.<br />
Race Contours <strong>2000</strong> –<strong>Resegregation</strong> <strong>of</strong> <strong>Los</strong> <strong>Angeles</strong> <strong>County</strong>, <strong>1940</strong>-<strong>2000</strong> 18
0.25<br />
0.20<br />
0.15<br />
0.10<br />
0.05<br />
0.00<br />
Chart 7a: ASIAN NEIGHBORS<br />
Probability that Asians, Blacks, Whites, and Hispanics<br />
will have Asian Neighbors in <strong>Los</strong> <strong>Angeles</strong> <strong>County</strong>, <strong>1940</strong>-<strong>2000</strong><br />
19 4 0 19 50 19 6 0 19 70 19 8 0 19 9 0 2 0 0 0<br />
Asians wit h Asians 0.12 0.07 0.11 0.12 0.15 0.22 0.20<br />
Whit es wit h Asians 0.01 0.01 0.01 0.02 0.07 0.1 0.14<br />
Hispanics with Asians 0.04 0.03 0.03 0.04 0.07 0.09 0.10<br />
Blacks with Asians 0.04 0.04 0.04 0.03 0.04 0.06 0.09<br />
Asians with Asians<br />
Whites wit h Asians<br />
Hispanics wit h Asians<br />
Blacks with Asians<br />
Chart 7a, “Probability that Asians, Blacks, Whites, and Hispanics will have Asian<br />
Neighbors in <strong>Los</strong> <strong>Angeles</strong> <strong>County</strong>, <strong>1940</strong>-<strong>2000</strong>,” shows modest increases that all groups will<br />
have Asian neighbors—but most <strong>of</strong> all that Asians are more likely to have Asian neighbors.<br />
Even so , it is very important to note that the rates a quite low. This chart is scaled to reach its<br />
maximum at 25%, so the values in it a quite small despite the visual effect <strong>of</strong> the rising lines.<br />
<strong>The</strong> bottom line is that Whites, Blacks, and Asians in <strong>2000</strong> still had no more than a 14%<br />
chance <strong>of</strong> having an Asian neighbor.<br />
<strong>The</strong> Asian population has bee rising more slowly than the Hispanic, to compare the two main<br />
immigrant groups, but its volume has now surpassed the one million mark, so we would<br />
expect that the non-Asian groups will be more likely to have Asian neighbors. <strong>The</strong> relatively<br />
low figures here, however, suggest that Asians are settling in clustered enclaves, a prediction<br />
supported by the companion Table 7b.<br />
Race Contours <strong>2000</strong> –<strong>Resegregation</strong> <strong>of</strong> <strong>Los</strong> <strong>Angeles</strong> <strong>County</strong>, <strong>1940</strong>-<strong>2000</strong> 19
Chart 7a: ASIAN SETTLERS<br />
Probability that Asians will have White, Hispanic, or Black Neighbors<br />
in <strong>Los</strong> <strong>Angeles</strong> <strong>County</strong>, <strong>1940</strong>-<strong>2000</strong><br />
0.90<br />
0.80<br />
0.70<br />
0.60<br />
0.50<br />
0.40<br />
0.30<br />
0.20<br />
0.10<br />
0.00<br />
19 4 0 19 50 19 6 0 19 70 19 8 0 19 9 0 2 0 0 0<br />
Asians with Whites 0.77 0.63 0.57 0.53 0.49 0.39 0.23<br />
Asians wit h Hispanics 0.05 0.15 0.16 0.24 0.27 0.32 0.24<br />
Asians with Blacks 0.06 0.14 0.16 0.11 0.08 0.06 0.04<br />
Asians with Whites<br />
Asians with Hispanics<br />
Asians with Blacks<br />
Chart 7b, “Probability that Asians will have White, Hispanic, or Black Neighbors<br />
in <strong>Los</strong> <strong>Angeles</strong> <strong>County</strong>, <strong>1940</strong>-<strong>2000</strong>” reinforces all the trends we have seen in the<br />
previous tables.<br />
Asians are less and less likely to have White neighbors. This figure has dropped from<br />
77% in <strong>1940</strong> to 39% in 1990 and 23% in <strong>2000</strong>.<br />
Asians were increasingly likely to have Hispanic neighbors until 1990, but this figure had<br />
begun to drop as well, to 24%.<br />
Asians were never very likely to have Black neighbors, and this has steadily decreased<br />
since 1960, to a mere 4% in <strong>2000</strong>.<br />
Race Contours <strong>2000</strong> –<strong>Resegregation</strong> <strong>of</strong> <strong>Los</strong> <strong>Angeles</strong> <strong>County</strong>, <strong>1940</strong>-<strong>2000</strong> 20
Race Contours <strong>2000</strong> –<strong>Resegregation</strong> <strong>of</strong> <strong>Los</strong> <strong>Angeles</strong> <strong>County</strong>, <strong>1940</strong>-<strong>2000</strong> 21
Bibliography: Works Cited<br />
Ethington, Philip J. <strong>2000</strong>. "Segregated Diversity: Race-Ethnicity, Space, and Political<br />
Fragmentation in <strong>Los</strong> <strong>Angeles</strong> <strong>County</strong>, <strong>1940</strong>-1994," Final Report submitted to the John<br />
Randolph Haynes and Dora Haynes Foundation (20 July <strong>2000</strong>).<br />
http://www.usc.edu/dept/LAS/history/historylab/Haynes_FR/index.html<br />
Frey, William H., and Ethington, Philip J. 2001. “Diversity and Segregation <strong>of</strong><br />
Municipal Places in <strong>Los</strong> <strong>Angeles</strong> <strong>County</strong>, 1990-<strong>2000</strong>” Race Contours <strong>2000</strong> Project,<br />
Public Research Report 2001-06<br />
[http://www.usc.edu/schools/sppd/research/race_census/research_reports/research_reports.htm]<br />
Lieberson, Stanley 1981 “An Asymmetrical Approach to Segregation,” in Ethnic<br />
Segregation in Cities, edited by Ceri Peach, Vaughn Robinson an Susan Smith (Athens,<br />
GA: <strong>The</strong> University <strong>of</strong> Georgia Press, 1981): 61-82.<br />
Massey, Douglas S. and Denton, Nancy A. 1988 “<strong>The</strong> Dimensions <strong>of</strong> Residential<br />
Segregation,” Social Forces 67:2 (December): 281-315.<br />
Myers, Dowell and James, Angela 2001 “Overlap: A User Guide to Race and<br />
Hispanic Origin in Census <strong>2000</strong>," Race Contours <strong>2000</strong> Project, Public Research Report<br />
2001-01 [http://www.usc.edu/schools/sppd/research/race_census/research_reports/research_reports.htm]<br />
Myers, Dowell, and Park, Julie. 2001 “<strong>Racial</strong>ly Balanced Cities in Southern California,<br />
1980-<strong>2000</strong>.” Race Contours <strong>2000</strong> Project, Public Research Report 2001-05<br />
[http://www.usc.edu/schools/sppd/research/race_census/research_reports/research_reports.htm]<br />
White, Michael J. "<strong>The</strong> Measurement <strong>of</strong> Spatial Segregation," American Journal <strong>of</strong><br />
Sociology 88:5 (March 1983): 1008-1018.<br />
White, Michael J. “Segregation and Diversity Measures in Population Distribution,”<br />
Population Index. 52 (1986): 198-221.<br />
Race Contours <strong>2000</strong> –<strong>Resegregation</strong> <strong>of</strong> <strong>Los</strong> <strong>Angeles</strong> <strong>County</strong>, <strong>1940</strong>-<strong>2000</strong> 22