Ar–Ar dating of authigenic K-feldspar - University of Glasgow
Ar–Ar dating of authigenic K-feldspar - University of Glasgow
Ar–Ar dating of authigenic K-feldspar - University of Glasgow

You also want an ePaper? Increase the reach of your titles
YUMPU automatically turns print PDFs into web optimized ePapers that Google loves.
<strong>Ar–Ar</strong> <strong>dating</strong> <strong>of</strong> <strong>authigenic</strong> K-<strong>feldspar</strong>: Quantitative modelling<br />
<strong>of</strong> radiogenic argon-loss through subgrain boundary networks<br />
D.F. Mark a,b, *, S.P. Kelley c , M.R. Lee d , J. Parnell a , S.C. Sherlock c , D.J. Brown d<br />
a Department <strong>of</strong> Geology and Petroleum Geology, Meston Building, Meston Walk, <strong>University</strong> <strong>of</strong> Aberdeen, Aberdeen AB24 3UE, UK<br />
b NERC Argon Isotope Facility, Scottish Universities Environmental Research Centre, Rankine Avenue,<br />
Scottish Enterprise Technology Park, East Kilbride, G75 0QF Scotland, UK<br />
c Centre for Earth, Planetary, Space and Astronomical Research (CEPSAR), Department <strong>of</strong> Earth Sciences,<br />
Open <strong>University</strong>, Walton Hall, Milton, Keynes MK7 6AA, UK<br />
d Department <strong>of</strong> Geographical and Earth Sciences, <strong>University</strong> <strong>of</strong> <strong>Glasgow</strong>, Gregory Building, Lilybank Gardens, <strong>Glasgow</strong> G12 8QQ, UK<br />
Abstract<br />
Received 22 May 2007; accepted in revised form 25 March 2008; available online 8 April 2008<br />
We have analysed two distinct generations <strong>of</strong> <strong>authigenic</strong> K-<strong>feldspar</strong> in Fucoid Bed sandstones from An-t-Sron and Skiag<br />
Bridge, NW Highlands, Scotland, which have experienced post-growth heating to levels in excess <strong>of</strong> the predicted Ar-closure<br />
temperature. Authigenic K-<strong>feldspar</strong>s show microtextural similarities to patch perthites; that is subgrains separated by dislocation-rich<br />
boundary networks that potentially act as fast diffusion pathways for radiogenic argon.<br />
The two generations <strong>of</strong> <strong>authigenic</strong> K-<strong>feldspar</strong> in the Fucoid Bed sandstones can be distinguished by different microtextural<br />
zones, bulk mineral compositions, fluid-inclusion populations, and inferred temperatures and chemistries <strong>of</strong> parent fluids. Ar–<br />
Ar age data obtained using high-resolution ultraviolet laser ablation, show that the first cementing generation is Ordovician<br />
and the second cementing generation is Silurian.<br />
Modelling <strong>of</strong> Ar diffusion using subgrain size as the effective diffusion dimension and a simplified tectono–thermal thrust<br />
model assuming transient heating <strong>of</strong> the Fucoid Beds is inconsistent with observed data. Removal <strong>of</strong> heat from the thrust zone<br />
through rapid flushing <strong>of</strong> heated fluids rather than transient heating can be invoked to explain the observed <strong>Ar–Ar</strong> ages for<br />
both generations <strong>of</strong> cement. Alternatively, Ar-diffusion modelling using overgrowth thickness as the effective diffusion dimension<br />
instead <strong>of</strong> subgrain size also yields models that are consistent with both the Fucoid Bed palaeothermal maxima and determined<br />
<strong>Ar–Ar</strong> age ages for the two generations <strong>of</strong> K-<strong>feldspar</strong> cement. Based on this alternate explanation, we propose a<br />
theoretical microtextural model that highlights fundamental differences between the microtextures <strong>of</strong> deuterically formed<br />
patch perthites and <strong>authigenic</strong> K-<strong>feldspar</strong>s, explaining the apparent robustness <strong>of</strong> <strong>authigenic</strong> K-<strong>feldspar</strong> with respect to<br />
Ar-retention.<br />
Ó 2008 Elsevier Ltd. All rights reserved.<br />
1.1. Alkali K-<strong>feldspar</strong><br />
1. INTRODUCTION<br />
The abundance <strong>of</strong> K-<strong>feldspar</strong> in igneous rocks and its<br />
occurrence as detrital and <strong>authigenic</strong> constituents in sedimentary<br />
rocks, has ensured its extensive use in <strong>Ar–Ar</strong> dat-<br />
* Corresponding author. Fax: +44 1355229898.<br />
E-mail address: d.mark@suerc.gla.ac.uk (D.F. Mark).<br />
Available online at www.sciencedirect.com<br />
Geochimica et Cosmochimica Acta 72 (2008) 2695–2710<br />
0016-7037/$ - see front matter Ó 2008 Elsevier Ltd. All rights reserved.<br />
doi:10.1016/j.gca.2008.03.018<br />
www.elsevier.com/locate/gca<br />
ing (McDougall and Harrison, 1999). Step-heating<br />
experiments (Burgess et al., 1992; Parsons, 1994) show that<br />
<strong>Ar–Ar</strong> dates obtained from plutonic and detrital K-<strong>feldspar</strong>s<br />
reflect the age <strong>of</strong> cooling below the Ar-closure temperature<br />
(T c). T c is simply one temperature range in a<br />
range <strong>of</strong> temperatures (a closure ‘interval’) in the cooling<br />
history <strong>of</strong> a rock that corresponds to its apparent age<br />
(Lee, 1995).<br />
Patch perthite microtextures are key indicators <strong>of</strong><br />
interaction <strong>of</strong> alkali <strong>feldspar</strong> with deuteric fluids and<br />
are characterised by mosaics <strong>of</strong> slightly misaligned
2696 D.F. Mark et al. / Geochimica et Cosmochimica Acta 72 (2008) 2695–2710<br />
submicron- to micron-sized incoherent subgrains with<br />
abundant dislocations along their boundaries and are also<br />
typically associated with micropores (Foland, 1994;<br />
Walker et al., 1995; Parsons and Lee, 2005; Fig. 1). Combined<br />
<strong>Ar–Ar</strong> geochronology and transmission electron<br />
microscope (TEM) studies suggest that Ar-loss from alkali<br />
<strong>feldspar</strong> is controlled directly by subgrain microtextures<br />
(Parsons, 1978; Worden et al., 1990; Burgess et al., 1992;<br />
Parsons and Lee, 2000; Lee and Parsons, 2003; Parsons<br />
and Lee, 2005).<br />
1.2. Authigenic K-<strong>feldspar</strong><br />
Although step-heating experiments originally designed<br />
to determine the age <strong>of</strong> <strong>authigenic</strong> K-<strong>feldspar</strong> overgrowths<br />
(Hearn and Sutter, 1985; Hearn et al., 1987; Girard<br />
et al., 1988; Spötl et al., 1996; Warnock and van de<br />
Kamp, 1999; Liu et al., 2003) have not directly enabled<br />
the distinction between detrital and <strong>authigenic</strong> generations,<br />
the data suggest that <strong>authigenic</strong> K-<strong>feldspar</strong> may record<br />
isotopic information relating to diagenetic events.<br />
The introduction <strong>of</strong> laserprobe isotope extraction techniques<br />
has <strong>of</strong>fered higher spatial resolution than conventional<br />
methods, permitting Ar-extraction from individual<br />
grains and potentially eliminating problems <strong>of</strong> contamination<br />
from detrital <strong>feldspar</strong>. Initial laserprobe studies<br />
used Ar-ion and infrared laser systems for analysis <strong>of</strong><br />
<strong>authigenic</strong> K-<strong>feldspar</strong> (Walgenwitz et al., 1990). Laser<br />
absorption by <strong>feldspar</strong> at such wavelengths is poor, however,<br />
and extensive heating occurred outside the site <strong>of</strong><br />
laser–mineral interaction, resulting not only in the extraction<br />
<strong>of</strong> Ar from the overgrowth, but also from the detrital<br />
grain and surrounding minerals. The ultraviolet (UV,<br />
266 nm) laserprobe (Kelley et al., 1994) has a higher spa-<br />
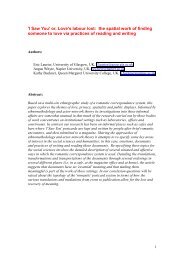
Fig. 1. Bright-field TEM image <strong>of</strong> alkali <strong>feldspar</strong> grain from the<br />
Lower Devonian Shap Granite. The image shows a vein <strong>of</strong> patch<br />
perthite cross-cutting otherwise pristine cryptoperthite. Albite<br />
exsolution lamellae in the cryptoperthite are oriented SE–NW in<br />
the image and close to ( 701) in the corresponding [01-1] SAED<br />
pattern. The patch perthite vein comprises a number <strong>of</strong> subgrains,<br />
giving the mottled contrast, and micropores <strong>of</strong> various sizes (white<br />
in the image). Scale bar 1 lm.<br />
tial resolution than the Ar-ion and infrared laser systems<br />
(UV laser can achieve a spot resolution <strong>of</strong> 12 lm) and<br />
the wavelengths are absorbed strongly by the <strong>feldspar</strong>.<br />
As a consequence the UV laser does not heat the sample<br />
beyond the point <strong>of</strong> laser–sample interaction and therefore<br />
only extracts Ar from the desired locations. Investigations<br />
<strong>dating</strong> K-<strong>feldspar</strong> overgrowths using the UV<br />
laserprobe have yielded meaningful <strong>Ar–Ar</strong> growth ages<br />
(Hagen et al., 2001; Mark et al., 2005, 2008; Sherlock<br />
et al., 2005).<br />
Authigenic K-<strong>feldspar</strong> overgrowths within sedimentary<br />
rocks from the Permo–Triassic <strong>of</strong> Elgin (Worden and<br />
Rushton, 1992), the Jurassic Humber Group <strong>of</strong> the North<br />
Sea (Lee and Parsons, 2003) and the Cretaceous Atlantic<br />
Margin Victory Formation (Mark et al., 2005), all show<br />
mineralogical and microtextural similarities. These overgrowths<br />
comprise mosaics <strong>of</strong> slightly misaligned submicron-<br />
to micron-sized subgrains, intercalated micropores,<br />
and nanometre growth bands orientated parallel to dislocation-rich<br />
subgrain boundaries. Overgrowths from Elgin and<br />
the Victory Formation have a regular subgrain size and<br />
well-developed crystal faces dominated by the {110} adularia<br />
habit. Subgrain boundaries <strong>of</strong> overgrowths from the<br />
Humber Group are slightly curved with the {110} adularia<br />
habit. Subgrain size also increases with distance from the<br />
detrital grain-overgrowth interface. The presence <strong>of</strong> illite<br />
along subgrain boundaries at interfaces was noted in two<br />
studies (Worden and Rushton, 1992; Lee and Parsons,<br />
2003).<br />
<strong>Ar–Ar</strong> <strong>dating</strong> <strong>of</strong> <strong>authigenic</strong> K-<strong>feldspar</strong> is contentious because<br />
subgrain microtextures are superficially similar to<br />
those <strong>of</strong> deuterically formed patch perthites (Lee and Parsons,<br />
2003) which quantitatively leak Ar at low temperatures<br />
(Burgess et al., 1992). However, because subgrains<br />
can be equated to spherical Ar-diffusion domains it is possible<br />
to model Ar-loss (Wheeler, 1996) by assuming that Ar<br />
diffuses out <strong>of</strong> the subgrains via lattice volume diffusion to<br />
an infinite zero concentration reservoir. The effective diffusion<br />
domain (sphere diameter) is directly related to Tc; the<br />
larger the diffusion domain the higher the T c (Dodson,<br />
1973). Therefore, the initial temperature <strong>of</strong> Ar-loss is related<br />
directly to the radius <strong>of</strong> the smallest subgrain (Lee<br />
and Parsons, 2003).<br />
Sherlock et al. (2005) modelled the thermal response <strong>of</strong><br />
<strong>authigenic</strong> K-<strong>feldspar</strong> to an episode <strong>of</strong> tectonically induced<br />
heating. Because TEM was not used to characterise<br />
microtextures, the model was generic and covered a wide<br />
range <strong>of</strong> subgrain sizes but demonstrated that <strong>authigenic</strong><br />
K-<strong>feldspar</strong> can potentially retain Ar. The first fully quantitative<br />
study <strong>of</strong> <strong>authigenic</strong> K-<strong>feldspar</strong> incorporating Ardiffusion<br />
modelling, <strong>Ar–Ar</strong> geochronology and TEM<br />
(Mark et al., 2005), modelled subgrain response in terms<br />
<strong>of</strong> Ar-loss against a thermal burial history that was reconstructed<br />
using apatite fission track analysis, fluid-inclusion<br />
microthermometry and vitrinite reflectance. The model<br />
showed that 3–5 lm subgrains exposed to a maximum<br />
temperature <strong>of</strong> 125 °C for 10 Ma, yielded meaningful<br />
<strong>Ar–Ar</strong> growth ages. Predicted closure temperature estimates<br />
for subgrains <strong>of</strong> such sizes range from 150 to<br />
175 °C (Foland, 1974, 1994).
Even though patch perthite and <strong>authigenic</strong> K-<strong>feldspar</strong><br />
microtextures are superficially similar, the microtextures<br />
are formed during different processes, fluid induced recrystallization<br />
and primary crystal growth. A potentially very<br />
important distinction. A key question which this study addresses<br />
is how do their Ar-diffusion properties compare?<br />
1.3. Study aims<br />
This study attempts to determine if Ar is quantitatively retained<br />
by <strong>authigenic</strong> K-<strong>feldspar</strong> overgrowths when exposed<br />
to temperatures in excess <strong>of</strong> predicted Tc determined from<br />
the calculations <strong>of</strong> Dodson (1973) and Foland (1974, 1994).<br />
<strong>Ar–Ar</strong> geochronology, TEM imaging and electron diffraction<br />
and Ar-diffusion modelling were employed to constrain<br />
the subgrain response <strong>of</strong> <strong>authigenic</strong> K-<strong>feldspar</strong> to temperatures<br />
in the order <strong>of</strong> 200 °C. A Focused Ion Beam (FIB) technique<br />
(Lee et al., 2003) was used to cut electron-transparent<br />
foils from precisely located areas <strong>of</strong> K-<strong>feldspar</strong> crystals within<br />
polished thin sections. Comparison <strong>of</strong> subgrain microtexture<br />
revealed by TEM with <strong>Ar–Ar</strong> data enabled the<br />
simulation <strong>of</strong> Ar-diffusion domains and subsequently, the<br />
data were modelled against a post-crystallisation, orogenesis-driven<br />
tectono–thermal episode, hence constraining the<br />
reliability <strong>of</strong> the <strong>Ar–Ar</strong> ages. Fine-grained sandstone samples<br />
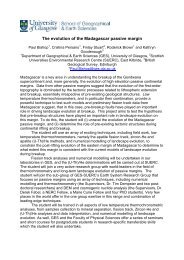
were collected from Fucoid Bed outcrops at An-t-Sron<br />
and Skiag Bridge, NW Highlands, two sites that are geographically<br />
30 km apart (Fig. 2). A documented enrichment<br />
<strong>of</strong> K-<strong>feldspar</strong>, up to 12 wt% K2O(Bowie et al., 1966) has been<br />
reported in the lower part <strong>of</strong> the Lower Cambrian An-t-Sron<br />
Formation (Fucoid Beds) thus providing an ideal geological<br />
context for assessing the retentiveness <strong>of</strong> <strong>authigenic</strong> K-<strong>feldspar</strong><br />
with respect to Ar.<br />
2. GEOLOGICAL SETTING<br />
The Fucoid Beds were deposited between 518 and<br />
510 Ma (Gradstein et al., 2004) on the Laurentian Plat-<br />
Subgrain microtextures and Ar diffusion 2697<br />
form, and consist <strong>of</strong> up to 27 m <strong>of</strong> siltstones with interbedded<br />
sandstones and dolostones. These rocks crop out along<br />
the Moine Thrust Zone and were a focus for deformation<br />
during closure <strong>of</strong> the Iapetus Ocean. The Moine Supergroup<br />
was thrust onto the Cambrian–Ordovician succession<br />
during the Scandian episode (435 to 420 Ma; Dewey,<br />
2005) <strong>of</strong> the Caledonian Orogeny (a continent–continent<br />
collision that produced a mountain range <strong>of</strong> similar scale<br />
to the active Himalayas; Johnson et al., 1985). Thrusting<br />
disturbed the geothermal gradient <strong>of</strong> this region and equilibrium<br />
was restored by conductive heat transport from<br />
the thrust sheet to the underlying Cambrian–Ordovician sequence<br />
(Oxburgh and Turcotte, 1974). It has been estimated<br />
from acritarch colouration index (Downie, 1982),<br />
fluid-inclusion studies (Baron et al., 2003; Mark et al.,<br />
2007) and illite crystallinity analyses (Johnson et al., 1985)<br />
that temperatures in the sampled sections <strong>of</strong> the Fucoid<br />
Beds reached a temperature <strong>of</strong> 200 °C, the sampled regions<br />
palaeothermal maxima.<br />
3. METHODS<br />
3.1. Excision <strong>of</strong> electron-transparent foils using the focussed ion<br />
beam technique<br />
Sites within the K-<strong>feldspar</strong> overgrowths to be sampled for TEM<br />
work were selected by backscattered electron imaging <strong>of</strong> carboncoated<br />
polished thin sections using a FEI Quanta 200 field-emission<br />
scanning electron microscope (SEM) operated at 20 kV in highvacuum<br />
mode. Qualitative X-ray analyses <strong>of</strong> micrometre-sized<br />
spots were also obtained using an EDAX Pegasus 2000 energy<br />
dispersive spectrometer (EDS) microanalysis system attached to the<br />
Quanta SEM. Prior to cutting the electron-transparent foils using<br />
the Focused Ion Beam (FIB) instrument the thin sections were<br />
sputter coated with 40 nm <strong>of</strong> gold to alleviate charging. The FIB<br />
work used a FEI 200 TEM operated at 30 kV. The milling process<br />
is described briefly below but in more detail by Heaney et al. (2001)<br />
and Lee et al. (2003). Prior to cutting <strong>of</strong> each foil a 1-lm-thick<br />
platinum strip was deposited over the area <strong>of</strong> interest to protect it<br />
Fig. 2. Simplified geological map <strong>of</strong> the NW Highlands showing relationship <strong>of</strong> Caledonian Foreland to Moine Thrust Belt. Sampling sites<br />
also shown.
2698 D.F. Mark et al. / Geochimica et Cosmochimica Acta 72 (2008) 2695–2710<br />
from damage by the Ga + ion beam. A pair <strong>of</strong> parallel trenches<br />
10–15 lm in length by 5 lm in depth were then excavated on<br />
either side <strong>of</strong> the strip to eventually leave a 110-nm-thick slice <strong>of</strong><br />
<strong>feldspar</strong> remaining between them (Fig. 3). This electron-transparent<br />
foil <strong>of</strong> the K-<strong>feldspar</strong> overgrowth (Fig. 3C and D) was then<br />
extracted from the grain using an ex-situ micromanipulator and<br />
placed on a 3.05-mm diameter perforated carbon film for TEM<br />
study (Fig. 3E).<br />
3.2. High-resolution petrography<br />
Each <strong>of</strong> the FIB-produced foils was examined initially using<br />
the Quanta SEM equipped with a secondary transmission electron<br />
microscope (STEM) detector (Fig. 3E), which enables images to<br />
be formed using electrons that have been transmitted through the<br />
thin sample (Smith et al., 2006). Bright-field STEM images are<br />
formed from unscattered electrons using an electron detector<br />
positioned directly beneath the thin slice whereas dark-field images<br />
are formed from high angle scattered electrons using an <strong>of</strong>fset<br />
detector. Diffraction-contrast TEM images were subsequently<br />
acquired using a FEI T20 instrument operated at 200 kV and<br />
equipped with a charge-coupled device (CCD) camera for digital<br />
image capture.<br />
3.3. <strong>Ar–Ar</strong> ultra-violet laser ablation <strong>dating</strong><br />
Prior to irradiation, the two 100-lm-thick doubly polished<br />
fluid-inclusion wafers were cleaned ultrasonically in methanol and<br />
deionised water. Samples were cadmium shielded and irradiated<br />
for 25 (An-t-Sron) and 33 (Skiag Bridge) hours in the Canadian<br />
McMaster reactor. Neutron flux was monitored with biotite<br />
standard GA1550 ( 98.8 ± 0.5 Ma; Renne et al., 1998); calculated<br />
J values <strong>of</strong> 0.00639 ± 0.000032 (An-t-Sron) and<br />
0.01398 ± 0.00007 (Skiag Bridge) were used. A New Wave Research<br />
UP-213 nm pulsed Nd-YAG laser with a 12-lm spot size<br />
was used for Ar extraction. Due to their small size entire K<strong>feldspar</strong><br />
overgrowths had to be ablated in order to extract<br />
approximately 10 times the blank 40 Ar levels. Extracted gases<br />
were cleaned using three SAES AP10 getters, two operated at<br />
450 °C and one at room temperature. A Map 215-50 noble gas<br />
mass spectrometer analysed Ar isotope compositions. The data<br />
were corrected for blanks, mass spectrometric discrimination,<br />
37 Ar decay and reactor induced interferences. Quoted <strong>Ar–Ar</strong> errors<br />
are 2r and include a 0.5% error (including lateral variation in<br />
the flux gradient) assigned to the J value. Reactor-induced correction<br />
factors used were: ( 39 Ar/ 37 Ar)Ca = 0.00065, ( 36 Ar/ 37 Ar)<br />
Ca = 0.000264, ( 40 Ar/ 39 Ar) K = 0.0085. Mark et al. (2006)<br />
provides details concerning the integration <strong>of</strong> fluid inclusion and<br />
<strong>Ar–Ar</strong> data.<br />
3.4. Ar-diffusion modelling<br />
Thermal history data was input into a finite element diffusion<br />
model DIFFARG (Wheeler, 1996) which works with MATLAB Ò<br />
s<strong>of</strong>tware. The program allows modelling <strong>of</strong> a precise thermal history.<br />
Effective diffusion domain size can be inputted for a series <strong>of</strong><br />
geometry shapes and their response to the thermal history over<br />
time can be tested. DIFFARG is a forward modelling program and<br />
hence, 0 Ma corresponds to the time <strong>of</strong> K-<strong>feldspar</strong> authigenesis.<br />
The model yields the amount <strong>of</strong> age resetting in Ma from which we<br />
determined by re-arrangement <strong>of</strong> the <strong>Ar–Ar</strong> age equation how<br />
much radiogenic Ar has been lost.<br />
Fig. 3. Sample shown from An-t-Sron. (A) Backscattered electron SEM image showing generation 1 (P1 C) K-<strong>feldspar</strong> overgrowths on detrital<br />
alkali <strong>feldspar</strong> grains. Generation 2 K-<strong>feldspar</strong> cement (P2C) envelops P1C and has occluded remaining porosity. Dol denotes <strong>authigenic</strong><br />
dolomite and Qz is detrital quartz (after Mark et al., 2007). (B) Secondary electron FIB image showing the location <strong>of</strong> pits excavated using the<br />
ion beam into the grain in the upper right <strong>of</strong> (A). (C) Secondary electron FIB image <strong>of</strong> a trench prior to lifting out <strong>of</strong> the foil, which lies<br />
between the two crosses. (D) Secondary electron FIB image <strong>of</strong> the trench following foil removement. (E) SEM–STEM image <strong>of</strong> a slice on a<br />
holey carbon film. The slice comprises <strong>feldspar</strong> that is thicker on the left- and right-hand sides than in the central portion, above which is a<br />
narrow ( 50 nm) layer <strong>of</strong> gold (white) overlain by the thicker ( 1 lm) platinum strap.
4. RESULTS<br />
4.1. Generations <strong>of</strong> <strong>authigenic</strong> K-<strong>feldspar</strong><br />
Mark et al. (2007) show that the two generations <strong>of</strong><br />
<strong>authigenic</strong> K-<strong>feldspar</strong> within the Fucoid Beds can be resolved<br />
(prior to <strong>Ar–Ar</strong> <strong>dating</strong>) by optical and scanning electron<br />
microscopy, quantitative mineral compositions, fluidinclusion<br />
petrography and parent fluid temperature and<br />
chemistry throughout the whole 180 km Fucoid Bed outcrop.<br />
Generation 1 cements (P1 C) comprise 10- to 40-lmsized<br />
overgrowths that envelop detrital alkali <strong>feldspar</strong><br />
grains whereas generation 2 cements (P2C) enclose P1C<br />
and occlude remaining porosity (Fig. 3A).<br />
4.2. Authigenic K-<strong>feldspar</strong> microtextures<br />
Foils for TEM study were cut (in samples from both Ant-Sron<br />
and Skiag Bridge) using the FIB from the detrital<br />
grain–P1C interface, P1C cement, and P2C cement<br />
(Fig. 3B; the fourth foil removed from trench 1 in Fig. 3B<br />
was destroyed during extraction). P1C and P2C are microtexturally<br />
distinct, in line with the contrasting properties<br />
<strong>of</strong> their fluid-inclusion populations (Mark et al., 2007).<br />
The microtexture <strong>of</strong> P1C <strong>feldspar</strong> changes with distance<br />
from its interface with the detrital grain (Fig. 4). Proximal<br />
to the interface (trench 2), the <strong>feldspar</strong> is free <strong>of</strong> subgrains<br />
and micropores and has a low defect density (Fig. 4A). Further<br />
from the interface in trench 3 the P1C <strong>feldspar</strong> contains<br />
2- to 3-lm-sized subgrains whose boundaries are delineated<br />
by long and narrow micropores (Fig. 4B). Aggregates <strong>of</strong> a<br />
very fine (
2700 D.F. Mark et al. / Geochimica et Cosmochimica Acta 72 (2008) 2695–2710<br />
Fig. 4. Samples shown from An-t-Sron. Bright-field TEM images <strong>of</strong> foils that have been cut and extracted from the grain in Fig. 3B. Image<br />
(A) is from trench 2, images (B and C) are from trench 3 and (D–F) are from trench 4. (A) The interface between the detrital alkali <strong>feldspar</strong><br />
grain and P1 C cement. Mottling in the detrital grain is due to the abundance <strong>of</strong> dislocations and subgrains and a number <strong>of</strong> small angular<br />
micropores are also present. The <strong>authigenic</strong> K-<strong>feldspar</strong> is subgrain-free, has a low defect density and a fine-scale modulated microtexture. The<br />
indexed SAED pattern (from the detrital grain) shows that the electron beam is parallel to [312]. Scale bar 1 lm. (B) Subgrains (2–3 lm in<br />
size) within P1C K-<strong>feldspar</strong> further from the interface with the detrital grain. Their boundaries (arrowed) have been etched by fluids to form<br />
long and narrow pores (arrowed). Scale bar 500 nm. (C) A subgrain boundary within P1 C cement along which have formed clumps <strong>of</strong> fibrous<br />
and poorly crystalline minerals, probably illite. Scale bar 500 nm. (D) P2C cement that contains a number <strong>of</strong> sub-micron to micron-sized<br />
subgrains, all <strong>of</strong> which have dislocation-rich boundaries. The euhedral subgrains have a {110} adularia habit. Some small micropores have<br />
also formed along one <strong>of</strong> the subgrain boundaries. Electron beam parallel to [001]. Scale bar 1 lm. (E) One subgrain in the P2 C cement. Areas<br />
<strong>of</strong> strain contrast highlight dislocations along subgrain boundaries and sub-micron-sized angular micropores also occur at subgrain<br />
boundaries. Electron beam parallel to [001]. Scale bar 100 nm. (F) Subgrains within P2C cement with more irregular but still dislocation-rich<br />
boundaries. Bend countours in the foil help highlight a diffuse microtexture with modulations approximately parallel to a * and b * . Electron<br />
beam parallel to [001]. Scale bar 500 nm. Note due to a technical failure <strong>of</strong> the double-tilt axis during TEM examination, the reciprocal lattice<br />
directions are not shown in all images.
5.2. Clay content<br />
Aggregates <strong>of</strong> 20 by 100-nm-sized crystals are present<br />
along subgrain boundaries within P1C (Fig. 4). These crystals<br />
are inferred to be illite from their habit and the findings<br />
<strong>of</strong> illite in two previous TEM studies <strong>of</strong> K-<strong>feldspar</strong> overgrowths<br />
from the UK (Worden and Rushton, 1992; Lee<br />
and Parsons, 2003). The replacement <strong>of</strong> K-<strong>feldspar</strong> by illite,<br />
or passive precipitation <strong>of</strong> illite within pores (processes<br />
which occur post-precipitation <strong>of</strong> the <strong>authigenic</strong> K-<strong>feldspar</strong>;<br />
Lee and Parsons, 2003) may potentially affect Ar–<br />
Ar ages because illite also contains 40 K that will radiogenically<br />
decay to 40 Ar * . However, considering the amount <strong>of</strong><br />
illite present along subgrain boundaries, the K-ratio between<br />
illite and K-<strong>feldspar</strong> and placing both <strong>of</strong> these factors<br />
in context with the amount <strong>of</strong> material ablated in order to<br />
obtain a single P1C <strong>Ar–Ar</strong> age (whole overgrowths), the input<br />
<strong>of</strong> 40 Ar * from clay (
2702 D.F. Mark et al. / Geochimica et Cosmochimica Acta 72 (2008) 2695–2710<br />
<strong>of</strong> brine-borne excess Ar (Harrison et al., 1994), show no<br />
correlation with <strong>Ar–Ar</strong> age (Mark et al., 2007).<br />
5.4. 39 Ar recoil and sample heating during irradiation<br />
Recoil loss <strong>of</strong> 39 Ar during irradiation has to be eliminated<br />
as a potential process that could result in scattering<br />
<strong>of</strong> the <strong>Ar–Ar</strong> ages for both P1 C and P2 C. 39 Ar has a recoil<br />
distance <strong>of</strong> 0.1 lm (Onstott et al., 1995; Villa, 1997). With<br />
respect to subgrain sizes for the P1C microtexture, 15 and<br />
2–3 lm, recoil loss <strong>of</strong> 39 Ar would not be sufficient to explain<br />
<strong>Ar–Ar</strong> age distributions. In P2C microtextures that contain<br />
0.5–1 lm subgrains, 39 Ar recoil is potentially a problematic<br />
issue. However, as the ablation areas were maximised (a<br />
minimum 50 lm 2 ), any potential effect <strong>of</strong> 39 Ar movement<br />
by 0.1 lm was negated by the analytical process.<br />
Sample heating during irradiation <strong>of</strong> cadmium shielded<br />
samples can potentially induce significant Ar-loss. Both wafers<br />
were irradiated at different times for different durations<br />
in different positions <strong>of</strong> the McMaster reactor. If heating<br />
had induced significant Ar-loss in one or both samples, then<br />
we would not have obtained comparable data from both<br />
samples.<br />
5.5. Thermally induced Ar-loss and <strong>Ar–Ar</strong> age resetting<br />
In order to test the <strong>Ar–Ar</strong> ages for resetting, Ar-loss<br />
from subgrains was modelled through a series <strong>of</strong> tectono–<br />
thermal histories (Wheeler, 1996). To model this data we<br />
have assumed weighted means for the different cementing<br />
phases using v. 3.00 <strong>of</strong> the isoplot/Ex program (Ludwig,<br />
2003). P1C at An-t-Sron has a weighted mean <strong>of</strong><br />
472.3 ± 5.1 Ma (mean-square weighted deviation [MSWD]<br />
3.9) and at Skiag Bridge a weighted mean <strong>of</strong><br />
467.0 ± 6.0 Ma (MSWD 2.6). P2C at An-t-Sron has a<br />
weighted mean <strong>of</strong> 435.9 ± 7.3 Ma (MSWD 1.8) and at<br />
Skiag Bridge a weighted mean <strong>of</strong> 430.2 ± 5.1 Ma (MSWD<br />
4.0). Although the data do not conform to a normal distribution<br />
(Fig. 5), with the implication there exists scatter due<br />
to geological causes, the weighted means represent a firstorder<br />
acceptable approximations for the ages <strong>of</strong> the two<br />
episodes <strong>of</strong> authigenesis for use in Ar-diffusion modelling.<br />
The temperatures experienced by the Fucoid Beds during<br />
Moine emplacement (which occurred at 430 to 422<br />
Ma; Dewey, 2005), have been reconstructed using evidence<br />
from acritarch colouration index (Downie, 1982), illite crystallinity<br />
(Johnson et al., 1985) and fluid-inclusion analysis<br />
(Baron et al., 2003; Mark et al., 2007). Minimum temperatures<br />
experienced by the sampled sections <strong>of</strong> the Fucoid<br />
Beds during Moine emplacement are 200 °C. The thermal<br />
data was entered into a simplified tectono–thermal thrust<br />
model (Oxburgh and Turcotte, 1974). A simplified thrust<br />
model is sufficient to model Ar diffusion and the maximum<br />
palaeotemperature and duration <strong>of</strong> heating (along with the<br />
effective diffusion dimension) are the main controls on Ar<br />
diffusion.<br />
5.5.1. Ar-diffusion model<br />
The Ar-diffusion model uses forward projection to test<br />
the <strong>Ar–Ar</strong> ages by establishing a thermal history (Wheeler,<br />
1996) against which assumed <strong>Ar–Ar</strong> ‘growth ages’ can be<br />
evaluated in terms <strong>of</strong> Ar-loss. In the model, 0 Ma corresponds<br />
to ages <strong>of</strong> authigenesis for both generations <strong>of</strong><br />
<strong>authigenic</strong> K-<strong>feldspar</strong> ( 470 and 432 Ma for P1 C and<br />
P2C, respectively), and 470 and 432 Ma in the model correspond<br />
to the present day for P1C and P2C, respectively.<br />
Prior to thrust sheet emplacement at 430 Ma, the model assumes<br />
that the temperature in the Fucoid Beds is represented<br />
by the fluid-entrapment temperatures that were<br />
determined previously (90 and 128 °C for P1C and P2C,<br />
respectively; Mark et al., 2007). Note that P2 C is younger<br />
and contains smaller subgrains than P1C. Therefore,<br />
although small P2C subgrains appear have lost less Ar than<br />
larger P1 C subgrains in some instances, P1 C was subjected<br />
to an extra 30–40 Ma <strong>of</strong> heating pre-thrusting.<br />
5.5.1.1. Eight million years ago, 200 °C thermal event. During<br />
thrust sheet emplacement (thrusting inferred to start at<br />
430 Ma; Johnson et al., 1985; Kinney et al., 1999), a<br />
stepped gradient developed within the footwall and the<br />
temperature at the thrust sheet–footwall interface was<br />
0.5 T (200 °C), where T is the temperature at the thrust<br />
sheet base prior to emplacement ( 400 °C). Rapid thermal<br />
re-equilibration <strong>of</strong> the footwall occurred as heat was conducted<br />
away from the thrust front (Johnson et al., 1985)<br />
through the over-thrusted successions. The footwall cooled<br />
from palaeo-maximum temperatures ( 200 °C) in response<br />
to syn- and post-uplift erosion. Assuming a standard<br />
erosion rate <strong>of</strong> 1 km/Myr for a continent–continent<br />
collision (current Himalaya erosion rates <strong>of</strong> 2.1 to<br />
2.9 mm/year; Galy and France-Lanord, 2001) and a geothermal<br />
gradient <strong>of</strong> 30 °C/km, the Fucoid Beds cooled<br />
to 150 °C by 422 Ma. We infer a simple linear cooling<br />
trend from 422 Ma to present day, and an approximated<br />
temperature <strong>of</strong> 10 °C to represent the current Fucoid<br />
Bed surface temperature. It is important to note that<br />
much <strong>of</strong> the recent Fucoid Bed temperature–time path<br />
has had insignificant effects on the diffusion <strong>of</strong> Ar in the<br />
K-<strong>feldspar</strong> subgrains (Fig. 6).<br />
Diffusion domain sizes determined from TEM work<br />
were used to represent the effective diffusion dimensions<br />
(Dodson, 1973; subgrains equated to spheres and corresponding<br />
radii determined from Fig. 4). P1C is relatively<br />
featureless and has large subgrains ( 15 lm in diameter)<br />
adjacent to the detrital grain–overgrowth boundary and<br />
smaller subgrains ( 3 lm diameter) further from the<br />
boundary (Fig. 4A and B). From TEM observations and<br />
cooling rates calculated using the tectono–thrust model outlined<br />
above (Fig. 6; 430 to 422 Ma = 6.25 °C/Ma; and 422–<br />
present day = 0.33 °C/Ma), it is possible to calculate the<br />
theoretical closure temperatures <strong>of</strong> the K-<strong>feldspar</strong> subgrains<br />
within the Fucoid Bed samples (Dodson, 1973). 15<br />
and 3 lm subgrains, respectively, have theoretical T c <strong>of</strong><br />
200 and 212 °C, and 155 and 170 °C for cooling rates <strong>of</strong><br />
0.33 and 6.25 °C/Ma. Subgrains are smaller ( 1 lm) and<br />
more abundant, but irregularly distributed within the P2C<br />
cements (Fig. 4D–F). 1 lm subgrains have a T c <strong>of</strong> 143<br />
and 154 °C for cooling rates <strong>of</strong> 0.33 and 6.25 °C/Ma. Ardiffusion<br />
models were run to quantitatively determine the<br />
amount <strong>of</strong> Ar-loss from both cement generations.
Subgrain microtextures and Ar diffusion 2703<br />
Fig. 6. Diagrams showing reconstructed thermal history, with which K-<strong>feldspar</strong> subgrains are modelled. The s<strong>of</strong>tware is a forward modelling<br />
program, hence, 0 Ma corresponds to ages <strong>of</strong> authigenesis, and 470 and 432 Ma correspond to present day. (A) P1 C authigenesis, 200 °C peak<br />
temperature. (B) P2 C authigenesis, 200 °C peak temperature. (C) P1 C authigenesis, 180 °C peak temperature. (D) P2 C authigenesis, 180 °C<br />
peak temperature. (E) P1C authigenesis, 160 °C peak temperature. (F) P2C authigenesis, 160 °C peak temperature. (G) P1C authigenesis,<br />
140 °C peak temperature. (H) P2C authigenesis, 140 °C peak temperature.
2704 D.F. Mark et al. / Geochimica et Cosmochimica Acta 72 (2008) 2695–2710<br />
The Ar-diffusion model (Fig. 7) indicates that the 3-lm<br />
subgrains will have lost 33% <strong>of</strong> their initial 40 Ar * (Table<br />
1), and so will yield <strong>Ar–Ar</strong> ages 140 Ma younger than the<br />
growth age. The 15-lm subgrains will have lost 28% <strong>of</strong> their<br />
40 Ar * and will have yielded <strong>Ar–Ar</strong> ages 120 Ma younger<br />
than the growth age (Table 1). However, because entire<br />
P1C overgrowths were ablated in order to obtain the maximum<br />
amount <strong>of</strong> Ar for each mass spectrometer measurement,<br />
each P1C <strong>Ar–Ar</strong> age is a function <strong>of</strong> variable ratios<br />
<strong>of</strong> 3 and 15 lm subgrains. The FIB-TEM method enables<br />
examination <strong>of</strong> only small regions <strong>of</strong> the <strong>authigenic</strong> K-<strong>feldspar</strong><br />
(15 5 lm foils) and as such, it is not possible to give<br />
accurate estimates <strong>of</strong> the proportion <strong>of</strong> large to small subgrains<br />
ablated for any single <strong>Ar–Ar</strong> age. Assuming a simple<br />
subgrain ratio <strong>of</strong> 1:1 for 15 and 3 lm subgrains, the model<br />
estimates that P1C has lost 30% <strong>of</strong> its 40 Ar * and <strong>Ar–Ar</strong> ages<br />
have been reset by 130 Ma. Therefore, the Ar-diffusion<br />
model estimates the actual age <strong>of</strong> P1 C authigenesis to be<br />
600 Ma. The same Ar-diffusion thermal model used for<br />
P1C (Fig. 6) indicates that 1 lm P2C subgrains (which are<br />
younger than the P1C subgrains) have lost 32% 40 Ar * , resetting<br />
the P2 C <strong>Ar–Ar</strong> age by 127 Ma and thus indicating a<br />
‘model’ <strong>Ar–Ar</strong> age for P2C authigenesis <strong>of</strong> 559 Ma (Fig. 7).<br />
Comparison <strong>of</strong> the modelled <strong>Ar–Ar</strong> ages for ‘modelled<br />
crystallisation’ <strong>of</strong> P1 C (600 Ma) and P2 C (559 Ma) with<br />
the depositional age <strong>of</strong> the Fucoid Beds (518 to 510 Ma;<br />
Gradstein et al., 2004), indicates discrepancies with the<br />
Ar-diffusion modelling. The subgrain sizes were measured<br />
Fig. 7. Typical DIFFARG output showing modelled response <strong>of</strong> different sized (15, 3 and 1 lm) subgrains (diffusion domains) to a 200, 180,<br />
160 and 140 °C thermal episode (Fig. 6). The Ar-diffusion model determines the amount <strong>of</strong> Ar-loss and therefore the degree that each <strong>Ar–Ar</strong><br />
age is reset, data are summarised in Table 1. (A) P1 C 15 lm subgrain (left, Ar evolution <strong>of</strong> spherical subgrains <strong>of</strong> known radius; right, bulk age<br />
showing apparent age post-exposure). (B) P1C 3 lm subgrain (left, Ar evolution <strong>of</strong> spherical subgrains <strong>of</strong> known radius; right, bulk age<br />
showing apparent age post-exposure). (C) P2C 1 lm subgrain (left, Ar evolution <strong>of</strong> spherical subgrains <strong>of</strong> known radius; right, bulk age<br />
showing apparent age post-exposure).
Table 1<br />
Amount <strong>of</strong> 40 Ar * -loss and <strong>Ar–Ar</strong> age resetting by thermally activated Ar diffusion<br />
Cement<br />
generation<br />
Subgrain<br />
size (lm)<br />
<strong>Ar–Ar</strong> age<br />
(Ma)<br />
using TEM (Fig. 4) and are consistent with the previous<br />
observations (Lee and Parsons, 2003). Therefore either<br />
the peak palaeotemperature associated with Scandian<br />
thrusting or the duration <strong>of</strong> heating has been overestimated,<br />
thereby overestimating Ar-loss from both cement<br />
generations. The impact <strong>of</strong> reducing both the peak palaeotemperature<br />
and the duration <strong>of</strong> the thermal perturbation<br />
can be tested by re-running the Ar-diffusion model using<br />
new parameters.<br />
5.5.1.2. Reduced palaeothermal maxima. A second series <strong>of</strong><br />
Ar-diffusion models (still using a thrust-related heating<br />
event at 430 Ma for duration <strong>of</strong> 8 Ma) were run with peak<br />
temperatures set at 180, 160 and 140 °C to quantitatively<br />
determine at what peak palaeotemperature the <strong>Ar–Ar</strong> ages<br />
would be consistent with the geological context <strong>of</strong> the rocks<br />
(Fig. 6). The model results are summarised in Fig. 7. The<br />
lowest maximum palaeotemperature <strong>of</strong> 140 °C causes little<br />
(4 %) 40 Ar * -loss from 15 lm subgrains and reduces <strong>Ar–Ar</strong><br />
ages by only 16 Ma. 40 Ar * -loss from 3 lm (7% 40 Ar * -loss)<br />
and 1 lm (9% 40 Ar * -loss) subgrains, thereby producing<br />
widely scattered <strong>Ar–Ar</strong> ages that are reduced by 27 and<br />
33 Ma, respectively (Table 1).<br />
Despite a geographical separation <strong>of</strong> 30 km between the<br />
two sampling sites, the two generations <strong>of</strong> cement in both<br />
samples have similar <strong>Ar–Ar</strong> age distributions, implying that<br />
P1 C and P2 C <strong>Ar–Ar</strong> ages at both sites have lost exactly the<br />
same amounts <strong>of</strong> 40 Ar * (i.e. experienced identical thermal<br />
histories resulting in equal resetting <strong>of</strong> both samples). In order<br />
for <strong>authigenic</strong> K-<strong>feldspar</strong> at both sites to have been reset<br />
identically, the thrust induced increase in thermal<br />
gradient must have been synchronous and uniform over<br />
the 30-km distance between the sites as any variation in<br />
temperature or timing, would have resulted in different<br />
thermal histories and hence, different <strong>Ar–Ar</strong> ages. Thermal<br />
synchronicity between the two sites is not consistent with<br />
field and laboratory data.<br />
Dewey (2005) showed that the impingement <strong>of</strong> the colliding<br />
landmasses during the Scandian episode <strong>of</strong> the Caledonian<br />
Orogeny occurred first in the south and resulted<br />
in the northern sector <strong>of</strong> the colliding landmass swivelling<br />
into the Laurentian margin. Thrusting was not synchronous<br />
across the entire 180 km Moine Thrust Zone.<br />
Subgrain microtextures and Ar diffusion 2705<br />
Peak temperature during<br />
thrusting (°C)<br />
Heating<br />
duration (Ma)<br />
Ar-loss<br />
(%)<br />
Ar-loss<br />
(Ma)<br />
P1C 15 470 200 8 28.1 120.0 350.0<br />
P1C 15 470 180 8 4.8 20.0 450.0<br />
P1 C 15 470 160 8 4.3 18.0 452.0<br />
P1C 15 470 140 8 4.0 16.5 453.5<br />
P1C 3 470 200 8 32.6 140.0 330.0<br />
P1 C 3 470 180 8 11.9 50.0 420.0<br />
P1 C 3 470 160 8 7.4 31.0 439.0<br />
P1C 3 470 140 8 6.5 27.0 443.0<br />
P2C 1 432 200 8 31.9 127.0 305.0<br />
P2 C 1 432 180 8 10.8 42.0 390.0<br />
P2 C 1 432 160 8 9.8 38.0 394.0<br />
P2C 1 432 140 8 8.6 33.5 398.5<br />
Model <strong>Ar–Ar</strong><br />
age (Ma)<br />
Fluid-inclusion data (Baron et al., 2003; Mark et al.,<br />
2007) also show that thrust induced heat flow within the<br />
Caledonian Foreland was neither synchronous nor uniform.<br />
During thrust emplacement, sites in the south (close<br />
to Skiag Bridge) were 30–40 °C cooler than those in the<br />
north (close to An-t-Sron). Data show that equal resetting<br />
<strong>of</strong> both P1 C and P2 C in both samples is highly unlikely.<br />
Furthermore, we know that temperatures reached a minimum<br />
<strong>of</strong> 200 °C in the Fucoid Beds (Downie, 1982; Baron<br />
et al., 2003; Johnson et al., 1985; Mark et al., 2007), but<br />
modelling <strong>of</strong> Ar-diffusion in line with a thermal history<br />
depicting peak temperatures <strong>of</strong> 200 °C and transient heating<br />
from the hanging wall into the footwall, clearly overestimates<br />
Ar-loss thereby <strong>dating</strong> the first episode <strong>of</strong><br />
authigenesis as pre-deposition.<br />
The evidence therefore suggests, if it is assumed that: (i)<br />
the K-<strong>feldspar</strong> diffusion coefficients are correct (Foland,<br />
1974), (ii) there was transient heating to 200 °C and (iii)<br />
subgrain size is representative <strong>of</strong> the effective diffusion<br />
dimension, that the <strong>Ar–Ar</strong> ages are incompatible with the<br />
geological context <strong>of</strong> the rocks. The other parameter in<br />
the Ar-diffusion model that can be modified to compensate<br />
for the <strong>Ar–Ar</strong> age overestimation is the mechanism by<br />
which heat is removed from the thrust zone and hence,<br />
the duration <strong>of</strong> thrust-induced heating.<br />
5.5.1.3. Short-term heating. The alternative heat flow model<br />
to transient heating would be very short thermal pulsing <strong>of</strong><br />
large volumes <strong>of</strong> hot fluids through the rock, a similar<br />
mechanism to which has been observed in Himalayan<br />
thrust zones (Le Fort, 1981; Copeland et al., 1991). As we<br />
know that fluids attained a temperature <strong>of</strong> 200 °C, the implied<br />
periods <strong>of</strong> fluid flushing removing heat from the thrust<br />
zone are short, perhaps in the order <strong>of</strong> 10 Ka. The Ar-diffusion<br />
model was re-run and modified to incorporate shortterm<br />
heating to 200 °C over 10 Ka for P1 C and P2 C (Fig. 8).<br />
The model shows that P1C 15 lm subgrains would lose 4%<br />
40 Ar * and 3 lm subgrains would lose 6% 40 Ar * , whilst P2C<br />
1 lm subgrains would lose 4% 40 Ar * (Fig. 9). Assuming a<br />
1:1 subgrain ablation ratio for P1 C subgrains (15 and<br />
3 lm), <strong>Ar–Ar</strong> ages would have been reset by 20 Ma,<br />
and P2C <strong>Ar–Ar</strong> ages by 17 Ma. The new model shows that<br />
the degree <strong>of</strong> age resetting due to thermally induced Ar-loss
2706 D.F. Mark et al. / Geochimica et Cosmochimica Acta 72 (2008) 2695–2710<br />
Fig. 8. Diagrams showing short-term heated fluid thermal history, against which K-<strong>feldspar</strong> subgrains are modelled. The s<strong>of</strong>tware is a<br />
forward modelling program, hence, 0 Ma corresponds to ages <strong>of</strong> authigenesis, and 470 and 432 Ma correspond to present day. (A) P1 C model,<br />
470 Ma to present day. (B) P2C model, 432 Ma to present day.<br />
Fig. 9. Typical DIFFARG output showing modelled response <strong>of</strong> different sized (15, 3 and 1 lm) subgrains (diffusion domains) to a short-term<br />
fluid heating event, 10,000 years at 200 °C (Fig. 6). (A) P1C 15 lm subgrain (left, Ar evolution <strong>of</strong> spherical subgrains <strong>of</strong> known radius; right,<br />
bulk age showing apparent age post-exposure). (B) P1C 3 lm subgrain (left, Ar evolution <strong>of</strong> spherical subgrains <strong>of</strong> known radius; right, bulk<br />
age showing apparent age post-exposure). (C) P2 C 1 lm subgrain (left, Ar evolution <strong>of</strong> spherical subgrains <strong>of</strong> known radius; right, bulk age<br />
showing apparent age post-exposure).
y rapid flushing <strong>of</strong> fluids is consistent with the observed<br />
variability <strong>of</strong> the <strong>authigenic</strong> K-<strong>feldspar</strong> <strong>Ar–Ar</strong> ages (Section<br />
4.3). Although the re-run Ar-diffusion model incorporating<br />
short-term heating by fluids is consistent with the observed<br />
<strong>Ar–Ar</strong> ages for both generations <strong>of</strong> <strong>authigenic</strong> K-<strong>feldspar</strong><br />
at both sites, the simplicity <strong>of</strong> the thermal model depicting<br />
short-term heating by fluids in the Himalaya has been questioned.<br />
Harrison et al. (1997) suggested that other factors<br />
may be acting in association with short-term heating by fluids<br />
to influence heat flow within the Himalayas.<br />
In summary, a tectono–thermal model assuming transient<br />
heating to 200 °C is incompatible with the <strong>Ar–Ar</strong> ages<br />
<strong>of</strong> the two generations <strong>of</strong> K-<strong>feldspar</strong> cement relative to the<br />
age <strong>of</strong> deposition for the Fucoid Beds. Transient heating to<br />
lower temperatures is inconsistent with the regional geology.<br />
A tectono–thermal model invoking rapid removal (in<br />
the order <strong>of</strong> 10 Ka) <strong>of</strong> heat from the thrust zone via flushing<br />
<strong>of</strong> hot fluids is consistent with the <strong>Ar–Ar</strong> age data and the<br />
regional context <strong>of</strong> the samples, but the validity <strong>of</strong> the tectono–thermal<br />
model has been questioned (Harrison et al.,<br />
1997). We have assumed for all <strong>of</strong> the above models that<br />
subgrain size is indicative <strong>of</strong> the effective diffusion dimension.<br />
This assumption is based on the fact that dislocation-rich<br />
subgrain boundaries in <strong>authigenic</strong> K-<strong>feldspar</strong> act<br />
as fast diffusion boundaries (zero Ar concentration) for<br />
40 Ar * as they do in superficially similar patch perthite (Burgess<br />
et al., 1992). What if this is an incorrect assumption?<br />
5.6. Subgrain microtextures and the effective diffusion<br />
dimension<br />
In order to answer fundamental questions regarding the<br />
magnitude and mechanisms <strong>of</strong> Ar-loss from <strong>authigenic</strong> K<strong>feldspar</strong>,<br />
what this paper sets out to address, it is pertinent<br />
to consider the properties <strong>of</strong> superficially similar patch<br />
perthite microtextures within deuterically altered alkali<br />
<strong>feldspar</strong>s from plutonic igneous rocks (Fig. 1). Direct comparisons<br />
have been made between the Ar-retention properties<br />
<strong>of</strong> these microtextures and <strong>authigenic</strong> K-<strong>feldspar</strong> (Lee<br />
and Parsons, 2003). Patch perthites form by deuteric/<br />
hydrothermal alteration <strong>of</strong> strain-controlled exsolution<br />
microtextures (unzipping reactions; Parsons and Lee,<br />
2005) and are composed <strong>of</strong> aggregates <strong>of</strong> sub-micron- to<br />
micron-sized subgrains. Microporous patch perthites form<br />
veins <strong>of</strong> networks that develop as fluids have penetrated<br />
the grain interior (Fig. 1). As a consequence, deuterically altered<br />
alkali <strong>feldspar</strong>s are highly permeable in zones where<br />
recrystallisation has occurred (Worden et al., 1990). Burgess<br />
et al. (1992) showed that these volumes <strong>of</strong> recrystallised<br />
alkali <strong>feldspar</strong> lose significant volumes <strong>of</strong> Ar over time.<br />
Patch perthite subgrains are typically incoherent and so<br />
their boundaries are dislocation-rich (Worden et al., 1990).<br />
As a consequence, it has been suggested that short-circuit<br />
diffusion, which takes place at a rate 4–5 orders <strong>of</strong> magnitude<br />
greater than lattice volume diffusion (Wartho et al.,<br />
1999), must be the principle mechanism <strong>of</strong> Ar-loss from<br />
patch perthites and not volume diffusion (Lee, 1995).<br />
Whereas most alkali <strong>feldspar</strong>s from slowly cooled igneous<br />
rocks have discrete patches or veins <strong>of</strong> the subgrain-rich<br />
microtexture (Parsons et al., 1999), entire <strong>authigenic</strong> K-<br />
Subgrain microtextures and Ar diffusion 2707<br />
<strong>feldspar</strong> overgrowths are composed <strong>of</strong> subgrains (Worden<br />
and Rushton, 1992; Lee and Parsons, 2003; Mark et al.,<br />
2005, 2006). Hence we assume that at very low temperatures,<br />
subgrained <strong>authigenic</strong> K-<strong>feldspar</strong> will leak Ar (Lee<br />
and Parsons, 2003). Therefore, depending on the thermal<br />
history <strong>of</strong> its parent rock, <strong>authigenic</strong> K-<strong>feldspar</strong> <strong>Ar–Ar</strong> ages<br />
may record isotopic closure rather than the crystallisation.<br />
However, results <strong>of</strong> previous <strong>Ar–Ar</strong> studies investigating<br />
<strong>authigenic</strong> K-<strong>feldspar</strong> (Hagen et al., 2001; Mark et al.,<br />
2005; Sherlock et al., 2005), suggest that there must be fundamental<br />
differences between patch perthite and <strong>authigenic</strong><br />
K-<strong>feldspar</strong> (Figs. 1 and 4) that can account for why the former<br />
leaks Ar whereas the latter appears to retain Ar.<br />
Although volumes <strong>of</strong> patch perthite appear turbid in<br />
thin section, K-<strong>feldspar</strong> overgrowths are typically uniform<br />
and glass-clear in transmitted-light, indicating that <strong>authigenic</strong><br />
<strong>feldspar</strong> has a lower density <strong>of</strong> micropores and inclusions.<br />
Furthermore, unlike patch perthite subgrains,<br />
<strong>authigenic</strong> K-<strong>feldspar</strong> subgrains form during crystal growth<br />
(not recrystallisation), and there is no reason why micropores<br />
should be inter-connected. Thus, if micropores are<br />
not connected, short-circuit Ar diffusion will not operate<br />
in the same manner as it does in patch perthite. Furthermore,<br />
Fitz Gerald et al. (2006) have recently observed networks<br />
<strong>of</strong> even smaller pores within alkali <strong>feldspar</strong>s from<br />
igneous rocks which could potentially act as additional<br />
pathways for rapid diffusion <strong>of</strong> Ar. These structures are<br />
characteristic <strong>of</strong> the semicoherent exsolution microtextures<br />
<strong>of</strong> perthitic alkali <strong>feldspar</strong>s and so would not be present<br />
within the <strong>authigenic</strong> K-<strong>feldspar</strong>.<br />
Given the hypothesised low micropermeability <strong>of</strong> microporous<br />
<strong>authigenic</strong> K-<strong>feldspar</strong> (compared to the high micropermeability<br />
and microporosity <strong>of</strong> patch perthite), a<br />
theoretical model has been formulated to explain why <strong>authigenic</strong><br />
K-<strong>feldspar</strong> may (unlike patch perthite) yield meaningful<br />
<strong>Ar–Ar</strong> growth ages. We suggest there is no direct route<br />
for the Ar to escape <strong>authigenic</strong> K-<strong>feldspar</strong> on the scale <strong>of</strong> tens<br />
or hundreds <strong>of</strong> microns as micropores are not connected and<br />
therefore diffusion cannot operate at enhanced rates in <strong>authigenic</strong><br />
K-<strong>feldspar</strong> as it does in patch perthtie (Fig. 10). Once an<br />
approximate equilibrium is established between the concentrations<br />
<strong>of</strong> Ar in the subgrains, the micropores and dislocation-rich<br />
boundaries, diffusion from the subgrains into the<br />
porous regions <strong>of</strong> the mineral will be controlled by re-equilibration<br />
over time (i.e. the Ar is trapped within dislocations,<br />
micropores and subgrain boundaries and therefore violates<br />
the assumption that such features act as infinite reservoirs<br />
with zero concentrations <strong>of</strong> Ar). Re-equilibration will occur<br />
as further Ar within subgrains is produced by radioactive decay<br />
and Ar diffuses out <strong>of</strong> the K-<strong>feldspar</strong> subgrains via volume<br />
diffusion into dislocations, micropores and subgrain<br />
boundaries.<br />
Although short-circuit diffusion <strong>of</strong> Ar is potentially restricted<br />
within <strong>authigenic</strong> K-<strong>feldspar</strong>, thus preventing rapid<br />
Ar-loss in comparison to patch perthite, lattice volume diffusion<br />
still occurs. Contrary to patch perthite, volume diffusion<br />
may be the dominant diffusion mechanism. Ar-loss<br />
from the overgrowth boundary will still be occurring by<br />
volume diffusion and hence we have to model <strong>Ar–Ar</strong> age<br />
data accordingly (Fig. 10). The implications <strong>of</strong> this theoret-
2708 D.F. Mark et al. / Geochimica et Cosmochimica Acta 72 (2008) 2695–2710<br />
Fig. 10. Simple schematic diagram (not drawn to scale and spheres used to represent subgrains as used in DIFFARG model, true subgrains<br />
would have triple-junctions that can not be represented by spheres) showing the fundamental differences between patch perthite (left) and<br />
<strong>authigenic</strong> K-<strong>feldspar</strong> (right) microtexture. Within both subgrained structures Ar diffusion from the subgrains into the micropores occurs via<br />
volume diffusion. However, patch perthite micropores are interconnected and Ar can diffuse out <strong>of</strong> the micropores via short-circuit diffusion<br />
and from the perthite boundary via volume diffusion. Due to a lack <strong>of</strong> permeability with the <strong>authigenic</strong> K-<strong>feldspar</strong> microtexture, Ar can only<br />
diffuse through the grain boundary via volume diffusion. Short-circuit diffusion within <strong>authigenic</strong> K-<strong>feldspar</strong> is reduced. Hence, whereas<br />
currently subgrain size is used as the effective diffusion dimension (A), it may be more suitable to use the overgrowth thickness (B) to<br />
accurately model Ar-diffusion.<br />
Fig. 11. Typical DIFFARG output showing modelled response <strong>of</strong> 100 and 40 lm subgrains to the thermal history shown in Figs. 5 and, 10A<br />
and B. (Left) Ar evolution <strong>of</strong> spherical grains <strong>of</strong> known radius. (Right) Bulk age showing apparent age post-exposure to the thermal history.<br />
Note, DIFFARG is a forward modelling program, hence for the 100-lm subgrain 0 corresponds to 432 Ma and 432 corresponds to present<br />
day. For the 40-lm subgrain 0 Ma corresponds to 470 Ma and 432 Ma corresponds to present day. The model shows that 100 lm subgrains<br />
are reset from 432 to 429 Ma and 40 lm subgrains are reset from 470 to 457 Ma.<br />
ical model are that rather than modelling Ar-loss from K<strong>feldspar</strong><br />
overgrowths using subgrain sizes determined from<br />
TEM images, Ar-diffusion models should use overgrowth<br />
thickness as the effective diffusion dimension (Fig. 10).<br />
We can quantitatively test the theoretical model by<br />
re-running the Ar diffusion models with different effective<br />
diffusion dimensions. P1 C overgrowths have a maximum<br />
thickness <strong>of</strong> 40 lm and P2C overgrowths are up to<br />
100 lm thick (Fig. 3). Using a heating event at<br />
430 Ma with duration <strong>of</strong> 8 Ma and peak temperature<br />
<strong>of</strong> 200 °C (the original Ar-diffusion model; Fig. 6) and<br />
effective diffusion dimensions <strong>of</strong> 40 and 100 lm, the<br />
Ar-diffusion model was re-run to test the theoretical<br />
model outlined in Fig. 10. Grains were approximated<br />
to spheres (geometry is not a massively significant variable<br />
with respect to the effective diffusion dimension<br />
and temperature and duration <strong>of</strong> heating) and no excess<br />
Ar was input into the model. Results are shown in<br />
Fig. 11. 470 Ma ago 40-lm-thick overgrowths have been<br />
reset by 13 Ma (lost 3% 40 Ar * ) and 432 Ma 100-lmthick-overgrowths<br />
have been reset by 3 Ma (lost
TEM imaging), especially as previous studies successfully<br />
modelled Ar diffusion using subgrain diameter as the effective<br />
diffusion dimension (Mark et al., 2005). Although<br />
Mark et al. (2005) successfully modelled Ar diffusion using<br />
subgrain size rather than overgrowth thickness, the rocks<br />
were only exposed to low post-growth temperatures following<br />
authigenesis (125 °C). Hence, the variation in effective<br />
diffusion dimension is not as significant as it is with respect<br />
to the Fucoid Bed case study, and had a limited impact on<br />
the Ar-loss data.<br />
6. CONCLUSIONS<br />
The <strong>Ar–Ar</strong> ages two generations <strong>of</strong> Fucoid Bed <strong>authigenic</strong><br />
K-<strong>feldspar</strong> (P1C and P2C) record different stages <strong>of</strong><br />
mineral growth and have undergone minimal Ar-loss and<br />
<strong>Ar–Ar</strong> age resetting. Two separate models have been proposed,<br />
both <strong>of</strong> which are consistent with the geological context<br />
<strong>of</strong> the samples (heating to a minimum <strong>of</strong> 200 °C) and<br />
can account for the apparent robustness <strong>of</strong> the <strong>authigenic</strong><br />
K-<strong>feldspar</strong> with respect to microtextural repetitiveness <strong>of</strong><br />
Ar: short-term hot fluid flushing (assuming subgrain sizes<br />
are appropriate estimations <strong>of</strong> the effective diffusion dimension)<br />
and transient heating (assuming overgrowth thickness<br />
as an appropriate estimation <strong>of</strong> the effective diffusion<br />
dimension).<br />
We highlight that although K-<strong>feldspar</strong> microtextures appear<br />
to be microporous, it is potentially micropermeability<br />
that is the critical factor with respect to Ar-loss and the<br />
ability <strong>of</strong> a mineral phase to record meaningful <strong>Ar–Ar</strong> isotopic<br />
data. This project is not intended to be the definitive<br />
study <strong>of</strong> Ar-diffusion within <strong>authigenic</strong> K-<strong>feldspar</strong>, but provides<br />
a suitable starting point for discussions <strong>of</strong> factors governing<br />
the reliability <strong>of</strong> <strong>Ar–Ar</strong> <strong>dating</strong> using <strong>authigenic</strong> K<strong>feldspar</strong><br />
and the importance <strong>of</strong> understanding Ar trapping<br />
mechanisms within different <strong>feldspar</strong> microtextures. More<br />
experimental work is required to develop and test (prove/<br />
disprove) the theoretical model outlined in this paper.<br />
The collection <strong>of</strong> quantitative <strong>Ar–Ar</strong> data from <strong>authigenic</strong><br />
K-<strong>feldspar</strong> that has been exposed to a range <strong>of</strong> high-temperature<br />
settings is required before the validity <strong>of</strong> the model<br />
proposed here can be confirmed.<br />
ACKNOWLEDGMENTS<br />
This work is supported by the Natural Environment Research<br />
Council (NERC) Ocean Margins Project, Research Grant No.<br />
3220/GL021/GRA0782. We thank Pr<strong>of</strong>essor Alan Craven for access<br />
to the FIB-TEM facilities in <strong>Glasgow</strong> <strong>University</strong> and Billy<br />
Smith, Colin How, John Still and James Schwanethal for technical<br />
assistance. Associate Editor Y. Amelin is thanked for comments<br />
leading to improvement <strong>of</strong> this manuscript. Three reviewers, J.A.<br />
Wartho, J.K.W. Lee and G.D. Vincenzo are also thanked for detailed<br />
reviews, comments and constructive suggestions.<br />
REFERENCES<br />
Baron M., Parnell J. and Bordas Le Floch N. (2003) Preservation<br />
<strong>of</strong> pre-orogenic palae<strong>of</strong>luids within the Caledonides <strong>of</strong> northwest<br />
Scotland. J. Geochem. Explor. 78–79, 27–31.<br />
Subgrain microtextures and Ar diffusion 2709<br />
Bowie S. U. H., Dawson J., Gallagher M. J., Ostle D., Lambert R.<br />
J. and Lawson R. I. (1966) Potassium-rich sediments in the<br />
Cambrian <strong>of</strong> Northwest Scotland. Transcripts Inst. Mineral.<br />
Metall. 75, B125–B145.<br />
Burgess R., Kelley S. P., Parsons I., Walker F. D. L. and Worden<br />
R. H. (1992) 40 Ar/ 39 Ar analysis <strong>of</strong> perthite microstructures and<br />
fluid inclusions in alkali <strong>feldspar</strong>s from the Klokken syenite,<br />
South Greenland. Earth Planet. Sci. Lett. 109, 147–167.<br />
Copeland P., Harrison T. M., Hodges K. V., Maruejol P., Lefort P.<br />
and Pecher A. (1991) An Early Pliocene thermal disturbance <strong>of</strong><br />
the Main Central Thrust, Central Nepal—implications for<br />
Himalayan Tectonics. J. Geophys. Res. Solid Earth Planet 96,<br />
8475–8500.<br />
Dewey J. F. (2005) Orogeny can be very short. Proc. Natl. Acad.<br />
Sci. USA 102, 15286–15293.<br />
Dodson M. H. (1973) Closure temperature in cooling geochronological<br />
and petrological systems. Contrib. Mineral. Petrol. 40(3),<br />
259–274.<br />
Downie C. (1982) Lower Cambrian acritarchs from Scotland,<br />
Greenland and Canada. Transcripts Roy. Soc. Edinburgh 71,<br />
69–96.<br />
Fitz Gerald J. D., Parsons I. and Cayzer N. (2006) Nanotunnels<br />
and pull-aparts: defects <strong>of</strong> exsolution lamellae in alkali<br />
<strong>feldspar</strong>s. Am. Mineral. 91, 772–783.<br />
Foland K. A. (1974) Ar 40 diffusion in homogeneous orthoclase and<br />
an interpretation <strong>of</strong> Ar diffusion in K-<strong>feldspar</strong>s. Geochim.<br />
Cosmochim. Acta 38, 151–166.<br />
Foland K. A. (1994) Argon diffusion in <strong>feldspar</strong>s. In Feldspars and<br />
Their Reactions (ed. I. Parsons). Kluwer Academic Publishers,<br />
Dordrecht, The Netherlands, pp. 415–447.<br />
Galy A. and France-Lanord C. F. (2001) Higher erosion rates in<br />
the Himalaya: geochemical constraints on riverine fluxes.<br />
Geology 29, 23–26.<br />
Girard J. P., Aronson J. L. and Savin S. M. (1988) Separation, K–<br />
Ar <strong>dating</strong> and 18 O/ 16 O ratio measurements <strong>of</strong> diagenetic K<strong>feldspar</strong><br />
overgrowths: an example from the Lower Cretaceous<br />
arkoses <strong>of</strong> the Angolan Margin. Geochim. Cosmochim. Acta 52,<br />
2207–2214.<br />
Gradstein F., Ogg J. and Smith A. (2004) A geologic time scale.<br />
Cambridge <strong>University</strong> Press, Cambridge, MA.<br />
Hagen E., Kelley S. P., Dypvik H., Nilsen O. and Kjølhamar B.<br />
(2001) Direct <strong>dating</strong> <strong>of</strong> <strong>authigenic</strong> K <strong>feldspar</strong> overgrowths from<br />
the Kilombero Rift <strong>of</strong> Tanzania. J. Geol. Soc. Lond. 158, 801–<br />
807.<br />
Harrison T. M., Heizler M. T., Lovera O. M., Wenji C. and Grove M.<br />
(1994) A chlorine disinfectant for excess argon released from K<strong>feldspar</strong><br />
during step heating. Earth Planet. Sci. Lett. 123, 95–104.<br />
Harrison T. M., Ryerson F. J., Le Fort P., Tin A., Lovera O. M.<br />
and Catlos E. J. (1997) A late Miocene–Pliocene origin for the<br />
Central Himalayan inverted metamorphism. Earth Planet. Sci.<br />
Lett. 146, E1–E7.<br />
Heaney P. J., Vicenzi E. P., Giannuzzi L. A. and Livi K. J. T.<br />
(2001) Focused ion beam milling: a method <strong>of</strong> site specific<br />
sample extraction for microanalysis <strong>of</strong> Earth and planetary<br />
samples. Am. Mineral. 86, 1094–1099.<br />
Hearn P. P. and Sutter J. F. (1985) Authigenic potassium <strong>feldspar</strong><br />
in Cambrian carbonates: evidence <strong>of</strong> Alleghanian Brine migration.<br />
Science 228, 1529–1531.<br />
Hearn P. P., Sutter J. F. and Belkin H. E. (1987) Evidence for Late-<br />
Paleozoic brine migration in Cambrian carbonate rocks <strong>of</strong> the<br />
central and southern Appalachians: implications for Mississippi<br />
Valley-type sulfide mineralization. Geochim. Cosmochim. Acta<br />
51, 1323–1334.<br />
Johnson M. R. W., Kelley S. P., Oliver G. J. H. and Winter D. A.<br />
(1985) Thermal effects and timing in the Moine Thrust zone. J.<br />
Geol. Soc. Lond. 142, 863–873.
2710 D.F. Mark et al. / Geochimica et Cosmochimica Acta 72 (2008) 2695–2710<br />
Kelley S. P. (2002) Excess argon in K–Ar and <strong>Ar–Ar</strong> geochronology.<br />
Chem. Geol. 188, 1–22.<br />
Kelley S. P., Arnaud N. O. and Turner S. P. (1994) High spatial<br />
resolution 40 Ar/ 39 Ar investigation using an ultra-violet laser<br />
probe extraction technique. Geochim. Cosmochim. Acta 58(16),<br />
3519–3525.<br />
Kinney P. D., Strachan R. A., Friend C. R. L., Kocks H., Rogers<br />
G. and Paterson B. A. (1999) U–Pb geochronology <strong>of</strong> deformed<br />
metagranites in central Sutherland, Scotland: evidence for<br />
widespread late Silurian metamorphism and ductile deformation<br />
<strong>of</strong> the Moine Supergroup during the Caledonian Orogeny.<br />
J. Geol. Soc. Lond. 160, 259–269.<br />
Lee J. K. W. (1995) Multipath diffusion in geochronology. Contrib.<br />
Mineral. Petrol. 120, 60–82.<br />
Lee M. R. and Parsons I. (2003) Microtextures <strong>of</strong> <strong>authigenic</strong> Orrich<br />
<strong>feldspar</strong> in the Upper Jurassic Humber Group, UK, North<br />
Sea. Sedimentology 50, 597–608.<br />
Lee M. R., Bland G. A. and Graham G. (2003) Preparation <strong>of</strong><br />
TEM samples by focus ion beam (FIB) techniques: applications<br />
to the study <strong>of</strong> clays and phyllosilicates in meteorites. Miner.<br />
Mag. 67, 581–592.<br />
Le Fort P. (1981) Manaslu leucogranite: a collision signature <strong>of</strong> the<br />
Himalaya, a model for its genesis and emplacement. J. Geophys.<br />
Res. 86(10), 545–550.<br />
Liu J., Hay R. L., Deino A. and Kyser T. Y. (2003) Age and origin<br />
<strong>of</strong> <strong>authigenic</strong> K-<strong>feldspar</strong> in uppermost Precambrian rocks in the<br />
North American Midcontinent. Geol. Soc. Am. Bull. 115, 422–<br />
433.<br />
Ludwig K. R. (2003) Users manual for Isoplot 3.00, a geochronological<br />
toolkit for Micros<strong>of</strong>t Excel. Berkeley Geochronol.<br />
Centre Special Publication 4, 54.<br />
Mark D. F., Parnell J., Kelley S. P., Lee M., Sherlock S. C. and<br />
Carr A. (2005) Dating <strong>of</strong> multistage fluid flow in sandstone.<br />
Science 309, 2048–2051.<br />
Mark D. F., Parnell J., Kelley S. P. and Sherlock S. C. (2006)<br />
Temperature–composition–time (TXt) data from <strong>authigenic</strong> K<strong>feldspar</strong>:<br />
an integrated methodology for <strong>dating</strong> fluid flow<br />
events. J. Geochem. Explor. 89, 259–262.<br />
Mark D. F., Parnell J., Kelley S. P. and Sherlock S. (2007)<br />
Resolution <strong>of</strong> regional fluid flow related to successive orogenic<br />
events on the Laurentian Margin. Geology 35, 547–550.<br />
Mark D. F., Green P. F., Parnell J., Kelley S. P., Lee M. R. and<br />
Sherlock S. C. (2008) Late Palaeozoic hydrocarbon migration<br />
through the Clair field, West <strong>of</strong> Shetland, UK Atlantic margin.<br />
Geochim. Cosmochim. Acta. doi:10.1016/j.gca.2007.11.037.<br />
McDougall T. and Harrison M. T. (1999) Geochronology and<br />
thermochronology by the Ar/Ar method. Oxford <strong>University</strong><br />
Press, Oxford.<br />
Onstott T. C., Miller M. L., Ewing R. C., Arnold G. W. and Walsh<br />
D. S. (1995) Recoil refinements: implications for the 40 Ar/ 39 Ar<br />
<strong>dating</strong> technique. Geochim. Cosmochim. Acta 59(9), 1821–1834.<br />
Oxburgh E. R. and Turcotte D. L. (1974) Membrane tectonics and<br />
East-African Rift. Earth Planet. Sci. Lett. 22(2), 133–140.<br />
Parsons I. (1978) Feldspars and fluids in cooling plutons. Miner.<br />
Mag. 42, 1–17.<br />
Parsons I. (1994) Feldspars and their reactions. Kluwer Academic<br />
Publishers, Dordrecht, The Netherlands.<br />
Parsons I. and Lee M. R. (2000) Alkali <strong>feldspar</strong>s as microtextural<br />
markers <strong>of</strong> fluid flow. In Hydrogeology <strong>of</strong> Crystalline rocks (eds.<br />
I. Stober and K. Bucher). Kluwer Academic Publishers,<br />
Dordrecht, The Netherlands.<br />
Parsons I. and Lee M. R. (2005) Minerals are not just chemical<br />
compounds. Can. Mineral. 43, 1959–1992.<br />
Parsons I., Brown W. L. and Smith J. V. (1999) 40 Ar/ 39 Ar<br />
thermochronology using alkali <strong>feldspar</strong>s: real thermal history<br />
or mathematical mirage <strong>of</strong> microtexture? Contrib. Mineral.<br />
Petrol. 136(1–2), 92–110.<br />
Renne P. R., Swisher C. C., Deino A. L., Karner D. B., Owens T.<br />
L. and DePaolo D. J. (1998) Intercalibration <strong>of</strong> standards,<br />
absolute ages and uncertainties in Ar/Ar <strong>dating</strong>. Chem. Geol.<br />
145, 117–152.<br />
Sherlock S. C., Lucks T., Kelley S. P. and Barnicoat A. (2005) A<br />
high resolution record <strong>of</strong> multiple diagenetic events: ultraviolet<br />
laser microprobe Ar/Ar analysis <strong>of</strong> zoned K-<strong>feldspar</strong> overgrowths.<br />
Earth Planet. Sci. Lett. 238, 329–341.<br />
Smith C., Lee M. R. and MacKenzie M. (2006) New opportunities<br />
for nanomineralogy using FIB, STEM/EDX and TEM.<br />
Microsc. Anal. 111, 17–20.<br />
Spötl C., Kralik M. and Kunk M. J. (1996) Authigenic <strong>feldspar</strong> as<br />
an indication <strong>of</strong> palaeo-rock/water interactions in permian<br />
carbonates <strong>of</strong> the Northern Calcareous Alps, Austria. J.<br />
Sediment. Res. 66(1), 139–146.<br />
Villa I. M. (1997) Direct determination <strong>of</strong> 39 Ar recoil distance.<br />
Geochim. Cosmochim. Acta(3), 689–691.<br />
Walgenwitz F., Pagel M., Meyer A., Maluski H. and Monie P.<br />
(1990) Thermo–chronological approach to reservoir diagenesis<br />
in the <strong>of</strong>fshore Angola Basin: a fluid inclusion, 40 Ar/ 39 Ar and<br />
K-Ar investigation. Am. Assoc. Petrol. Geol. Bull. 74(5), 547–<br />
563.<br />
Walker F. D. L., Lee M. R. and Parsons I. (1995) Microprobes and<br />
micropermeable texture in alkali <strong>feldspar</strong>s: geochemical and<br />
geophysical implications. Miner. Mag. 59, 507–536.<br />
Warnock A. C. and van de Kamp P. C. (1999) Hump-shaped<br />
40 Ar/ 39 Ar age spectra in K-<strong>feldspar</strong> and evidence for<br />
Cretaceous authigenesis in the Fountain Formation near<br />
Eldorado Springs, Colorado. Earth Planet. Sci. Lett. 174, 99–<br />
111.<br />
Wartho J., Kelley S. P., Brooker R. A., Carroll M. R., Villa I. M.<br />
and Lee M. R. (1999) Direct measurement <strong>of</strong> Ar diffusion<br />
pr<strong>of</strong>iles in a gem-quality Madagascar K-<strong>feldspar</strong> using the<br />
ultra-violet ablation microprobe (UVLAMP). Earth Planet.<br />
Sci. Lett. 170, 141–153.<br />
Wheeler J. (1996) DIFFARG: a program for stimulating<br />
argon diffusion pr<strong>of</strong>iles in minerals. Comput. Geosci. 22(8),<br />
919–929.<br />
Worden R. H. and Rushton J. C. (1992) Diagenetic K-<strong>feldspar</strong><br />
textures: a TEM study and model for diagenetic <strong>feldspar</strong><br />
growth. J. Sediment. Petrol.(5), 779–789.<br />
Worden R. H., Walker F. D. L., Parsons I. and Brown W. L.<br />
(1990) Development <strong>of</strong> microporosity, diffusion channels and<br />
deuteric coarsening in perthitic alkali <strong>feldspar</strong>. Contrib. Mineral.<br />
Petrol. 104, 507–515.<br />
Associate editor: Yuri Amelin