Background/Summary of Ammonia Investigations in the Sacramento ...
Background/Summary of Ammonia Investigations in the Sacramento ...
Background/Summary of Ammonia Investigations in the Sacramento ...

Create successful ePaper yourself
Turn your PDF publications into a flip-book with our unique Google optimized e-Paper software.
<strong>Background</strong>/<strong>Summary</strong> <strong>of</strong> <strong>Ammonia</strong> <strong>Investigations</strong> <strong>in</strong> <strong>the</strong><br />
<strong>Sacramento</strong>-San Joaqu<strong>in</strong> Delta and Suisun Bay<br />
2 March 2009<br />
Prepared by: Adam Ballard, Central Valley Regional Water Board<br />
Rich Breuer, CA Department <strong>of</strong> Water Resources<br />
Frances Brewster, Santa Clara Valley Water District<br />
Cliff Dahm, CALFED Science Program<br />
Cameron Irv<strong>in</strong>e, CH2M HILL<br />
Karen Larsen, Central Valley Regional Water Board<br />
Anke Mueller-Solger, Interagency Ecological Program<br />
Al Vargas, CALFED Science Program<br />
Purpose <strong>of</strong> this Document<br />
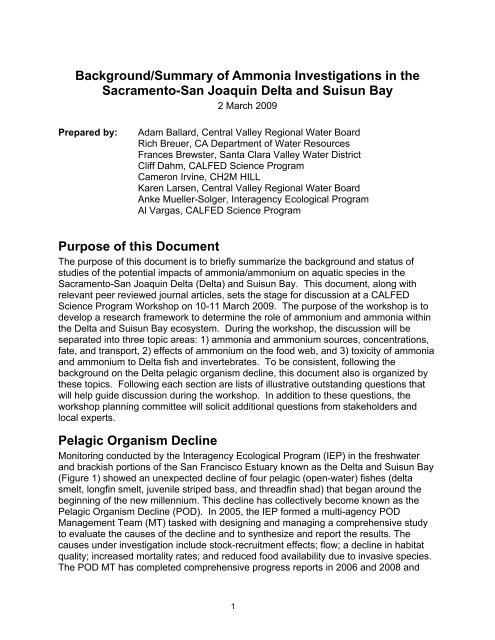
The purpose <strong>of</strong> this document is to briefly summarize <strong>the</strong> background and status <strong>of</strong><br />
studies <strong>of</strong> <strong>the</strong> potential impacts <strong>of</strong> ammonia/ammonium on aquatic species <strong>in</strong> <strong>the</strong><br />
<strong>Sacramento</strong>-San Joaqu<strong>in</strong> Delta (Delta) and Suisun Bay. This document, along with<br />
relevant peer reviewed journal articles, sets <strong>the</strong> stage for discussion at a CALFED<br />
Science Program Workshop on 10-11 March 2009. The purpose <strong>of</strong> <strong>the</strong> workshop is to<br />
develop a research framework to determ<strong>in</strong>e <strong>the</strong> role <strong>of</strong> ammonium and ammonia with<strong>in</strong><br />
<strong>the</strong> Delta and Suisun Bay ecosystem. Dur<strong>in</strong>g <strong>the</strong> workshop, <strong>the</strong> discussion will be<br />
separated <strong>in</strong>to three topic areas: 1) ammonia and ammonium sources, concentrations,<br />
fate, and transport, 2) effects <strong>of</strong> ammonium on <strong>the</strong> food web, and 3) toxicity <strong>of</strong> ammonia<br />
and ammonium to Delta fish and <strong>in</strong>vertebrates. To be consistent, follow<strong>in</strong>g <strong>the</strong><br />
background on <strong>the</strong> Delta pelagic organism decl<strong>in</strong>e, this document also is organized by<br />
<strong>the</strong>se topics. Follow<strong>in</strong>g each section are lists <strong>of</strong> illustrative outstand<strong>in</strong>g questions that<br />
will help guide discussion dur<strong>in</strong>g <strong>the</strong> workshop. In addition to <strong>the</strong>se questions, <strong>the</strong><br />
workshop plann<strong>in</strong>g committee will solicit additional questions from stakeholders and<br />
local experts.<br />
Pelagic Organism Decl<strong>in</strong>e<br />
Monitor<strong>in</strong>g conducted by <strong>the</strong> Interagency Ecological Program (IEP) <strong>in</strong> <strong>the</strong> freshwater<br />
and brackish portions <strong>of</strong> <strong>the</strong> San Francisco Estuary known as <strong>the</strong> Delta and Suisun Bay<br />
(Figure 1) showed an unexpected decl<strong>in</strong>e <strong>of</strong> four pelagic (open-water) fishes (delta<br />
smelt, longf<strong>in</strong> smelt, juvenile striped bass, and threadf<strong>in</strong> shad) that began around <strong>the</strong><br />
beg<strong>in</strong>n<strong>in</strong>g <strong>of</strong> <strong>the</strong> new millennium. This decl<strong>in</strong>e has collectively become known as <strong>the</strong><br />
Pelagic Organism Decl<strong>in</strong>e (POD). In 2005, <strong>the</strong> IEP formed a multi-agency POD<br />
Management Team (MT) tasked with design<strong>in</strong>g and manag<strong>in</strong>g a comprehensive study<br />
to evaluate <strong>the</strong> causes <strong>of</strong> <strong>the</strong> decl<strong>in</strong>e and to syn<strong>the</strong>size and report <strong>the</strong> results. The<br />
causes under <strong>in</strong>vestigation <strong>in</strong>clude stock-recruitment effects; flow; a decl<strong>in</strong>e <strong>in</strong> habitat<br />
quality; <strong>in</strong>creased mortality rates; and reduced food availability due to <strong>in</strong>vasive species.<br />
The POD MT has completed comprehensive progress reports <strong>in</strong> 2006 and 2008 and<br />
1
Overview <strong>of</strong> Studies <strong>of</strong> <strong>Ammonia</strong> 2 March 2009<br />
<strong>Sacramento</strong>-San Joaqu<strong>in</strong> Delta<br />
results from many <strong>in</strong>dividual POD study elements have been summarized <strong>in</strong> journal<br />
articles and reports (s. http://www.science.calwater.ca.gov/pod/pod_<strong>in</strong>dex.html for<br />
reports and publications). However, many studies are still under way. A new<br />
comprehensive progress report highlight<strong>in</strong>g new results is expected <strong>in</strong> early 2009 and a<br />
f<strong>in</strong>al report summariz<strong>in</strong>g and syn<strong>the</strong>siz<strong>in</strong>g all results is planned for late 2010. The<br />
ammonia and ammonium summary provided here will be part <strong>of</strong> <strong>the</strong> 2009 report, and<br />
some aspects are also conta<strong>in</strong>ed <strong>in</strong> <strong>the</strong> 2008 report.<br />
The overall story that is emerg<strong>in</strong>g from <strong>the</strong> POD <strong>in</strong>vestigations is that <strong>the</strong> estuar<strong>in</strong>e<br />
ecosystem appears to have undergone a fairly rapid shift from a state that allowed<br />
pelagic fishes to thrive or at least persist to a state that appears to be quite hostile to<br />
pelagic fishes. This shift likely is caused by a variety <strong>of</strong> factors related to changes <strong>in</strong><br />
climate, food webs, land use, and water project operations. It is important to note that<br />
no one factor is solely responsible for this shift, and ammonia/ammonium is only one <strong>of</strong><br />
several potentially important factors.<br />
Status <strong>of</strong> POD <strong>Ammonia</strong>/Ammonium <strong>Investigations</strong> and Brief<br />
<strong>Summary</strong> <strong>of</strong> Results<br />
POD ammonia/ammonium <strong>in</strong>vestigations started <strong>in</strong> 2006 and <strong>in</strong>clude coord<strong>in</strong>ated<br />
studies funded by IEP, CALFED, <strong>the</strong> State Water Resources Control Board, and <strong>the</strong><br />
State Water Contractors and San Luis & Delta-Mendota Water Authority. Most studies<br />
are ongo<strong>in</strong>g or just start<strong>in</strong>g <strong>in</strong> 2009. The results summarized here are prelim<strong>in</strong>ary at this<br />
time and most have not yet been published <strong>in</strong> peer-reviewed journals. All <strong>in</strong>terpretation<br />
and application <strong>of</strong> <strong>the</strong>se prelim<strong>in</strong>ary results needs to proceed with caution.<br />
<strong>Ammonia</strong>/Ammonium Sources, Concentrations, Fate and Transport<br />
In water, ammonia primarily exists <strong>in</strong> two forms, un-ionized ammonia (NH3) and<br />
ammonium ion (NH4 + ), which are <strong>in</strong> equilibrium accord<strong>in</strong>g to NH4 + ↔ NH3 + H + . The<br />
equilibrium between ammonium and un-ionized ammonia depends primarily on pH, and<br />
also on temperature and sal<strong>in</strong>ity. Collectively, ammonium and un-ionized ammonia are<br />
<strong>of</strong>ten referred to as total ammonia or sometimes simply ammonia (although this can<br />
lead to confusion). Un-ionized ammonia is a gas that is toxic to animals and occurs <strong>in</strong><br />
<strong>the</strong> water and <strong>in</strong> <strong>the</strong> air. Ammonium ion is an important nutrient for plants and algae that<br />
is dissolved <strong>in</strong> water. Both ammonium and un-ionized ammonia are present <strong>in</strong> effluent<br />
from wastewater treatment plants that employ secondary treatment methods, but also <strong>in</strong><br />
some types <strong>of</strong> agricultural run-<strong>of</strong>f from <strong>the</strong> use <strong>of</strong> nitrogenous fertilizers and atmospheric<br />
depositions. Many hydrodynamic, chemical and biological processes affect <strong>the</strong><br />
transport, fate, and effects <strong>of</strong> un-ionized ammonia and ammonium after discharge <strong>in</strong>to<br />
waterways.<br />
The IEP Environmental Monitor<strong>in</strong>g Program (EMP) has been monitor<strong>in</strong>g ammonium<br />
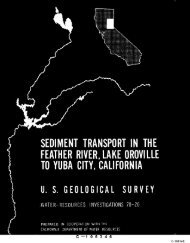
concentrations at monthly or biweekly <strong>in</strong>tervals at 10 stations <strong>in</strong> <strong>the</strong> Delta and Suisun<br />
Bay s<strong>in</strong>ce 1975. Refer to Figure 1 for a map <strong>of</strong> <strong>the</strong> sampl<strong>in</strong>g locations and Figure 2 for<br />
<strong>the</strong> total ammonia concentrations at stations where ammonia data were available<br />
2
Overview <strong>of</strong> Studies <strong>of</strong> <strong>Ammonia</strong> 2 March 2009<br />
<strong>Sacramento</strong>-San Joaqu<strong>in</strong> Delta<br />
through 2008. Median concentrations (1975-2006) and annual trend magnitudes <strong>of</strong><br />
ammonium and o<strong>the</strong>r dissolved nutrients monitored simultaneously by <strong>the</strong> EMP at each<br />
location as well as median nitrate to ammonium ratios and <strong>the</strong>ir annual trends are<br />
provided <strong>in</strong> Figure 3. Figure 4 shows calculated un-ionized ammonia concentrations at<br />
IEP monitor<strong>in</strong>g stations for 1975-1995. The EMP did not collect simultaneous pH<br />
measurements after 1995, so it is not possible to calculate un-ionized ammonia and<br />
compare ambient levels to United States Environmental Protection Agency (US EPA)<br />
(1999) acute and chronic criteria at <strong>the</strong>se stations after 1995. The ambient ammonia<br />
concentrations are below <strong>the</strong> US EPA acute and chronic ammonia criteria.<br />
The <strong>Sacramento</strong> Regional Wastewater Treatment Plant (SRWTP) is <strong>the</strong> largest po<strong>in</strong>t<br />
source <strong>of</strong> ammonium and ammonia <strong>in</strong> <strong>the</strong> Delta. The SRWTP’s output has <strong>in</strong>creased<br />
with human population growth (Figure 5) and it has contributed to an <strong>in</strong>crease <strong>in</strong><br />
ammonium concentrations <strong>in</strong> <strong>the</strong> Delta downstream <strong>of</strong> <strong>the</strong> discharge. The discharge<br />
from <strong>the</strong> SRWTP accounts for 90% <strong>of</strong> <strong>the</strong> ammonium load <strong>in</strong> <strong>the</strong> <strong>Sacramento</strong> River at<br />
Hood (Jassby 2008). The Central Valley Regional Water Board’s current total ammonia<br />
requirements for <strong>the</strong> SRWTP are based on <strong>the</strong> US EPA (1999) aquatic toxicity guidance<br />
that is designed to protect <strong>the</strong> most sensitive aquatic species. The receiv<strong>in</strong>g<br />
environment downstream <strong>of</strong> SRWTP’s effluent discharge is <strong>in</strong> compliance with <strong>the</strong> US<br />
EPA ammonia criteria (Figure 6). When writ<strong>in</strong>g a permit, Regional Water Board staff<br />
evaluates effluent concentrations, concentrations <strong>of</strong> total ammonia already <strong>in</strong> <strong>the</strong> river<br />
and available dilution. Limitations <strong>in</strong> permits are, <strong>the</strong>refore, site specific. The SRWTP’s<br />
permit allows for discharge <strong>of</strong> relatively high concentrations <strong>of</strong> total ammonia because<br />
<strong>the</strong> <strong>Sacramento</strong> River provides considerable dilution. SRWTP uses large storage<br />
bas<strong>in</strong>s to hold wastewater for short periods <strong>of</strong> time when <strong>the</strong>re is not sufficient dilution <strong>in</strong><br />
<strong>the</strong> river because <strong>of</strong> reverse tidal flows. Additional sources <strong>of</strong> ammonium to <strong>the</strong> Delta<br />
and Suisun Bay <strong>in</strong>clude o<strong>the</strong>r wastewater treatment plants, agricultural run-<strong>of</strong>f,<br />
atmospheric deposition, <strong>in</strong>ternal cycl<strong>in</strong>g, and possibly discharges from wetlands.<br />
In additional to <strong>the</strong> IEP, several o<strong>the</strong>r programs and <strong>in</strong>vestigators are collect<strong>in</strong>g<br />
ammonium and associated water quality data from around <strong>the</strong> Delta (e.g., DWR-<br />
Municipal Water Quality Investigation stations, USGS monitor<strong>in</strong>g stations, NPDES<br />
permit receiv<strong>in</strong>g water monitor<strong>in</strong>g stations, and ongo<strong>in</strong>g extensive UC Davis research).<br />
Various entities are currently compil<strong>in</strong>g a summary <strong>of</strong> sources and concentrations <strong>of</strong><br />
ammonium <strong>in</strong> <strong>the</strong> Delta based on readily available data collected by exist<strong>in</strong>g monitor<strong>in</strong>g<br />
programs. The goals <strong>of</strong> <strong>the</strong>se compilations are to better characterize sources, trends,<br />
and data gaps, and to support development <strong>of</strong> an ammonium fate and transport model.<br />
Additional work may be needed to improve hydrodynamic model<strong>in</strong>g and conduct more<br />
<strong>in</strong>-depth <strong>in</strong>vestigations <strong>of</strong> chemical, biological, and hydrodynamic conversion and mix<strong>in</strong>g<br />
rates downstream <strong>of</strong> discharge po<strong>in</strong>ts and throughout <strong>the</strong> Delta and Suisun Bay.<br />
The Central Valley Regional Water Board is currently develop<strong>in</strong>g an ammonia sampl<strong>in</strong>g<br />
program for <strong>the</strong> Delta. The purpose <strong>of</strong> this study is to collect additional nutrient data,<br />
<strong>in</strong>clud<strong>in</strong>g ammonium and un-ionized ammonia, for <strong>the</strong> Delta to determ<strong>in</strong>e whe<strong>the</strong>r<br />
ambient concentrations are potentially toxic, and to support development <strong>of</strong> a fate and<br />
transport model. A spatial emphasis is placed on <strong>the</strong> lower <strong>Sacramento</strong> River and<br />
3
Overview <strong>of</strong> Studies <strong>of</strong> <strong>Ammonia</strong> 2 March 2009<br />
<strong>Sacramento</strong>-San Joaqu<strong>in</strong> Delta<br />
nor<strong>the</strong>rn Delta as ammonia levels from <strong>the</strong> SRWTP are likely to be highest here.<br />
However, o<strong>the</strong>r areas <strong>of</strong> <strong>the</strong> San Francisco Estuary are also proposed for sampl<strong>in</strong>g as<br />
SRWTP is not <strong>the</strong> only source <strong>of</strong> ammonia/ammonium.<br />
Outstand<strong>in</strong>g Questions<br />
• What are <strong>the</strong> relative contributions <strong>of</strong> various ammonia and ammonium sources<br />
to <strong>the</strong> Delta?<br />
• What transport processes affect <strong>the</strong> distribution <strong>of</strong> nutrients, <strong>in</strong>clud<strong>in</strong>g<br />
ammonium, with<strong>in</strong> <strong>the</strong> Delta and Suisun Bay under vary<strong>in</strong>g river discharge and<br />
tidal forc<strong>in</strong>g?<br />
• What physical, chemical, and biological processes most strongly affect <strong>the</strong><br />
distribution and concentration <strong>of</strong> ammonium <strong>in</strong> <strong>the</strong> Delta and Suisun Bay?<br />
Ammonium Effects on Delta Food Web<br />
This section <strong>in</strong>cludes discussion <strong>of</strong> potential effects on Delta phytoplankton as well as<br />
on <strong>the</strong> prevalence <strong>of</strong> harmful algal blooms and <strong>in</strong>vasive aquatic plants. These will be<br />
discussed as part <strong>of</strong> <strong>the</strong> food web effects dur<strong>in</strong>g <strong>the</strong> March 2009 workshop.<br />
<strong>Ammonia</strong> Effects on Delta Phytoplankton<br />
Primary production rates and stand<strong>in</strong>g chlorophyll a levels associated with<br />
phytoplankton (open water algae) <strong>in</strong> <strong>the</strong> Delta and Suisun Bay are among <strong>the</strong> lowest <strong>of</strong><br />
all <strong>the</strong> major estuaries <strong>in</strong> <strong>the</strong> world (Table 1, Figure 7) (Cloern and Jassby 2008, Jassby<br />
2008, Boynton et al. 1982, Jassby et al. 2002). Chlorophyll a and primary productivity<br />
levels <strong>in</strong> <strong>the</strong> Delta decl<strong>in</strong>ed from 1975 to 1995, but have <strong>in</strong>creased significantly from<br />
1996-2005 while Suisun Bay levels rema<strong>in</strong>ed relatively unchanged over <strong>the</strong> last decade<br />
(Jassby et al. 2002, Jassby 2008).<br />
Table 1. Five-year medians <strong>of</strong> March–November chlorophyll a (Chl-a) and suspended particulate<br />
matter (SPM) concentrations and for phytoplankton gross primary production (GPP) estimates for<br />
Suisun Bay (Stations D6, D7, and D8) and <strong>the</strong> Delta (Stations C3, D4, C10, P8, D26, MD10, and<br />
D28). See Figure 1 for locations. Reproduction <strong>of</strong> Table 4 <strong>in</strong> Jassby 2008.<br />
4
Overview <strong>of</strong> Studies <strong>of</strong> <strong>Ammonia</strong> 2 March 2009<br />
<strong>Sacramento</strong>-San Joaqu<strong>in</strong> Delta<br />
The composition <strong>of</strong> <strong>the</strong> phytoplankton community has generally shifted from diatoms<br />
toward green algae, cyanobacteria, and miscellaneous flagellate species (Lehman<br />
2000). Blooms <strong>of</strong> Microcystis aerug<strong>in</strong>osa, a cyanobacterial harmful algal bloom (CHAB)<br />
species that can produce toxic substances, have been observed <strong>in</strong> Delta waters s<strong>in</strong>ce<br />
1999 (Lehman et al. 2005). The changes <strong>in</strong> phytoplankton composition and especially<br />
<strong>the</strong> now regularly occurr<strong>in</strong>g Microcystis blooms have been implicated as possible<br />
factors <strong>in</strong> <strong>the</strong> decl<strong>in</strong>e <strong>of</strong> important Delta pelagic fish species <strong>in</strong>clud<strong>in</strong>g delta smelt (IEP<br />
2008), but <strong>the</strong> connection with ammonia is not clear.<br />
Low light availability and high graz<strong>in</strong>g rates have been identified as important factors<br />
controll<strong>in</strong>g overall phytoplankton production and biomass <strong>in</strong> <strong>the</strong> Delta. Much <strong>of</strong> <strong>the</strong><br />
<strong>in</strong>terannual variation can be attributed to precipitation and associated river flows (Cloern<br />
2001, Jassby et al. 2002, Lehman 2004). Nutrients are generally thought to be <strong>of</strong> lesser<br />
importance <strong>in</strong> this turbid, nutrient-rich estuary, although one study (Van Nieuwenhuyse<br />
2007) found an association between an abrupt decl<strong>in</strong>e <strong>in</strong> total phosphorus<br />
concentrations due to reductions <strong>in</strong> urban phosphorus discharges <strong>in</strong> <strong>the</strong> mid-1990s and<br />
a decl<strong>in</strong>e <strong>in</strong> chlorophyll a levels at three Delta stations (D26, D28A, and MD10 <strong>in</strong> Figure<br />
1).<br />
Ammonium is known as an important, but also “paradoxical” nutrient (Britto and<br />
Kronzucker 2002) because it can stimulate plant growth, but also suppress plant uptake<br />
<strong>of</strong> ano<strong>the</strong>r important nutrient, nitrate, and ultimately suppress growth <strong>of</strong> some sensitive<br />
plants. This type <strong>of</strong> sensitivity to ammonium is well established for many agricultural<br />
crops. Two recently published studies, show that high ammonium levels (>4 µmol L -1 or<br />
~0.056 mg L -1 ) <strong>in</strong> Suisun Bay, once considered one <strong>of</strong> <strong>the</strong> most productive areas <strong>of</strong> <strong>the</strong><br />
San Francisco Estuary, can suppress <strong>the</strong> growth <strong>of</strong> phytoplankton <strong>in</strong> this area even<br />
when <strong>the</strong>re is sufficient light (Dugdale et al. 2007, Wilkerson et al. 2006). Diatoms<br />
appear to be particularly affected by relatively low levels <strong>of</strong> ammonium <strong>in</strong> Suisun Bay. It<br />
is not known whe<strong>the</strong>r <strong>the</strong> same effect is manifested <strong>in</strong> <strong>the</strong> freshwater portions <strong>of</strong> <strong>the</strong><br />
Delta.<br />
Pilot level <strong>in</strong>vestigations conducted by <strong>the</strong> Dugdale and Wilkerson Laboratory <strong>in</strong> 2007<br />
and 2008 have repeatedly shown suppression <strong>of</strong> phytoplankton growth <strong>in</strong> <strong>the</strong> lower<br />
<strong>Sacramento</strong> River near Rio Vista and a site on <strong>the</strong> lower San Joaqu<strong>in</strong> River<br />
downstream <strong>of</strong> Stockton. However, two tests conducted <strong>in</strong> 2008 with <strong>Sacramento</strong> River<br />
water collected near <strong>the</strong> discharge po<strong>in</strong>t <strong>of</strong> <strong>the</strong> SRWTP showed good phytoplankton<br />
growth <strong>in</strong> spite <strong>of</strong> high ammonium concentrations. The reasons for different growth<br />
responses <strong>in</strong> <strong>the</strong> <strong>Sacramento</strong> River near <strong>the</strong> SRWTP discharge compared to samples<br />
near Rio Vista and from <strong>the</strong> San Joaqu<strong>in</strong> River stations are unclear and <strong>in</strong>vestigations<br />
will cont<strong>in</strong>ue with <strong>in</strong>creased <strong>in</strong>tensity <strong>in</strong> 2009.<br />
Outstand<strong>in</strong>g Questions<br />
• To what extent, if any, and potentially where and when does nitrate uptake<br />
<strong>in</strong>hibition by ammonium affect algal productivity and/or community composition <strong>in</strong><br />
<strong>the</strong> Delta and Suisun Bay?<br />
5
Overview <strong>of</strong> Studies <strong>of</strong> <strong>Ammonia</strong> 2 March 2009<br />
<strong>Sacramento</strong>-San Joaqu<strong>in</strong> Delta<br />
• How do o<strong>the</strong>r factors that affect algal growth and community composition <strong>in</strong>teract<br />
with nitrate uptake <strong>in</strong>hibition by ammonium?<br />
• What are responses <strong>of</strong> phytoplankton growth rates and community structure to<br />
spatial and temporal differences <strong>in</strong> nutrient concentrations and ratios?<br />
Ammonium Effects on Harmful Algal Blooms and Invasive Aquatic Plants<br />
Elevated ammonium concentrations potentially contribute to harmful algal blooms (e.g.,<br />
Microcystis) that have been occurr<strong>in</strong>g with <strong>in</strong>creas<strong>in</strong>g frequency and biomass <strong>in</strong> some<br />
parts <strong>of</strong> <strong>the</strong> Delta (Lehman et al. 2005). A recent study <strong>in</strong> <strong>the</strong> San Francisco Estuary<br />
found that low stream flow and high water temperature were strongly correlated with <strong>the</strong><br />
seasonal variation <strong>of</strong> Microcystis cell density, total microcyst<strong>in</strong>s concentration (cell -1 )<br />
and total microcyst<strong>in</strong>s concentration (chl a -1 ), while ambient nutrient concentrations and<br />
ratios were <strong>of</strong> secondary importance (Lehman et al. 2008).<br />
As has been shown elsewhere, elevated levels <strong>of</strong> ammonium and o<strong>the</strong>r nutrients may<br />
also benefit <strong>in</strong>vasive rooted and float<strong>in</strong>g aquatic plants <strong>in</strong> <strong>the</strong> Delta, such as <strong>the</strong> water<br />
hyac<strong>in</strong>th (Eichhornia crassipes) and <strong>the</strong> Brazilian waterweed (Egeria densa) (Reddy<br />
and Tucker 1983, Feijoó et al. 2002). Both species are now widely distributed across<br />
<strong>the</strong> Delta (Hestir et al. 2008) and are controlled <strong>in</strong> Delta channels through chemical<br />
herbicides and mechanical removal by <strong>the</strong> California Department <strong>of</strong> Boat<strong>in</strong>g and<br />
Waterways.<br />
Outstand<strong>in</strong>g Questions<br />
• To what extent, if any, and potentially where and when does ammonium<br />
contribute to harmful algal blooms <strong>in</strong> <strong>the</strong> Delta and Suisun Bay?<br />
• To what extent, if any, and potentially where and when does ammonium<br />
contribute to <strong>the</strong> spread <strong>of</strong> <strong>in</strong>vasive aquatic plants <strong>in</strong> <strong>the</strong> Delta and Suisun Bay?<br />
Toxicity <strong>of</strong> <strong>Ammonia</strong> to Delta Fish and Invertebrates<br />
<strong>Ammonia</strong> Effects on Delta Smelt<br />
In 2008, UC Davis Aquatic Toxicology Laboratory (UCD ATL) conducted a pilot study to<br />
assess <strong>the</strong> potential acute toxicity <strong>of</strong> ammonia and treated wastewater effluent from <strong>the</strong><br />
SRWTP to larval delta smelt. The bioassay results suggest that ammonia<br />
concentrations present <strong>in</strong> <strong>the</strong> <strong>Sacramento</strong> River below <strong>the</strong> SRWTP were not acutely<br />
toxic to 55-day old delta smelt (Werner et al. 2009). The results from this study were<br />
consistent with total ammonia and un-ionized ammonia effect concentrations<br />
established for 50-day old delta smelt us<strong>in</strong>g filtered hatchery water (UCD ATL,<br />
unpublished data; Werner et al. 2009). The delta smelt 96-hour no observed effect<br />
concentration (NOEC), lowest observed effect concentration (LOEC), lethal<br />
concentration-50 (LC50), and LC10 for total ammonia and un-ionized ammonia are<br />
presented <strong>in</strong> Table 2. At 50 days old, delta smelt are about as sensitive to total<br />
ammonia and un-ionized ammonia as salmonid species, and about >5-fold more<br />
sensitive than larval fa<strong>the</strong>ad m<strong>in</strong>now (UCD ATL, unpublished data; Werner et al. 2009),<br />
6
Overview <strong>of</strong> Studies <strong>of</strong> <strong>Ammonia</strong> 2 March 2009<br />
<strong>Sacramento</strong>-San Joaqu<strong>in</strong> Delta<br />
a common toxicity test species used by <strong>the</strong> SRWTP and o<strong>the</strong>r dischargers <strong>in</strong><br />
accordance with <strong>the</strong>ir discharge permits.<br />
Table 2. Delta smelt 96-hour NOEC, LOEC, LC50, and LC10 for total ammonia and un-ionized<br />
ammonia (pH 7.9, T=16ºC) 1<br />
<strong>Ammonia</strong> Species<br />
Toxicological Endpo<strong>in</strong>ts (mg/L)<br />
NOEC LOEC LC10 LC50<br />
Total ammonia-nitrogen 5.0 9.0 4.0 12.0<br />
Un-ionized ammonia 0.066 0.105 0.067 0.147<br />
1<br />
Sources: Werner et al. 2008a, Werner et al. 2009<br />
<strong>Ammonia</strong> may contribute to <strong>the</strong> POD if its concentrations <strong>in</strong> Delta waters are high<br />
enough to cause direct toxicity to <strong>the</strong> POD fishes or <strong>the</strong>ir food organisms. It is well<br />
known that salmonids are particularly sensitive to ammonia (US EPA 1999). In general,<br />
un-ionized ammonia levels <strong>in</strong> <strong>the</strong> Delta appear to be too low to cause acute mortality <strong>of</strong><br />
even <strong>the</strong> most sensitive species.<br />
Questions rema<strong>in</strong> about <strong>the</strong> potential for chronic (i.e., long-term, sub-lethal) impacts<br />
from ammonia as well as <strong>the</strong> impacts <strong>in</strong> sensitive delta smelt spawn<strong>in</strong>g areas (e.g.,<br />
Cache Slough). Un-ionized ammonia concentrations <strong>in</strong> <strong>the</strong> Delta do exceed levels<br />
where histopathological effects have been observed (US EPA 1999); however, it is<br />
unclear whe<strong>the</strong>r <strong>the</strong>se effects translate to effects on survival, growth or reproduction. In<br />
addition, <strong>the</strong>re is some evidence that actively swimm<strong>in</strong>g and unfed fish may be several<br />
times more sensitive to ambient un-ionized ammonia levels than <strong>the</strong>se laboratory<br />
exposures <strong>in</strong>dicate (Eddy 2005).<br />
There may be a potential for toxic ammonia levels to be reached <strong>in</strong> very productive<br />
areas <strong>in</strong> <strong>the</strong> sou<strong>the</strong>rn Delta or smaller productive sloughs or shallow areas throughout<br />
<strong>the</strong> Delta, when high concentrations <strong>of</strong> un-ionized ammonia co<strong>in</strong>cide with warm<br />
temperatures and elevated pH (phytoplankton productivity <strong>in</strong>creases pH that <strong>in</strong>fluences<br />
how much un-ionized ammonia is present). The relatively few ammonium, temperature,<br />
and pH data available <strong>in</strong> many <strong>of</strong> <strong>the</strong>se areas are currently be<strong>in</strong>g compiled and<br />
evaluated.<br />
In addition, <strong>the</strong> potential for comb<strong>in</strong>ed effects <strong>of</strong> un-ionized ammonia with o<strong>the</strong>r<br />
toxicants and stressors, and differences <strong>in</strong> fish sensitivity depend<strong>in</strong>g on health status,<br />
age, and physiological state add uncerta<strong>in</strong>ty to data analyses. While un-ionized<br />
ammonia <strong>in</strong>teractions with o<strong>the</strong>r toxicants and variable sensitivity have been<br />
demonstrated for a variety <strong>of</strong> species (e.g., Eddy 2005, Camargo and Alonso 2006),<br />
similar studies for <strong>the</strong> POD fishes are <strong>in</strong> <strong>the</strong>ir <strong>in</strong>itial stage. Much more work is needed<br />
to reduce <strong>the</strong> many uncerta<strong>in</strong>ties about chronic toxicity effects <strong>of</strong> ammonia on <strong>the</strong> POD<br />
fishes <strong>in</strong> various Delta regions and discern population level effects.<br />
7
Overview <strong>of</strong> Studies <strong>of</strong> <strong>Ammonia</strong> 2 March 2009<br />
<strong>Sacramento</strong>-San Joaqu<strong>in</strong> Delta<br />
<strong>Ammonia</strong> Effects on Delta <strong>in</strong>vertebrates<br />
Invertebrates are generally considered less acutely sensitive to un-ionized ammonia<br />
toxicity than fish (US EPA 1999), and direct toxicity effects are thus not very likely at <strong>the</strong><br />
current un-ionized ammonia levels throughout most <strong>of</strong> <strong>the</strong> Delta. A recent review article<br />
by Camargo and Alonso (2006), however, does show that juvenile mollusks are<br />
sensitive at levels below sensitivity levels for salmonids. The US EPA (1999) derived<br />
Genus Mean Chronic Values (GMCVs) show that Hyalella azteca, a resident amphipod<br />
species <strong>in</strong> <strong>the</strong> Delta, is <strong>the</strong> most sensitive species <strong>in</strong> that assessment. The UCD ATL<br />
performs 10-day Hyalella azteca bioassays with waters collected from <strong>the</strong> Delta and<br />
Suisun Bay on a bi-weekly basis. Site-specific water quality parameters also are<br />
monitored <strong>in</strong> <strong>the</strong> field at <strong>the</strong> time <strong>of</strong> sampl<strong>in</strong>g and provide a valuable database for which<br />
to evaluate <strong>the</strong> conditions and effects <strong>of</strong> ambient surface waters (Werner et al. 2008b).<br />
Hyalella azteca toxicity tests will cont<strong>in</strong>ue <strong>in</strong> 2009.<br />
Outstand<strong>in</strong>g Questions<br />
• To what extent, if any, does ammonia cause acute, chronic, or sub-lethal<br />
effects to Delta fish and <strong>in</strong>vertebrate species <strong>in</strong> sensitive Delta habitats?<br />
• To what extent, if any, do significant <strong>in</strong>teractive effects between ammonia and<br />
o<strong>the</strong>r toxicants or stressors occur that affect Delta fish or <strong>in</strong>vertebrate<br />
species?<br />
• Do ambient total ammonia concentrations ever exceed <strong>the</strong> US EPA (1999)<br />
chronic or acute ammonia criteria?<br />
• Are <strong>the</strong> US EPA (1999) chronic and acute ammonia criteria adequately<br />
protective for Delta and Suisun Bay species?<br />
• How can biomarkers be <strong>in</strong>corporated <strong>in</strong>to monitor<strong>in</strong>g programs to assess sublethal<br />
effects?<br />
8
Overview <strong>of</strong> Studies <strong>of</strong> <strong>Ammonia</strong> 2 March 2009<br />
<strong>Sacramento</strong>-San Joaqu<strong>in</strong> Delta<br />
San Francisco Estuary<br />
San<br />
Pablo<br />
Bay<br />
IEP Long-Term Water Quality<br />
Monitor<strong>in</strong>g Station<br />
Wastewater Treatment Plant<br />
with Secondary N Treatment<br />
Wastewater Treatment Plant<br />
with Tertiary N Treatment<br />
Suisun<br />
Bay<br />
D6<br />
D7<br />
D8<br />
San Francisco<br />
Bay<br />
Antioch<br />
Kilometers<br />
0 20<br />
9<br />
Delta<br />
Rio Vista<br />
D4<br />
SWP & CVP<br />
Pump<strong>in</strong>g Plants<br />
<strong>Sacramento</strong><br />
River<br />
D19<br />
D28A<br />
N<br />
D26<br />
<strong>Sacramento</strong><br />
<strong>Sacramento</strong><br />
Regional WWTP<br />
C3 Delta Cross<br />
Channel<br />
P8<br />
MD10<br />
C10<br />
Stockton<br />
Stockton WWTP<br />
San Joaqu<strong>in</strong><br />
River<br />
Figure 1. Map <strong>of</strong> <strong>the</strong> San Francisco Estuary show<strong>in</strong>g <strong>the</strong> Delta region (green) and Bays<br />
as well as long-term IEP water quality monitor<strong>in</strong>g stations and wastewater treatment<br />
plant discharge locations <strong>in</strong> <strong>the</strong> Delta and Suisun Bay regions.
<strong>Ammonia</strong> (mg--N/L)<br />
<strong>Ammonia</strong> (mg--N/L)<br />
<strong>Ammonia</strong> (mg--N/L)<br />
Overview <strong>of</strong> Studies <strong>of</strong> <strong>Ammonia</strong> 2 March 2009<br />
<strong>Sacramento</strong>-San Joaqu<strong>in</strong> Delta<br />
Figure 2. Ambient total ammonia concentrations (mg-N/L) from surface water grab sample (3 ft depth) at<br />
<strong>the</strong> IEP Environmental Monitor<strong>in</strong>g Program (EMP) locations for which data are available through 2008.<br />
IEP reported <strong>the</strong>se values as total ammonia from 1975-1978 us<strong>in</strong>g method EPA 350.2. 1979-2008<br />
values were reported as dissolved ammonia us<strong>in</strong>g method EPA 350.1. Note <strong>the</strong> variable scales <strong>of</strong> each yaxis.<br />
10<br />
A<br />
C D<br />
E F<br />
B
<strong>Ammonia</strong> (mg--N/L)<br />
<strong>Ammonia</strong> (mg--N/L)<br />
Overview <strong>of</strong> Studies <strong>of</strong> <strong>Ammonia</strong> 2 March 2009<br />
<strong>Sacramento</strong>-San Joaqu<strong>in</strong> Delta<br />
<strong>Ammonia</strong> (mg--N/L)<br />
Figure 2 (cont<strong>in</strong>ued). Ambient total ammonia concentrations (mg-N/L) from surface water grab<br />
sample (3 ft depth) at <strong>the</strong> IEP Environmental Monitor<strong>in</strong>g Program (EMP) locations for which data are<br />
available through 2008. IEP reported <strong>the</strong>se values as total ammonia from 1975-1978 us<strong>in</strong>g method<br />
EPA 350.2. 1979-2008 values were reported as dissolved ammonia us<strong>in</strong>g method EPA 350.1. Note<br />
<strong>the</strong> variable scales <strong>of</strong> each y-axis.<br />
11<br />
G H<br />
I<br />
K<br />
J
Overview <strong>of</strong> Studies <strong>of</strong> <strong>Ammonia</strong> 2 March 2009<br />
<strong>Sacramento</strong>-San Joaqu<strong>in</strong> Delta<br />
Bars: Median Concentration (mg L -1 )<br />
Bars: Median Ratio<br />
0.35<br />
0.25<br />
0.15<br />
0.05<br />
-0.05<br />
-0.15<br />
-0.25<br />
-0.35<br />
2<br />
1.5<br />
1<br />
0.5<br />
0<br />
-0.5<br />
24<br />
20<br />
16<br />
12<br />
8<br />
4<br />
0<br />
-4<br />
-8<br />
a) Ammonium<br />
C3 D4 D7 D6 D8 D26 D28A MD10 P8 C10<br />
Concentration at LTS<br />
b) Nitrate + Nitrite<br />
Uptrend<br />
C3 D4 D7 D6 D8 D26 D28A MD10 P8 C10<br />
0.59<br />
NS Trend<br />
Downtrend<br />
North Delta<br />
& Suisun Bay<br />
Ratio at LTS<br />
c) NO:NH Ratio<br />
Uptrend<br />
NS Trend<br />
Downtrend<br />
12<br />
Central &<br />
South Delta<br />
C3 D4 D7 D6 D8 D26 D28A MD10 P8 C10<br />
Median Concentration Uptrend NS Trend Downtrend<br />
9<br />
7<br />
5<br />
3<br />
1<br />
-1<br />
-3<br />
-5<br />
-7<br />
-9<br />
6<br />
4.5<br />
3<br />
1.5<br />
0<br />
-1.5<br />
18<br />
15<br />
12<br />
9<br />
6<br />
3<br />
0<br />
-3<br />
-6<br />
Symbols: Trend Magnitude (% year -1 )<br />
Figure 3. Median magnitudes (columns) and annual trends (symbols) for concentrations<br />
<strong>of</strong> a) ammonium, b) nitrate + nitrite, c) <strong>the</strong> ratios <strong>of</strong> nitrate + nitrite (NO) to ammonium<br />
(NH) at long-term IEP EMP monitor<strong>in</strong>g stations throughout <strong>the</strong> lower <strong>Sacramento</strong> River,<br />
Suisun Bay, and Delta regions <strong>of</strong> <strong>the</strong> San Francisco Estuary from 1975 to 2006. Trends<br />
were estimated and tested with USGS "Estrend" for S-plus us<strong>in</strong>g seasonal Kendall tests<br />
with months as seasons and no flow adjustment (because actual concentrations were <strong>of</strong><br />
<strong>in</strong>terest here). For station locations see Figure 1. Data and metadata are available at<br />
http://www.baydelta.water.ca.gov/emp//.
Overview <strong>of</strong> Studies <strong>of</strong> <strong>Ammonia</strong> 2 March 2009<br />
<strong>Sacramento</strong>-San Joaqu<strong>in</strong> Delta<br />
Bars: Median Concentration (mg L -1 )<br />
16<br />
11<br />
6<br />
1<br />
-4<br />
-9<br />
0.25<br />
0.2<br />
0.15<br />
0.1<br />
0.05<br />
0<br />
-0.05<br />
-0.1<br />
-0.15<br />
-0.2<br />
-0.25<br />
C3 D4 D7 D6 D8 D26 D28A MD10 P8 C10<br />
d) Silica<br />
Concentration at LTS Uptrend<br />
NS Trend Downtrend<br />
Concentration at LTS Uptrend<br />
NS Trend Downtrend<br />
C3 D4 D7 D6 D8 D26 D28A MD10 P8 C10<br />
e) Orthophosphate<br />
Median Concentration Uptrend NS Trend Downtrend<br />
13<br />
2<br />
1.5<br />
1<br />
0.5<br />
0<br />
-0.5<br />
-1<br />
5<br />
4<br />
3<br />
2<br />
1<br />
0<br />
-1<br />
-2<br />
-3<br />
-4<br />
-5<br />
Symbols: Trend Magnitude (% year -1 )<br />
Figure 3 (cont<strong>in</strong>ued). Median magnitudes (columns) and annual trends (symbols) for<br />
concentrations <strong>of</strong> d) silica and e) orthophosphate.
Un-ionized <strong>Ammonia</strong> (mg/L)<br />
Un-ionized <strong>Ammonia</strong> (mg/L)<br />
Un-ionized <strong>Ammonia</strong> (mg/L)<br />
Overview <strong>of</strong> Studies <strong>of</strong> <strong>Ammonia</strong> 2 March 2009<br />
<strong>Sacramento</strong>-San Joaqu<strong>in</strong> Delta<br />
A<br />
C D<br />
E F<br />
Figure 4. Calculated ambient un-ionized ammonia concentrations (mg/L) from surface water grab<br />
samples (3 ft depth) at <strong>the</strong> IEP Environmental Monitor<strong>in</strong>g Program (EMP) locations for which<br />
concurrent pH and temperature data were available through 1995. Note that concentrations were not<br />
adjusted for sal<strong>in</strong>ity which could lower values up to 15% at 32 ppt (almost seawater). Also note <strong>the</strong><br />
variable scales <strong>of</strong> each y-axis.<br />
14<br />
B
Un-ionized <strong>Ammonia</strong> (mg/L)<br />
Un-ionized <strong>Ammonia</strong> (mg/L)<br />
Overview <strong>of</strong> Studies <strong>of</strong> <strong>Ammonia</strong> 2 March 2009<br />
<strong>Sacramento</strong>-San Joaqu<strong>in</strong> Delta<br />
Un-ionized <strong>Ammonia</strong> (mg/L)<br />
G H<br />
I<br />
Figure 4 (cont<strong>in</strong>ued). Calculated ambient un-ionized ammonia concentrations (mg/L) from surface<br />
water grab samples (3 ft depth) at <strong>the</strong> IEP Environmental Monitor<strong>in</strong>g Program (EMP) locations for<br />
which concurrent pH and temperature data were available through 1995. Note that concentrations<br />
were not adjusted for sal<strong>in</strong>ity which could lower values up to 15% at 32 ppt (almost seawater). Also<br />
note <strong>the</strong> variable scales <strong>of</strong> each y-axis.<br />
15<br />
K<br />
J
Overview <strong>of</strong> Studies <strong>of</strong> <strong>Ammonia</strong> 2 March 2009<br />
<strong>Sacramento</strong>-San Joaqu<strong>in</strong> Delta<br />
Figure 5. Reproduction <strong>of</strong> Figure 15 from Jassby (2008).<br />
16
Overview <strong>of</strong> Studies <strong>of</strong> <strong>Ammonia</strong> 2 March 2009<br />
<strong>Sacramento</strong>-San Joaqu<strong>in</strong> Delta<br />
Figure 6. Ambient concentrations <strong>of</strong> total ammonia (mg-N/L) <strong>in</strong> <strong>the</strong> <strong>Sacramento</strong> River<br />
downstream from <strong>the</strong> SRWTP outfall compared to <strong>the</strong> EPA acute and chronic toxicity<br />
criteria. Ambient concentrations are from surface grab samples at monitor<strong>in</strong>g stations <strong>of</strong><br />
<strong>the</strong> <strong>Sacramento</strong> Regional County Sanitary District (SRCSD) Ambient Monitor<strong>in</strong>g Program<br />
(R-3, weekly) or Coord<strong>in</strong>ated Monitor<strong>in</strong>g Program (RM44, monthly). The acute criterion for<br />
both stations was calculated us<strong>in</strong>g <strong>the</strong> field pH and water temperature associated with each<br />
grab sample. The chronic criteria for R-3 were calculated for each sampl<strong>in</strong>g event us<strong>in</strong>g<br />
30-day runn<strong>in</strong>g averages for field pH and temperature. The chronic criteria for RM44 were<br />
calculated us<strong>in</strong>g <strong>the</strong> field pH and temperature associated with <strong>the</strong> monthly grab samples.<br />
17
Overview <strong>of</strong> Studies <strong>of</strong> <strong>Ammonia</strong> 2 March 2009<br />
<strong>Sacramento</strong>-San Joaqu<strong>in</strong> Delta<br />
350<br />
170<br />
80<br />
Lower Hudson: ~800<br />
Chesapeake: ~550<br />
Narrangansett:<br />
~300 g m -2 yr -1<br />
Delta PPr:<br />
~90 -160<br />
g m -2 yr -1<br />
(Jassby 2008)<br />
Figure 7. Primary production <strong>in</strong> <strong>the</strong> Delta and Suisun Bay plotted on <strong>the</strong><br />
relationship <strong>of</strong> fishery yield to primary production from o<strong>the</strong>r estuaries around <strong>the</strong><br />
world (modified from Nixon 1988, us<strong>in</strong>g data provided <strong>in</strong> Jassby 2008).<br />
18
Overview <strong>of</strong> Studies <strong>of</strong> <strong>Ammonia</strong> 2 March 2009<br />
<strong>Sacramento</strong>-San Joaqu<strong>in</strong> Delta<br />
Literature Cited<br />
Boynton, W.R., W.M. Kemp, and C.W. Keefe. 1982. A comparative analysis <strong>of</strong><br />
nutrients and o<strong>the</strong>r factors <strong>in</strong>fluenc<strong>in</strong>g estuar<strong>in</strong>e phytoplankton production, pp. 69-<br />
90. In V.S. Kennedy (ed.). Estuar<strong>in</strong>e Comparisons. Academic Press, New York.<br />
Britto, D.T. and H. J. Kronzucker. 2002. NH4 + toxicity <strong>in</strong> higher plants: A critical<br />
review. Journal <strong>of</strong> Plant Physiology 159:567-58.<br />
Camargo, J.A. and A. Alonso. 2006. Ecological and toxicological effects <strong>of</strong><br />
<strong>in</strong>organic nitrogen pollution <strong>in</strong> aquatic ecosystems: A global assessment.<br />
Environment International 32:831-849.<br />
Cloern, J.E. 2001. Our evolv<strong>in</strong>g conceptual model <strong>of</strong> <strong>the</strong> coastal eutrophication<br />
problem. Mar<strong>in</strong>e Ecology Progress Series 210:223-253.<br />
Cloern, J.E. and A.D. Jassby. 2008. Complex seasonal patterns <strong>of</strong> primary<br />
producers at <strong>the</strong> land-sea <strong>in</strong>terface. Ecology Letters 11:1-10.<br />
Dugdale, R.C., F.P. Wilkerson, V.E. Hogue, and A. Marchi. 2007. The role <strong>of</strong><br />
ammonium and nitrate <strong>in</strong> spr<strong>in</strong>g bloom development <strong>in</strong> San Francisco Bay.<br />
Estuar<strong>in</strong>e, Coastal and Shelf Science 73(1-2):17-29.<br />
Eddy, F.B. 2005. <strong>Ammonia</strong> <strong>in</strong> estuaries and effects on fish. Journal <strong>of</strong> Fish<br />
Biology 67:1495-1513.<br />
Feijoó, C., M.E. Garcia, F. Momo, and J. Toja. 2002. Nutrient absorption by <strong>the</strong><br />
submerged macrophyte Egeria densa Planch.: Effect <strong>of</strong> ammonium and<br />
phosphorous availability <strong>in</strong> <strong>the</strong> water column on growth and nutrient uptake.<br />
Limnetica 21(1-2):93-104.<br />
Hestir, E.L., S. Khanna, M.E. Andrew, M.J. Santos, J.H. Viers, J.A. Greenberg, S.S.<br />
Rajapakse, and S.L. Ust<strong>in</strong>. 2008. Identification <strong>of</strong> <strong>in</strong>vasive vegetation us<strong>in</strong>g<br />
hyperspectral remote sens<strong>in</strong>g <strong>in</strong> <strong>the</strong> California Delta ecosystem. Remote Sens<strong>in</strong>g<br />
<strong>of</strong> Environment 112(11):4034-4047.<br />
Interagency Ecological Program (IEP). 2008. Interagency Ecological Program<br />
2008 Work Plan to Evaluate <strong>the</strong> Decl<strong>in</strong>e <strong>of</strong> Pelagic Species <strong>in</strong> <strong>the</strong> Upper San<br />
Francisco Estuary. Available at:<br />
http://www.science.calwater.ca.gov/pdf/workshops/POD/POD_Workplan_2008_060<br />
208.pdf<br />
Jassby, A.D., J.E. Cloern, B.E. Cole. 2002. Annual primary production: patterns and<br />
mechanisms <strong>of</strong> change <strong>in</strong> a nutrient-rich tidal ecosystem. Limnology and<br />
Oceanography 47:698-712.<br />
19
Overview <strong>of</strong> Studies <strong>of</strong> <strong>Ammonia</strong> 2 March 2009<br />
<strong>Sacramento</strong>-San Joaqu<strong>in</strong> Delta<br />
Jassby, A. 2008. Phytoplankton <strong>in</strong> <strong>the</strong> Upper San Francisco Estuary: Recent<br />
biomass trends, <strong>the</strong>ir causes and <strong>the</strong>ir trophic significance. San Francisco Estuary<br />
and Watershed Science 6(1): Article 2.<br />
Lehman, P.W. 2000. The <strong>in</strong>fluence <strong>of</strong> climate on phytoplankton community<br />
biomass <strong>in</strong> San Francisco Bay Estuary. Limnology and Oceanography 45(3):580-<br />
590.<br />
Lehman, P.W. 2004. The <strong>in</strong>fluence <strong>of</strong> climate on mechanistic pathways that<br />
impact lower food web production <strong>in</strong> nor<strong>the</strong>rn San Francisco Bay estuary.<br />
Estuaries 27:311-324.<br />
Lehman, P.W., G. Boyer, C. Hall, S. Waller and K. Gehrts. 2005. Distribution and<br />
toxicity <strong>of</strong> a new colonial Microcystis aerug<strong>in</strong>osa bloom <strong>in</strong> <strong>the</strong> San Francisco Bay<br />
Estuary, California. Hydrobiologia 541:87-99.<br />
Lehman, P.W., G. Boyer, M. Satchwell, and S. Waller. 2008. The <strong>in</strong>fluence <strong>of</strong><br />
environmental conditions on <strong>the</strong> seasonal variation <strong>of</strong> Microcystis cell density and<br />
microcyst<strong>in</strong>s concentration <strong>in</strong> <strong>the</strong> San Francisco Estuary. Hydrobiologia 600:187-<br />
204.<br />
Nixon, S.W. 1988. Physical energy <strong>in</strong>puts and <strong>the</strong> comparative ecology <strong>of</strong> lake<br />
and mar<strong>in</strong>e ecosystems. Limnology and Oceanography 33(4, part 2):1005-1025.<br />
Reddy, K.R. and J.C. Tucker. 1983. Productivity and nutrient uptake <strong>of</strong> water<br />
hyac<strong>in</strong>th, Eichhornia crassipes I. Effect on nitrogen sources. Economic Botany<br />
37(2):237-247.<br />
U.S. Environmental Protection Agency (US EPA). 1999. 1999 Update <strong>of</strong> Ambient<br />
Water Quality Criteria for <strong>Ammonia</strong>. EPA-822-R-99-014. Office <strong>of</strong> Water,<br />
Wash<strong>in</strong>gton D.C.<br />
Van Nieuwenhuyse, E.E. 2007. Response <strong>of</strong> summer chlorophyll concentration to<br />
reduced total phosphorus concentration <strong>in</strong> <strong>the</strong> Rh<strong>in</strong>e River (Ne<strong>the</strong>rlands) and <strong>the</strong><br />
<strong>Sacramento</strong>-San Joaqu<strong>in</strong> Delta (California, USA). Canadian Journal <strong>of</strong> Fisheries<br />
and Aquatic Sciences 64:1529-1542.<br />
Werner, I., L. Deanovic, D. Markiewicz, M. Stillway, J. Khamphanar, N. Offer, R.<br />
Connon, and S. Beggel. 2008a. Pelagic Organism Decl<strong>in</strong>e (POD): Acute and<br />
Chronic Invertebrate and Fish Toxicity Test<strong>in</strong>g <strong>in</strong> <strong>the</strong> <strong>Sacramento</strong>-San Joaqu<strong>in</strong><br />
Delta 2008-2010, Progress Report. Dated 10 September 2008.<br />
Werner, I., L.A. Deanovic, D. Markiewicz, M. Stillway, N. Offer, R. Connon, S.<br />
Brander. 2008b. Pelagic Organism Decl<strong>in</strong>e (POD): Acute and Chronic Invertebrate<br />
and Fish Toxicity Test<strong>in</strong>g <strong>in</strong> <strong>the</strong> <strong>Sacramento</strong>-San Joaqu<strong>in</strong> Delta 2006-2007. F<strong>in</strong>al<br />
Report to <strong>the</strong> California Department <strong>of</strong> Water Resources, <strong>Sacramento</strong>, CA.<br />
20
Overview <strong>of</strong> Studies <strong>of</strong> <strong>Ammonia</strong> 2 March 2009<br />
<strong>Sacramento</strong>-San Joaqu<strong>in</strong> Delta<br />
Werner, I., L.A. Deanovic, M. Stillway, and D. Markiewicz. 2009. The Effects <strong>of</strong><br />
Wastewater Treatment Effluent-Associated Contam<strong>in</strong>ants on Delta Smelt, Draft<br />
F<strong>in</strong>al Report. Dated 28 January 2009.<br />
Wilkerson, F.P., R.C. Dugdale, V.E. Hogue, and A. Marchi. 2006. Phytoplankton<br />
blooms and nitrogen productivity <strong>in</strong> <strong>the</strong> San Francisco Bay. Estuaries and Coasts<br />
29(3):401-416.<br />
21