You also want an ePaper? Increase the reach of your titles
YUMPU automatically turns print PDFs into web optimized ePapers that Google loves.
The total station constantly<br />
determines the horizontal<br />
and vertical angle to the<br />
prism as well as its current<br />
distance from continually<br />
running measuring sequences,<br />
from electro-optical<br />
angle measuring and<br />
electronic infra red laser<br />
distance measuring. This<br />
data is immediately computed<br />
by the Leica TCA 1800<br />
into position and height<br />
coordinates of the prism or<br />
of the georadar centre<br />
point, exact to the centimetre.<br />
At the same time,<br />
where the terrain has an<br />
inclination, the vertical<br />
variations of the prism at<br />
the point of the measuring<br />
carriage are also mathematically<br />
compensated by<br />
the SAGAS software. The<br />
georadar equipment and<br />
measuring station are<br />
directly connected to the<br />
geophysicist’s laptop<br />
computer by thin glass fibre<br />
cables and he draws the<br />
measuring carriage along<br />
the desired profiled lines<br />
with the help of the realtime<br />
position data.<br />
3-D evaluation directly in<br />
the field<br />
The SAGAS software<br />
continuously integrates all<br />
reflection and coordinate<br />
data and presents it to the<br />
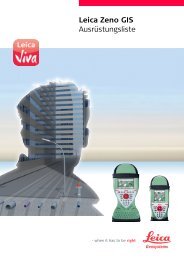
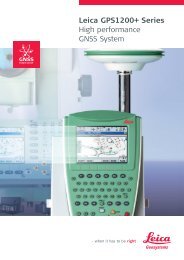
In this interlocking georadar<br />
picture sections and the equal<br />
time section, the geophysicist<br />
recognises on location at once<br />
the water table (green line) and<br />
reflections from objects transmitted<br />
from above the surface of<br />
the ground (yellow lines) thanks<br />
to the 3-D presentation. SP1 and<br />
SP2 mark the lower boundary<br />
between two erosion troughs.<br />
© Frank Lehmann/ETH.<br />
geophysicist in the desired<br />
form directly in the field.<br />
Special features of the<br />
territory investigated and its<br />
surroundings, such as, for<br />
example, the ground water<br />
table and reflections from<br />
buildings above ground<br />
level which are also represented<br />
in the georadar data,<br />
can in this way be explained<br />
more quickly and if required,<br />
filtered out. Naturally, these<br />
comprehensive and threedimensionallyhigh-resolution<br />
data sets can be used in<br />
the office later for various<br />
purposes including further<br />
and more detailed study.<br />
In comparison with the static<br />
methods, appreciably finer<br />
analyses are possible in a<br />
distinctly shorter period of<br />
time.<br />
At least ten times quicker<br />
than previously<br />
Frank Lehmann together<br />
with Alan G Green has<br />
described this system in<br />
detail in a paper entitled<br />
”Semi-automated georadar<br />
data acquisition in three<br />
dimensions”.<br />
It is accessible by e-mail<br />
(frankl@augias.ig.erdw.ethz<br />
.ch) to anyone who is<br />
interested. As Frank<br />
Lehmann says: ”With this<br />
method a variety of<br />
problems affecting the<br />
subsoil and of concern in<br />
geology, engineering<br />
science and archaeology<br />
can be solved more simply<br />
and more exactly than<br />
previously. During our<br />
study we pulled our measu-<br />
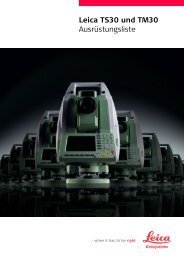
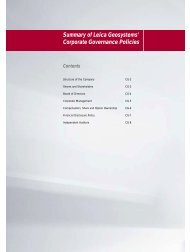
Six equal time sections of the scour pool. Its boundaries are<br />
shown here marked with green lines.<br />
© Frank Lehmann/ETH<br />
The Leica TCA 1800 total station<br />
tracked the measuring carriage<br />
continuously and provided the<br />
geophysicist with his actual<br />
position by way of a graphic<br />
display in real-time on the<br />
laptop screen. Thus he can also<br />
always keep to the ideal line for<br />
his current project and the<br />
system trigger the radar measurements<br />
at the correct intervals.<br />
The geophysicist is carrying the<br />
georadar control unit on his<br />
back.<br />
ring carriage at the rate of<br />
only 0.3 m/s although as far<br />
as the measuring system<br />
itself was concerned, even<br />
3 m/s would have been<br />
possible for providing<br />
sufficient accuracy. Even<br />
with our gentle speed, we<br />
obtained our results ten<br />
times more quickly when<br />
compared with the methods<br />
available up till now. The<br />
data processing was also<br />
carried out so quickly that<br />
we could easily display, on<br />
our laptop screen, threedimensional<br />
profile sections<br />
in various directions and<br />
also sections covering periods<br />
from the past, while still<br />
in the gravel pit ”.<br />
- Stf -<br />
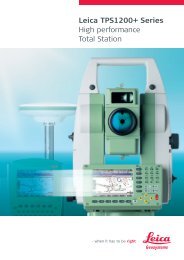
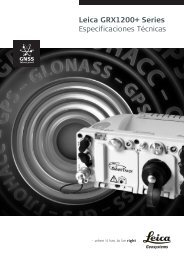
Here SAGAS presents a section of the scour pool<br />
of the two water courses from the complete picture<br />
in raised, three-dimensional volume presentation.<br />
© Frank Lehmann/ETH<br />
13