Near Real-Time Monitoring of Air Pollution Over US Using ... - Capita
Near Real-Time Monitoring of Air Pollution Over US Using ... - Capita
Near Real-Time Monitoring of Air Pollution Over US Using ... - Capita

You also want an ePaper? Increase the reach of your titles
YUMPU automatically turns print PDFs into web optimized ePapers that Google loves.
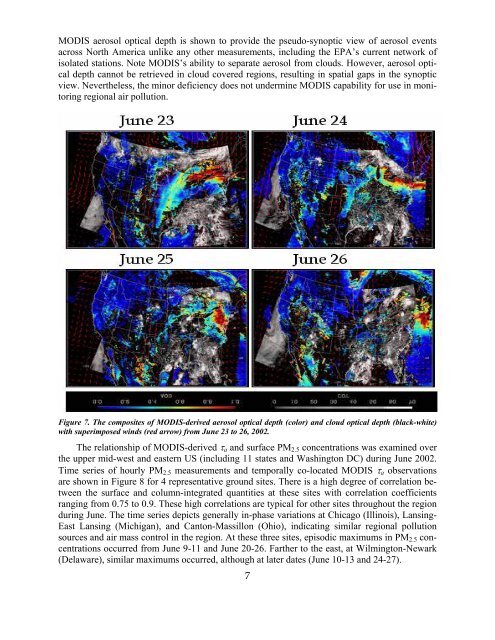
MODIS aerosol optical depth is shown to provide the pseudo-synoptic view <strong>of</strong> aerosol events<br />
across North America unlike any other measurements, including the EPA’s current network <strong>of</strong><br />
isolated stations. Note MODIS’s ability to separate aerosol from clouds. However, aerosol optical<br />
depth cannot be retrieved in cloud covered regions, resulting in spatial gaps in the synoptic<br />
view. Nevertheless, the minor deficiency does not undermine MODIS capability for use in monitoring<br />
regional air pollution.<br />
Figure 7. The composites <strong>of</strong> MODIS-derived aerosol optical depth (color) and cloud optical depth (black-white)<br />
with superimposed winds (red arrow) from June 23 to 26, 2002.<br />
The relationship <strong>of</strong> MODIS-derived τa and surface PM2.5 concentrations was examined over<br />
the upper mid-west and eastern <strong>US</strong> (including 11 states and Washington DC) during June 2002.<br />
<strong>Time</strong> series <strong>of</strong> hourly PM2.5 measurements and temporally co-located MODIS τa observations<br />
are shown in Figure 8 for 4 representative ground sites. There is a high degree <strong>of</strong> correlation between<br />
the surface and column-integrated quantities at these sites with correlation coefficients<br />
ranging from 0.75 to 0.9. These high correlations are typical for other sites throughout the region<br />
during June. The time series depicts generally in-phase variations at Chicago (Illinois), Lansing-<br />
East Lansing (Michigan), and Canton-Massillon (Ohio), indicating similar regional pollution<br />
sources and air mass control in the region. At these three sites, episodic maximums in PM2.5 concentrations<br />
occurred from June 9-11 and June 20-26. Farther to the east, at Wilmington-Newark<br />
(Delaware), similar maximums occurred, although at later dates (June 10-13 and 24-27).<br />
7