Near Real-Time Monitoring of Air Pollution Over US Using ... - Capita
Near Real-Time Monitoring of Air Pollution Over US Using ... - Capita
Near Real-Time Monitoring of Air Pollution Over US Using ... - Capita

Create successful ePaper yourself
Turn your PDF publications into a flip-book with our unique Google optimized e-Paper software.
<strong>Near</strong> <strong>Real</strong>-<strong>Time</strong> <strong>Monitoring</strong> <strong>of</strong> <strong>Air</strong> <strong>Pollution</strong> <strong>Over</strong> <strong>US</strong><br />
<strong>Using</strong> EOS Terra/Aqua MODIS Direct Broadcasting<br />
A proposal submitted to<br />
NRA-03-OES-02<br />
EOS NRA<br />
NASA Peer Review Services, Code Y<br />
500 E Street SW, Suite 200<br />
Washington, DC 20024-2760<br />
Tel: 202-479-9030<br />
PI Co-I<br />
D. Allen Chu, Senior Scientist/Project Manger Lorraine Remer<br />
Science Systems and Applications, Inc. Climate and Radiation Branch<br />
NASA GSFC, Code 913 NASA Goddard Space Flight Center<br />
Greenbelt, MD 20706, <strong>US</strong>A Greenbelt, MD 20771, <strong>US</strong>A<br />
301-614-6237(voice), 614-6307 (fax) 301-614-6 (voice), 614-6307 (fax)<br />
e-mai: achu@climate.gsfc.nasa.gov e-mail: remer@climate.gsfc.nasa.gov<br />
Co-Is<br />
Jim Szykman J. A. Al-Saadi<br />
Emissions <strong>Monitoring</strong> & Analysis Division Chemistry & Dynamics Branch<br />
Office <strong>of</strong> <strong>Air</strong> Quality Planning and Standards Atmospheric Sciences Competency<br />
<strong>US</strong> EPA, c/o NASA Langley Research Center NASA Langley Research Center<br />
Hampton, VA 23681, <strong>US</strong>A Hampton, VA 23681, <strong>US</strong>A<br />
757- 864-2709 (voice), 864-8461 (fax) 757- 864-5164 (voice), 864-6326 (fax)<br />
e-mail: szykman.jim@epa.gov e-mail: j.a.al-saadi@larc.nasa.gov<br />
Bryan Baum<br />
NASA Langley Research Center, c/o University <strong>of</strong> Wisconsin-Madison<br />
Madison, WI 53706, <strong>US</strong>A<br />
608-263-3898 (voice), 608-262-5974 (fax)<br />
e-mail: bryan.baum@ssec.wisc.edu<br />
Collaborators<br />
Judd Welton, NASA Goddard Space Flight Center, e-mail: welton@virl.gsfc.nasa.gov<br />
Eric Vermote, University <strong>of</strong> Maryland at College Park, e-mail: eric@kratmos.gsfc.nasa.gov<br />
Fred Dimmick, EPA, Office <strong>of</strong> <strong>Air</strong> Quality Planning and Standards, e-mail: di mick.fred@epa.gov<br />
Richard Wayland, EPA, Office <strong>of</strong> <strong>Air</strong> Quality Planning and Standards, e-mail: wayland.richard@epa.gov<br />
David Williams, EPA, Office <strong>of</strong> Research and Development, e-mail: williams.davidj@epa.gov<br />
Date Submitted: April 15, 2003<br />
Starting Date: October 1, 2003<br />
Performance Period: October 1, 2003- September 30, 2006<br />
Total amount in three years: $ 737,400 K
TABLE OF CONTENTS<br />
ABSTRACT………...……………………………………………………….…………….i<br />
PROJECT DESCRIPTION …………………………………………………………… ...1<br />
1. INTRODUCTION…………………………………………………………………… .1<br />
1.1 Aerosols and <strong>Air</strong> Quality Needs………………………………………………....1<br />
1.2 Satellite Remote Sensing <strong>of</strong> Aerosol <strong>Over</strong> Land………………………………..1<br />
2. PRELIMINARY STUDY……….……………..............................................................4<br />
2.1 Northern Italy (Ideal Case)……………………………….....................................4<br />
2.2 Eastern United States………………………………...............................................5<br />
2.3 Long Range Dust Transport <strong>Over</strong> <strong>US</strong>…………………………… .....................10<br />
3. SCIENTIFIC OBJECTIVES…………………………………………….…………....10<br />
4. SCIENTIFIC APPROACH…………………………………………….…………… 11<br />
4.1 Available Data …………………… .......................................................................11<br />
4.2 <strong>Time</strong>liness <strong>of</strong> Data………..…………….………….……………….…………….12<br />
4.3 Proposed Work…………………………………………………………………...13<br />
Task 1. Study the relationship <strong>of</strong> MODIS-derived aerosol optical depth and<br />
PM2.5 concentration measured at surface.................................................13<br />
Task 2. Examine aerosol transport pattern in urban and rural areas………. ...14<br />
Task 3. Evaluate high spatial resolution <strong>of</strong> MODIS aerosol for better characterizing<br />
aerosol spatial distribution………………….…………………. 15<br />
Task 4. Prototype a combined MODIS and PM2.5 product for air quality forecast………………………………………………………………………….<br />
16<br />
5. NRA PROGRAM RELEVANCE…………………………………………………...18<br />
6. MANAGEMENT PLAN…………………………………………………….…… ...19<br />
6.1 <strong>Time</strong>line…………………………………………………………….…………......19<br />
6.2 Personnel And Responsibilities……………………………….… ......................20<br />
7. BUDGET AND MANPOWER REQUIREMENTS…………………………….….21<br />
7.1 Budget Explanation …………………………………………………………… ..21<br />
7.2 Current/Pending Support and Relationship to Other Submitted Proposals………………………………………..................................................................22<br />
8. CONCL<strong>US</strong>IONS………………………………………………………………….….23<br />
9. REFERENCES…………………………………….………………………………….23<br />
APPENDIX A -SSAI BUDGET SUMMARY ………………………………………...25<br />
APPENDIX B - LaRC BUDGET SUMMARY……………………………………… ..29<br />
APPENDIX C - EPA IN-KIND BUDGET SUMMARY…………………………… ..33<br />
APPENDIX D - TOTAL BUDGET SUMMARY……………………………..............37<br />
APPENDIX E -VITA ………………………………………………… ...........................41<br />
a. D. Allen Chu<br />
b. Lorraine Remer<br />
c. Jim Szykman<br />
d. J. A. Al-Saadi<br />
e. Bryan Baum
<strong>Near</strong> <strong>Real</strong>-<strong>Time</strong> <strong>Monitoring</strong> <strong>of</strong> <strong>Air</strong> <strong>Pollution</strong> <strong>Over</strong> <strong>US</strong> <strong>Using</strong> EOS<br />
Terra/Aqua MODIS Direct Broadcasting<br />
ABSTRACT<br />
MODIS (Moderate Resolution Imaging Spectroradiometer) measurements provide us with<br />
new insights into global aerosol characteristics. MODIS retrieves not only aerosol optical depth<br />
(τa) but also the fraction <strong>of</strong> fine-mode particles. Its ability to derive aerosol over land has greatly<br />
advanced our understanding <strong>of</strong> aerosol into the source region. Extensive MODIS validation with<br />
AERONET (Aerosol Robotic Network) measurements from 2000 to 2002 shows that more than<br />
two-thirds <strong>of</strong> MODIS retrievals (~6,000) fall within the expected range <strong>of</strong> retrieval errors <strong>of</strong><br />
∆τa=±0.05±0.2τa (e.g., 25% for τa = 1); outliers are primarily due to sub-pixel cloud, water, and<br />
snow/ice contaminations. Other validations with AATS (Ames <strong>Air</strong>borne Tracking Sunphotometer),<br />
shadowband, or Microtops measurements acquired in SAFARI (Southern African Regional<br />
Science Initiative) 2000 and ACE-Asia (Aerosol Characterization Experiment – Asia) field experiments<br />
conform to the findings as described above.<br />
The MODIS capabilities and accuracy <strong>of</strong> the standard 10 km aerosol product enable us to<br />
answer questions concerning aerosol effects on the global energy balance and hydrological systems.<br />
In addition, the standard MODIS aerosol optical depth data can be used as an important<br />
tool for monitoring air pollution and air quality. The preliminary analysis shows promising results<br />
<strong>of</strong> correlating MODIS-derived columnar aerosol optical depth with PM2.5 (particulate matter<br />
with diameter < 2.5 µm) mass concentration measured at the surface, with correlation coefficients<br />
found as high as 0.8-0.9 in many metropolitan areas (e.g., Houston, Chicago, Wilmington,<br />
etc.). With direct broadcasting (data processing < 1 hour), near real-time monitoring <strong>of</strong> air pollution<br />
can be possible in any place <strong>of</strong> the <strong>US</strong>. Also, using both MODIS sensors from EOS-Terra<br />
(10:30 a.m. equator-crossing time) and EOS-Aqua (1:30 p.m. equator-crossing time) satellites<br />
enables us to study aerosol diurnal variation especially in the source region. Such information<br />
will be an important Decision Support Tool for air quality managers at the EPA and other U.S.<br />
and international agencies. Given aerosol vertical pr<strong>of</strong>iles obtained from Micropulse Lidar or<br />
GLAS (Geoscience Laser Altimeter System; launched in January 2003), it is possible to derive<br />
PM2.5 concentration from MODIS. In this proposal, we will develop the necessary scientific understanding<br />
between MODIS-derived τa and in-situ PM2.5 concentration. We accomplish this<br />
through the study <strong>of</strong> the relationship <strong>of</strong> MODIS-derived τa and in-situ sampled PM2.5 concentration<br />
in detail and at as many locations as possible. We will also examine regional aerosol transport<br />
patterns over the E. <strong>US</strong> in both urban and rural areas to help better understand the evolution<br />
and demise <strong>of</strong> PM episodes (e.g., biomass burning from forest fire or other weather driven<br />
events), and evaluate whether higher resolutions (e.g., 5×5, 3×3, or 1×1 km 2 ) <strong>of</strong> MODIS aerosol<br />
retrievals will better characterize aerosol spatial distribution than the standard product, especially<br />
in the metropolitan areas. Finally, we will use these scientific results to develop a combined<br />
product utilizing near real-time MODIS aerosol optical depth data and EPA PM2.5 mass concentration<br />
measurements for air quality assessment and forecast.<br />
i
PROJECT DESCRIPTION<br />
1. INTRODUCTION<br />
1.1 Aerosols and <strong>Air</strong> Quality Needs<br />
Aerosols in the atmosphere arise from both natural sources: biomass burning, wind-blown<br />
dust, and sea salts and anthropogenic sources: fossil fuel combustion, industrial processes, and<br />
transportation. In the lower boundary layer, aerosol, also known as particulate matter (PM), is a<br />
human health hazard and also can reduce visibility significantly. Based upon the <strong>US</strong> EPA report,<br />
though significant improvements have been done in the last 30 years, over 80 million people in<br />
the United States still live in counties with PM concentrations above the level <strong>of</strong> the ambient air<br />
quality standards (EPA, 2001), for example, for PM2.5 (particles < 2.5 µm in diameter) concentration<br />
~65 µg/m 3 in 24 hours (or a annual mean <strong>of</strong> 15 µg/m 3 ) under the Clean <strong>Air</strong> Act (CAA).<br />
These standards are purported to prevent approximately 15,000 premature deaths when fully implemented<br />
(EPA, 1997a; EPA, 1999a).<br />
Currently, the EPA, along with Regional Planning Organizations, and state and local governments<br />
use a multitude <strong>of</strong> decision support tools to assess, control and report the nature <strong>of</strong> air<br />
pollution related to PM. The existing air quality decision processes rely solely on urban scale<br />
models and ground based measurement networks, which do not have the capability <strong>of</strong> synoptic<br />
view <strong>of</strong> aerosol movement and distribution. The MODIS direct broadcast is a unique NASA asset,<br />
which can be brought to bear on these decision-making processes <strong>of</strong> air quality (processing<br />
time < 1 hour <strong>of</strong> satellite overpass). Though this proposal we will build upon existing collaborative<br />
efforts between NASA and EPA to improve the science behind the assessment, prediction,<br />
and real-time decision-making tools for the air quality management community.<br />
1.2 Satellite Remote Sensing <strong>of</strong> Aerosol <strong>Over</strong> Land<br />
Satellite remote sensing has established long records <strong>of</strong> aerosol measurements since the late<br />
1970s. However, most <strong>of</strong> the aerosol properties were derived over ocean (e.g., Advanced Very<br />
High Resolution Radiometer, AVHRR) until the discovery <strong>of</strong> TOMS (Total Ozone Mapping<br />
Spectrometer) new capability in detecting absorbing aerosols over land and ocean using ultraviolet<br />
spectrum (0.34 and 0.38 µm) [Hsu et al., 1996; Herman et al., 1997]. Neither <strong>of</strong> the instruments<br />
was designed to retrieve aerosols partly because coarse resolution (4 km for AVHRR and<br />
50 km for TOMS) makes it difficult to avoid cloud contamination. In addition, the restriction <strong>of</strong><br />
spectral ranges to only 2 channels in the solar spectrum is difficult for AVHRR to separate the<br />
observed signal into atmospheric and land components. Although TOMS does not have the same<br />
problem since the earth's surface is uniformly dark in the ultraviolet spectrum, the strong sensitivity<br />
<strong>of</strong> TOMS’s detection <strong>of</strong> absorbing aerosols to aerosol height limits its applications. The<br />
MODIS (Moderate Resolution Imaging Spectroradiometer) sensors on EOS-Terra MODIS<br />
launched in 1999 and on EOS-Aqua in 2002 were designed to systematically retrieve aerosol<br />
properties over both land and ocean [Kaufman et al., 1997; Tanre et al., 1997]. The success <strong>of</strong><br />
MODIS aerosol retrieval is due to a unique set <strong>of</strong> seven well-calibrated channels (0.47, 0.55,<br />
0.67, 0.87,1.24, 1.64, 2.1 µm) from visible to shortwave infrared wavelength. MODIS ability to<br />
derive aerosol optical depth (τa) and the fraction <strong>of</strong> fine mode particles over land and ocean has<br />
drastically broadened our understanding <strong>of</strong> global aerosols in both source and downwind regions.<br />
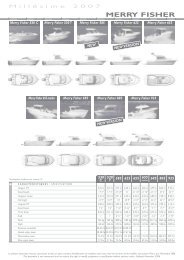
Figures 1(a) and (b) show, respectively, the seasonal means <strong>of</strong> MODIS-derived τa and corresponding<br />
fine-mode τa for spring, summer, autumn, and winter from December 2000 to November<br />
2001.<br />
1
Figure 1(a). Seasonal means <strong>of</strong> MODIS-derived aerosol optical depth for spring (March-May 2001),<br />
summer (June-August 2001), autumn (September-November 2001), and winter (December 2000-<br />
February 2001) [Chu et al., 2003].<br />
Figure 1(b). Seasonal means <strong>of</strong> MODIS-derived fine-mode aerosol optical depth for spring<br />
(March-May 2001), summer (June-August 2001), autumn (September-November 2001), and winter<br />
(December 2000-February 2001).<br />
From the global perspective, it is clear to see the seasonal events such as the springtime<br />
Asian dust spreading around the N. hemisphere, the African dust outflow shifting with latitude in<br />
different seasons, and the dry-season biomass burning from Southern Africa and South America.<br />
2
The dry-season biomass burning in Southern Africa and South America are the most pronounced<br />
feature, followed by the springtime dust outbreaks in the East Asia and summertime urban/industrial<br />
pollution in the eastern China, India, eastern <strong>US</strong>, and western Europe. The extensive<br />
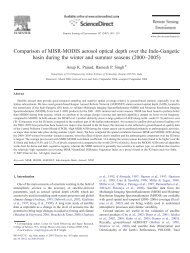
validation <strong>of</strong> MODIS aerosol retrievals against the observations <strong>of</strong> 100 AERONET sunphotometers<br />
between 2000 and 2002 depicts that more than two-thirds <strong>of</strong> MODIS retrievals (~6,000)<br />
fall within the expected range <strong>of</strong> retrieval errors ∆τa=±0.05±0.2τa (e.g., 25% for τa = 1); outliers<br />
are primarily due to sub-pixel cloud, water, and snow/ice contaminations [Remer et al., 2003].<br />
Shown in Figure 2 are co-located MODIS and AERONET points sorted by AEROENT τa values<br />
and averaged over every 300 points. The slightly low biases for τa > 0.6 are primarily caused by<br />
the underestimation <strong>of</strong> black carbon content in southern African biomass burning.<br />
The regional validation in the eastern <strong>US</strong> and southern America [Chu et al., 2002] showed<br />
expected results from MODIS as compared to those obtained from MODIS airborne simulator<br />
(MAS) in the pre-launch SCAR-A (Sulfate, Clouds, And Radiation-Atlantic) and SCAR-B<br />
(Smoke, Clouds, And Radiation, Brazil) field experiments [Kaufman et al., 1997; Chu et al.,<br />
1998]. This consistency reflects that aerosol models used in the retrievals properly characterize<br />
aerosol properties for urban/industrial aerosol (single scattering albedo, ω ~0.96) in the eastern<br />
<strong>US</strong> and biomass burning aerosol ( ~0.9) in South America. Furthermore, the assumptions <strong>of</strong><br />
aerosol models in regions with the occurrence <strong>of</strong> urban/industrial and biomass-burning aerosols<br />
based upon the aerosol models derived SCAR-A and SCAR-B have achieved satisfactory success<br />
with only slight refinements needed in China (ωο ~0.85-0.90) and Southern Africa (ωο<br />
~0.85) to account for the higher black carbon content in those regions.<br />
Figure 2. Comparison <strong>of</strong> MODIS and AERONET-derived τa at 550 nm. The 5,906 co-located points<br />
are sorted by AEROENT τa and averaged over every 300 points. At high τa where data is sparser, few<br />
points are included in the average as indicated. Error bars represent standard deviation in each bin.<br />
The dash lines represent pre-launch expected retrieval error. The regression and correlation coefficient<br />
are calculated before binning and averaging.<br />
MODIS aerosol algorithm is performing within expectations over land on both global and<br />
regional scales. However, can the standard products developed to answer important questions<br />
concerning climate change be applied to regional or local air pollution? The three case studies in<br />
the next section will demonstrate MODIS capability with promising results <strong>of</strong> applying MODIS<br />
aerosol products to air pollution monitoring as well as issues that require further investigations.<br />
3
2.0 PRELIMINARY STUDY<br />
2.1 Northern Italy (IDEAL CASE)<br />
Preliminary analysis <strong>of</strong> MODIS standard aerosol product suggests that aerosol optical depth<br />
derived at 10 km × 10 km resolution can be applied to regional air pollution. Shown in Figure 3<br />
is the case study <strong>of</strong> heavy air pollution observed by MODIS in Northern Italy on September 26,<br />
2000 (10:15 UTC) [Chu et al., 2003]. Heavy aerosol loading can be seen extending from the<br />
foothills <strong>of</strong> the Alps to the Venice Lagoon. The MODIS-derived τa around Ispra (~1.2) is found<br />
in good agreement with AERONET observations (~1.0), which is more than double the September<br />
monthly mean <strong>of</strong> ~0.43 (or triple the annual mean ~0.32). In the region near Venice Lagoon,<br />
the MODIS-derived τa (~0.45) and AERONET sun photometer measurements (~0.4) are more<br />
comparable with the September monthly mean ~0.34 (or annual mean ~0.30). Under stagnant<br />
condition, accumulated aerosol abundance can reach τa > 1 (at 0.55 µm) before being removed<br />
by wind or precipitation. The good agreement between MODIS and AERONET-derived τa at<br />
Ispra (source) and Venice (downwind) and the 2 nd order polynomial fit derived between Ispra<br />
and Venice depict the accuracy and spatial sensitivity <strong>of</strong> MODIS aerosol retrievals in a regional<br />
pollution episode.<br />
Figure 3. Left column: MODIS RGB image (top) and spatial gradient <strong>of</strong> 2<br />
4<br />
nd order polynomial fit<br />
(bottom); right column geographic and topographic maps (top and middle) and MODIS-derived<br />
aerosol optical depth (bottom).
The above agreement between MODIS and AERONET-derived τa does not answer the<br />
question <strong>of</strong> air quality in entirety. Both MODIS and AERONET measure total column quantities,<br />
while air quality is mostly concerned with concentration <strong>of</strong> particulate matter (PM) at the surface.<br />
To prove MODIS's ability, we must show that aerosol optical depth is correlated with PM<br />
concentration measured at the surface. Because <strong>of</strong> diurnal variability, exact match-ups in time<br />
between the measured PM and the MODIS overpass is important. In the absence <strong>of</strong> hourly PM<br />
measurements at Ispra, the relationship <strong>of</strong> aerosol optical depth and PM10 concentration (µg/m 3 )<br />
measured at surface is studied by matching 24-hour PM10 concentration with daily-averaged<br />
AERONET τa (as a surrogate for MODIS) from August to October 2000. A correlation coefficient<br />
<strong>of</strong> 0.82 and an intercept <strong>of</strong> 8 are derived (see Figure 4). Stable air masses and fixed pollution<br />
sources are believed to contribute to such good correlation with a very small intercept. This<br />
case study is unique to show the application <strong>of</strong> MODIS aerosol retrievals to air pollution research<br />
in part because the topography in Northern Italy allows pollutants to accumulate under<br />
stagnant condition without mixing with other types <strong>of</strong> aerosol and in part because the existence<br />
<strong>of</strong> two AERONET stations can be used to compare with MODIS aerosol retrievals in both source<br />
and downwind regions. In less idealized conditions, there are factors that can hinder the correlation,<br />
which are to be discussed in the following case studies focused in the United States.<br />
Figure 4. Correlation <strong>of</strong> 24-hour PM10 concentration and daily average AERONET τa (as a surrogate<br />
for MODIS) at Ispra, Italy from August to October 2000<br />
2.2 Eastern United States<br />
The <strong>US</strong> EPA (Environmental Protection Agency) <strong>Air</strong> Quality <strong>Monitoring</strong> Network provides<br />
an extensive coverage <strong>of</strong> PM measurements (see Figure 5). A major component <strong>of</strong> the proposed<br />
research is to understand the relationship between the MODIS aerosol products and the extensive<br />
PM2.5 measurements by the EPA. Where, when, and why do they agree or disagree? In this case<br />
study, we will focus on the summer haze in June 2002.<br />
5
It is well known that summer haze is responsible for producing bad air quality in the eastern<br />
<strong>US</strong>. According to the 3-year average <strong>of</strong> PM2.5 concentration, the maximal concentrations (20-30<br />
µg/m 3 ) extend from Ohio and Pennsylvania southward (to Tennessee) and southeastward (to<br />
Maryland/Delaware) in the month <strong>of</strong> June (see Figure 6). The pattern is changed slightly in July<br />
and August as high-pressure systems increasingly dominate the climatology <strong>of</strong> the region.<br />
Figure5. The Distribution <strong>of</strong> EPA PM monitoring stations over <strong>US</strong>. PM fine: PM2.5 (particulate matter<br />
with diameter < 2.5 µm); PM10 (particulate matter with diameter < 10 µm).<br />
3-12 12-15 15-17 17-20 20-30<br />
Figure6. 3-year average <strong>of</strong> PM2.5 (µm/m 3 ) observed by 1100 FRM monitors over <strong>US</strong>.<br />
Shown in Figure 7 are the composites <strong>of</strong> MODIS-derived aerosol optical depth (color) and<br />
cloud optical depth (black-white) from June 23 to 26, 2002, with wind speed/direction (at 850<br />
mb) superimposed to the images. High aerosol loading air masses can be seen moving in concert<br />
with the winds from the upper mid-west to the northeast, over the Mid-Atlantic States, then out<br />
to the Atlantic Ocean. On June 25, PM2.5 concentrations spiked in Maryland and Washington<br />
DC, with code-red air quality alerts being issued for the areas corresponding to elevated τa ≥ 1.<br />
6
MODIS aerosol optical depth is shown to provide the pseudo-synoptic view <strong>of</strong> aerosol events<br />
across North America unlike any other measurements, including the EPA’s current network <strong>of</strong><br />
isolated stations. Note MODIS’s ability to separate aerosol from clouds. However, aerosol optical<br />
depth cannot be retrieved in cloud covered regions, resulting in spatial gaps in the synoptic<br />
view. Nevertheless, the minor deficiency does not undermine MODIS capability for use in monitoring<br />
regional air pollution.<br />
Figure 7. The composites <strong>of</strong> MODIS-derived aerosol optical depth (color) and cloud optical depth (black-white)<br />
with superimposed winds (red arrow) from June 23 to 26, 2002.<br />
The relationship <strong>of</strong> MODIS-derived τa and surface PM2.5 concentrations was examined over<br />
the upper mid-west and eastern <strong>US</strong> (including 11 states and Washington DC) during June 2002.<br />
<strong>Time</strong> series <strong>of</strong> hourly PM2.5 measurements and temporally co-located MODIS τa observations<br />
are shown in Figure 8 for 4 representative ground sites. There is a high degree <strong>of</strong> correlation between<br />
the surface and column-integrated quantities at these sites with correlation coefficients<br />
ranging from 0.75 to 0.9. These high correlations are typical for other sites throughout the region<br />
during June. The time series depicts generally in-phase variations at Chicago (Illinois), Lansing-<br />
East Lansing (Michigan), and Canton-Massillon (Ohio), indicating similar regional pollution<br />
sources and air mass control in the region. At these three sites, episodic maximums in PM2.5 concentrations<br />
occurred from June 9-11 and June 20-26. Farther to the east, at Wilmington-Newark<br />
(Delaware), similar maximums occurred, although at later dates (June 10-13 and 24-27).<br />
7
(a)<br />
(b)<br />
(c)<br />
(d)<br />
Figure 8. <strong>Time</strong> series <strong>of</strong> PM2.5 mass concentration observed at (a) Chicago, Illinois, (b) Lansing, Michigan,<br />
(c) Canton-Massillon, Ohio, and (d) Wilmington-Newark, Delaware-Maryland in June 2002 (solid<br />
line: hourly PM2.5 ; dotted line: 24-hour running average <strong>of</strong> PM2.5 ; red dots: MODIS τa plotted in a ratio<br />
<strong>of</strong> 1:70 with respect to PM2.5)<br />
8
Regional correlations between MODIS τa and surface PM2.5 were calculated for June 22-27<br />
by including all ground sites within EPA-defined Region 3 (Illinois, Indiana, Michigan, Minnesota,<br />
Ohio, and Wisconsin) and 5 (Washington DC, Delaware, Maryland, Pennsylvania, Virginia,<br />
and West Virginia) (Figure 9). Correlation coefficients <strong>of</strong> 0.72 and 0.82 are found, demonstrating<br />
that the correlations do not break down over the large areas and that MODIS aerosol retrievals<br />
have sufficient accuracy for applying to regional air pollution.<br />
Figure 9. Correlation <strong>of</strong> MODIS-derived τa and PM2.5 mass concentration in Region 3 (Illinois, Indiana,<br />
Michigan, Minnesota, Ohio, and Wisconsin) and Region 5 (Washington DC, Delaware, Maryland,<br />
Pennsylvania, Virginia, and West Virginia).<br />
The scatter observed in Figure 9 may be introduced by factors such as aerosol vertical distribution,<br />
type, and properties (e.g., hygroscopicity). In addition, the grid size <strong>of</strong> aerosol retrievals<br />
may potentially degrade the correlation, because 10 × 10 km 2 may be too coarse to resolve<br />
any finer scale variability. Shown in Figure 10 are the time series <strong>of</strong> PM2.5 concentrations, measured<br />
at two EPA monitoring sites less than 20 km apart around Pittsburgh. The PM2.5 measurements<br />
from these two EPA sites show very different hourly peak concentrations, partially associated<br />
with an apparent diurnal variability that is larger at one site. MODIS aerosol retrievals appear<br />
to behave better at tracking PM2.5 concentration at one station (top panel, correlation ~0.75)<br />
than the other (bottom, correlation ~0.68). Higher spatially resolved MODIS aerosol optical<br />
depth data (e.g., 5 × 5, 3 × 3, or 1 × 1 km 2 ) are expected to provide better sensitivity to large<br />
variation <strong>of</strong> PM at locations near the metropolitan area.<br />
9
Figure 10. <strong>Time</strong> series <strong>of</strong> PM2.5 mass concentration observed at two monitoring sites less than 20 km<br />
apart around Pittsburgh (solid line: hourly PM2.5 measurements; dotted line: 24-hour running average<br />
<strong>of</strong> PM2.5 ; red dots: MODIS τa plotted in a ratio <strong>of</strong> 1:70 with respect to PM2.5 mass concentration).<br />
2.3 Long-Range Dust Transport <strong>Over</strong> <strong>US</strong><br />
We have shown some examples <strong>of</strong> good correlation between MODIS-derived τa and surface<br />
PM2.5 measurements. However, it is not the case in less idealized conditions. Aerosol vertical<br />
distribution, type, and properties as well as spatial resolution <strong>of</strong> MODIS aerosol retrieval can<br />
hinder the correlation between MODIS-derived columnar τa and surface PM concentrations. In<br />
addition, long-range transport also plays an important role. Here we show a case study to illustrate<br />
such sensitivities.<br />
In early April 2001, a large dust storm developed over Gobi desert in Northern China due to<br />
cold air outbreak. Huge amounts <strong>of</strong> dust were transported across the Pacific within a week, and<br />
over North America in mid-late April. An assessment on the impact <strong>of</strong> the Gobi desert dust on<br />
ground level PM concentrations across the United States (Szykman et al., 2002) indicates poor<br />
correlations between aerosol loading (shown by TOMS Aerosol Index, AI) and ground level PM<br />
concentrations cross entire <strong>US</strong>, which was caused by the dust, once l<strong>of</strong>ted into the free atmosphere,<br />
being transported within the free atmosphere (500-700 mb) as it passed over the United<br />
States. Figure 11 illustrates this scenario on April 16, 2001 with high AI over the eastern <strong>US</strong> and<br />
low AI over the western <strong>US</strong>, while the PM2.5 (soil) ground concentrations show an opposite distribution.<br />
We expected similar results between MODIS derived optical depth and in-situ PM<br />
concentrations. For this type <strong>of</strong> event, lidar measurements can provide aerosol vertical distribution<br />
as a pro<strong>of</strong> and can also be used quantitatively to derive aerosol loading in the lower atmosphere<br />
below the dust layer.<br />
Figure 11 Left: is a false color image <strong>of</strong> TOMAI for April 16, 2001; right: PM2.5 soil mass concentrations<br />
across the <strong>US</strong> for April 16, 2001. These figures combined visually illustrate how dust detected by<br />
the TOMS AI does not correlated well with ground level PM concentrations for the same time period.<br />
10
3. SCIENTIFIC OBJECTIVES<br />
The overall goal is to use MODIS to improve the science <strong>of</strong> useful aerosol information to<br />
the <strong>Air</strong> Quality community, and to provide air quality managers with a well-understood Decision<br />
Support Tool to enable them to make better decisions in terms <strong>of</strong> issuing air quality warnings. In<br />
order to achieve the goal, we propose to<br />
(1) study the relationship <strong>of</strong> MODIS-derived aerosol optical depths and PM concentrations<br />
measured at the surface from EPA <strong>Air</strong> Quality <strong>Monitoring</strong> Network at different locations,<br />
(2) examine regional aerosol transport patterns in both urban and rural areas,<br />
(3) evaluate the higher resolutions (e.g., 5×5, 3×3, or 1×1 km 2 ) <strong>of</strong> MODIS aerosol retrievals<br />
for better characterizing aerosol spatial distribution, and<br />
(4) prototype the development <strong>of</strong> a combined product utilizing near real-time MODIS aerosol<br />
optical depth and EPA PM2.5 mass concentration measurements.<br />
4. SCIENTIFIC APPROACH<br />
The near real-time monitoring <strong>of</strong> air pollution requires not only the sound scientific objectives<br />
but also timely measurements. Timing is crucial for the decision-making air quality managers.<br />
Therefore we will address first the availability and timeliness <strong>of</strong> the data sets to be used in<br />
the proposal, followed by the tasks.<br />
4.1 Available Data<br />
• MODIS L1B true color images and L2 aerosol products (http://modis-atmos.gsfc.nasa.gov)<br />
MODIS L1B (level 1-B) calibrated radiance data are used to generate true color image <strong>of</strong><br />
the view <strong>of</strong> entire <strong>US</strong>. The true color browse images are a useful tool to identify clear and<br />
cloudy scenes, similar to our own eyes viewing from the surface. The width <strong>of</strong> MODIS swath<br />
<strong>of</strong> 2,330 km shows the advantage over any other surface measurements. As a result, the L2<br />
(level 2) MODIS aerosol products represent such good pseudo-synoptic views <strong>of</strong> aerosol<br />
events. The two MODIS sensors onboard EOS-Terra (10:30 a.m. equator-crossing time) and<br />
EOS-Aqua (1:30 p.m. equator-crossing time) provide the twice-a-day measurements <strong>of</strong> the<br />
Earth atmosphere allowing investigation <strong>of</strong> the diurnal variation <strong>of</strong> aerosol. The MODIS aerosol<br />
product contains aerosol optical depth derived at a spatial resolution <strong>of</strong> 10×10 km 2 at nadir.<br />
The MODIS data to be used in this proposal are versions 3 and 4 data sets. The version 3 data<br />
covers from November 2000 to October 2002. The version 4 data is currently being produced<br />
to cover more than 3 years <strong>of</strong> MODIS measurements from February 26, 2000 to October 31,<br />
2003 (to be finished by November 2003).<br />
• EPA PM2.5 mass concentration measurements (http://www.epa.gov/airnow/today/ ;<br />
http://www.airnowdata.org/pmfine/hourly.html)<br />
The primary in-situ EPA PM2.5 data to be used for this proposal are collected continuous<br />
(hourly) at approximately 250 sites using R&P TEOM (or equivalent) Ambient Particle Monitor.<br />
Additional in-situ PM measurements that EPA will make available for this work include<br />
(1) data from the Federal Reference Method (FRM) network implemented in support <strong>of</strong> the<br />
PM2.5 National Ambient <strong>Air</strong> Quality Standards (NAAQS) (EPA, 1997b), (2) data from the National<br />
Ambient <strong>Monitoring</strong> Stations (NAMS) PM2.5 chemical speciation (TRENDS) network,<br />
11
and (3) the Interagency <strong>Monitoring</strong> <strong>of</strong> PROtected Visual Environmental (IMPROVE) visibility<br />
network (Eldred et al., 1988) which both provide data on chemical composition <strong>of</strong> PM2.5.<br />
These data sets are not available in near real-time, like the TEOM data, but are available in the<br />
AQS central data archive approximately 3 months from sample collection. Both the PM2.5<br />
TRENDS and IMPROVE networks measure mass concentrations in addition to significant<br />
PM2.5 chemical constituents; sulfate, nitrate, sodium, potassium, ammonium, and carbon and<br />
will be valuable data sets to determine the chemical compositions <strong>of</strong> PM2.5 in helping to understand<br />
variability between MODIS aerosol optical depth and in-situ PM2.5 mass concentrations.<br />
The <strong>US</strong> EPA maintains a central data archive for all PM measurements, known as the <strong>Air</strong><br />
Quality System (AQS) (EPA, 2002). This archive contains ambient air pollution data collected<br />
by EPA, state, local, and tribal air pollution control agencies. This data archive is maintained<br />
and managed by <strong>US</strong> EPA’s Office <strong>of</strong> <strong>Air</strong> Quality Planning and Standards. An overview <strong>of</strong> this<br />
data archive is available at http://www.epa.gov/ttn/airs/airsaqs/sysoverview.htm.<br />
• Micropulse Lidar (MPL) and GLAS measurements (http://mplnet.gsfc.nasa.gov)<br />
The MPL is a single channel (0.523 µm), autonomous, and eye-safe lidar system. The MPL<br />
is used to determine the vertical structure <strong>of</strong> clouds and aerosols. The MPL data can be analyzed<br />
to produce optical properties such as extinction and optical depth pr<strong>of</strong>iles <strong>of</strong> the clouds<br />
and aerosols. The primary goal <strong>of</strong> MPLNET (MPL Network) is to provide long-term data sets<br />
<strong>of</strong> cloud and aerosol vertical distributions at key sites around the world. This data set will be<br />
used to validate and help improve global and regional climate models, and also serve as<br />
ground-truth sites for NASA/EOS satellite programs such as the Geoscience Laser Altimeter<br />
System (GLAS) on the ICESat (Ice, Cloud, and Land Elevation Satellite) spacecraft (launched<br />
on January 12, 2003). MPLNET measurements are currently only available from GSFC and<br />
ARM Cart sites but there are plans to expand to, for example, Monterey and San Diego, California<br />
in the near future.<br />
• NASA DAO (Data Assimilation Office) and NCEP (National Centers for Environmental Prediction)<br />
assimilated wind, temperature, and humidity pr<strong>of</strong>iles (http://dao.gsfc.nasa.gov) or<br />
(http://www.ncep.noaa.gov)<br />
The assimilated wind, temperature, and humidity pr<strong>of</strong>iles provide necessary information <strong>of</strong><br />
meteorological condition associated with aerosol events. NASA DAO products are currently<br />
being produced for “First Look” and “Late Look” with GEOS4-DAS (or fvDAS) since October<br />
1, 2002. The data are output every 6 hours including 48 vertical layers (surface-0.01 hPa) at<br />
1°× 1.25° spatial resolution. There is a plan to increase the spatial resolution to 0.5° × 0.625° in<br />
the near future (2004). The GEOS4-DAS products will be compared episodically with NCEP<br />
assimilated products for consistency.<br />
4.2 <strong>Time</strong>liness <strong>of</strong> Data<br />
MODIS data is processed to obtain aerosol products at MODAPS (MODIS Data Processing<br />
System) and then archived at the Goddard DAAC. Generally the global aerosol products become<br />
available to the public within a few days <strong>of</strong> satellite observation. Sometimes there is a delay and<br />
obtaining aerosol products can take longer. A lag in availability <strong>of</strong> a few days is acceptable for<br />
climate studies. However, in terms <strong>of</strong> a Decision Support Tool for air quality forecasting and<br />
management, a lag <strong>of</strong> a few days or even one day is not acceptable. In order to make the MODIS<br />
aerosol product useful to air quality managers the first order <strong>of</strong> business is to implement the<br />
standard aerosol algorithms into a direct broadcast system for near real-time accessibility.<br />
Fortunately, NASA has funded the project “International MODIS/AIRS Processing Package<br />
12
(IMAPP) For EOS Direct Broadcast Data” through 2006. In that proposal, CIMSS/SSEC (The<br />
Cooperative Institute for Meteorological Satellite Studies/Space Science and Engineering Center)<br />
at University <strong>of</strong> Wisconsin-Madison has <strong>of</strong>fered to implement MODIS aerosol algorithm<br />
into IMAPP by June 2004 and produce MODIS aerosol products (MOD04) in HDF format without<br />
any extra cost. If using IMAPP, MOD04 aerosol products can be generated within 1 hour <strong>of</strong><br />
EOS-Terra and EOS-Aqua overpasses, which suits the need for near real-time monitoring <strong>of</strong> air<br />
pollution.<br />
The continuous (hourly) PM2.5 mass concentration data is collected by state and local air<br />
agencies and then transferred to a central data archive maintained by <strong>US</strong> EPA/OAOPS. This data<br />
is available within 1-hour collection time from 252 stations. <strong>US</strong> EPA is currently prototyping<br />
near real-time reporting <strong>of</strong> these data for use in forecasting their <strong>Air</strong> Quality Index for PM2.5.<br />
MPL measurements can be viewed from the near real-time browse image, which then can be<br />
used to study the first order aerosol vertical distribution. The image is generated at a rate <strong>of</strong> 60<br />
seconds sampling time. Final aerosol extinction pr<strong>of</strong>iles are derived based upon the 30-minute<br />
average <strong>of</strong> the measurements.<br />
NASA DAO (or NCEP) data are generated every 6 hours (0600, 1200, 1800, 2400Z) daily.<br />
The DAO “First Look” product is especially designed for field experiment. It suits our needs for<br />
near real-time analysis <strong>of</strong> the meteorological fields.<br />
4.3 Proposed Work<br />
The preliminary analysis in the eastern <strong>US</strong> shows how MODIS aerosol products can be used<br />
effectively to track the synoptic scale movement <strong>of</strong> pollutants over the United States. The preliminary<br />
analysis has also provided very promising results <strong>of</strong> the correlation between MODIS<br />
aerosol optical depth and PM2.5 mass concentration. However, it also shows situations in which<br />
the correlation degrades. These situations when the MODIS column measurements do not agree<br />
well with surface measurements need to be better understood. Only then will MODIS’s potential<br />
as a Decision Support Tool in the <strong>Air</strong> Quality community be realized. There are many detailed<br />
analyses to be done in order to achieve this goal. Tasks 1-3 are to achieve scientific in nature. In<br />
Task 4, we propose development <strong>of</strong> data fusion product with twice-a-day MODIS aerosol optical<br />
depth data and hourly EPA PM2.5 mass concentration measurements for the continental <strong>US</strong>.<br />
Task 1: Study the relationship <strong>of</strong> MODIS-derived aerosol optical depths and PM2.5 mass concentrations<br />
measured at the surface<br />
The correlation <strong>of</strong> MODIS-derived aerosol optical depths and PM2.5 mass concentrations<br />
measured at the surface is dependent upon several factors associated with aerosols: aerosol vertical<br />
distribution, type, and properties. To understand the interplay between these factors in determining<br />
the relationship between MODIS-derived aerosol optical depth and ground-based PM2.5<br />
measurements, we need to utilize a suite <strong>of</strong> data sets (no matter how limited). These include<br />
MPL measurements (currently only available at GSFC and the ARM Cart site in the continental<br />
<strong>US</strong>), and assimilated data (e.g., wind, temperature, relative humidity, etc.) from NASA DAO or<br />
NCEP. The GLAS instrument onboard ICESat recently launched in January 2003 can provide<br />
aerosol vertical pr<strong>of</strong>iles with a broader spatial coverage, which will be used when the data become<br />
available. In addition to MPL sites (e.g., GSFC, ARM Cart site), we will also use assimilated<br />
temperature pr<strong>of</strong>ile data to search for temperature inversion layers. The data collected will<br />
be grouped into separate populations depending on the accuracy <strong>of</strong> the MODIS aerosol optical<br />
depths as a predictor <strong>of</strong> surface PM2.5 concentrations. The separate populations will then be<br />
evaluated for the similarities <strong>of</strong> vertical pr<strong>of</strong>iles <strong>of</strong> aerosol, temperature, humidity, and wind<br />
speed.<br />
13
However, The MODIS aerosol retrievals (twice a day), EPA PM2.5 mass concentrations<br />
(hourly), MPL aerosol vertical pr<strong>of</strong>iles, and NASA DAO (or NCEP) assimilated data (every 6<br />
hours) do not provide coherent measurements at the same place at the same time. The fully<br />
equipped SMART-COMMIT (Surface Measurements And Radiative Transfer – Chemical, Optical,<br />
Microphysical Measurements <strong>of</strong> In-situ Troposphere) portable platform with the R&P<br />
TEOM Ambient Particle Monitor and Radiance Research Nephelometers, when integrated with<br />
the Micropulse Lidar and AERONET Sun photometer at NASA/GSFC can provide simultaneous<br />
measurements <strong>of</strong> PM2.5 mass concentration, particle scattering coefficient (useful for distinguishing<br />
different aerosol types), aerosol vertical distribution, and aerosol optical depth (a surrogate<br />
for MODIS). Its mobility is value-added to the super site approach. The super site approach suits<br />
well to the objectives <strong>of</strong> long-term atmospheric characterization at NASA GSFC and Earth Observation<br />
Systems (EOS) validation field experiment <strong>of</strong> the proposal “SMART-COMMIT Investigation<br />
to Enrich NASA/ESE Earth Observing Systems Research” led by PI Dr. Si-Chee Tsay.<br />
Figure 12 shows instrumentation and configuration <strong>of</strong> SMART-COMMIT. When not deployed<br />
in the field experiment, SMART-COMMIT will be taking measurements at GSFC.<br />
TEOM PM2.5 Nephelometer Micropulse Lidar Sunphotometer<br />
Figure 12 SMART-COMMIT instrumentation and configuration in mobile 20 ft sea container for<br />
housing remote sensing instruments and camper trailer for housing in-situ instruments.<br />
Task 2: Examine regional aerosol transport patterns in both urban and rural areas<br />
Urban sources are easily identified and monitored by surface-based instrumentation. However,<br />
it is not the case in remote areas. For example, forests can burst into flames by lighting or<br />
human negligence, generating significant amounts <strong>of</strong> smoke without warning. Under the proper<br />
meteorological condition, it can be spread over a wide area or transported far away from the<br />
source region. As shown in Figure 7, MODIS aerosol optical depth data provide an excellent<br />
pseudo-synoptic view <strong>of</strong> the movement <strong>of</strong> aerosol. This task is to build the database <strong>of</strong> aerosol<br />
transport patterns using both Terra and Aqua MODIS-derived aerosol optical depths along with<br />
NASA DAO (or NCEP) assimilated winds data. In addition, a forward trajectory model will be<br />
14
used to compare the forecast with MODIS-derived aerosol optical depth and a back-trajectory<br />
model will be used to verify the location <strong>of</strong> the source and the altitude <strong>of</strong> transport. Figure 13<br />
shows a 3-D view <strong>of</strong> simulated air parcel tracks superimposed on MODIS aerosol optical depths<br />
and PM2.5 mass concentrations. Based upon this analysis, EPA can determine the location <strong>of</strong> new<br />
PM2.5 monitoring stations, especially in some key pathways <strong>of</strong> transport, in the future.<br />
Figure 13. Same as the left panel <strong>of</strong> Figure 11 except with a superimposed 3-D view <strong>of</strong> air parcel simulation<br />
(pink) on MODIS-derived τa and PM2.5 mass concentration. MODIS-derived τa is shown as 2-D color<br />
image and PM2.5 mass concentration the vertical color bar.<br />
Task 3: Evaluate the higher resolutions (e.g., 5×5, 3×3, or 1×1 km 2 ) <strong>of</strong> MODIS aerosol retrievals<br />
for better characterizing aerosol spatial distribution<br />
The MODIS aerosol algorithm was designed with global climate issues in mind to produce a<br />
10×10 km 2 product in a timely fashion (
etrievals at different resolutions and to determine the spatial scale <strong>of</strong> urban aerosol variability.<br />
Figure 14. MODIS-derived τa in metropolitan areas around Great Lakes (e.g., Milwaukee, Chicago, Detroit,<br />
Cleveland, Toronto) on April 26, 2001.<br />
A higher resolution aerosol optical depth product is required to accurately estimate the loadings<br />
on a regional scale. From an air quality assessment perspective, the network <strong>of</strong> ground<br />
measurements may not accurately reflect the geospatial variability <strong>of</strong> a region. The higher resolution<br />
product may be able to provide the information needed to bridge the gaps between ground<br />
sensors with more accuracy and confidence than geostatistics such as kriging. The highresolution<br />
aerosol product will be developed and evaluated as a prototype for the Northeast region<br />
<strong>of</strong> the United States. This will be done as a multi-scale comparison with the 10km standard<br />
product to determine the benefits as well as the computational costs associated with production<br />
<strong>of</strong> the higher resolution dataset.<br />
Task 4: Prototype the development <strong>of</strong> a combined near real-time product utilizing MODIS aerosol<br />
optical depth and EPA PM2.5 mass concentration measurements<br />
In this task we will prototype the development <strong>of</strong> the near-real time product(s) primarily for<br />
use by EPA and state/local air agencies in determining next day PM2.5 air quality levels within<br />
major populated regions <strong>of</strong> the <strong>US</strong>. Our goal in this task is to develop a product that will help<br />
improve the accuracy <strong>of</strong> next day air quality forecast related to <strong>US</strong> EPA’s PM2.5 <strong>Air</strong> Quality Index<br />
(AQI) (EPA,1999b). Because <strong>of</strong> the original nature <strong>of</strong> this product, we will develop it<br />
through an evolutionary approach. This will allow for necessary adjustments <strong>of</strong> the prototype as<br />
it is developed, based upon user feedback, so we can produce a final product that meets expectations<br />
<strong>of</strong> the user community.<br />
As part <strong>of</strong> the currently funded IMAPP project, the standard MODIS aerosol products<br />
(MOD04) will be produced from direct broadcast data for every view <strong>of</strong> the <strong>US</strong>. This near realtime<br />
data is the minimum product necessary to be useful to air quality managers in the <strong>US</strong>. However,<br />
the MODIS data is only one <strong>of</strong> the necessary data streams to generate a truly useful product<br />
for air quality managers and forecasters. The addition <strong>of</strong> near real-time ground level PM2.5 mass<br />
concentration measurements will provide a truly powerful tool to support air quality forecast and<br />
management decisions. To generate this prototype product, we will bring together the MODIS<br />
direct broadcast data and EPA PM2.5 mass concentration data within 1-2 hours <strong>of</strong> data availability.<br />
In addition, we will also bring in meteorological data to help determine synoptic scale<br />
weather patterns that affect the formation, transport, and demise <strong>of</strong> PM2.5.<br />
We plan to use the results <strong>of</strong> the analysis from Tasks 1-3 to determine the optimum suite <strong>of</strong><br />
MODIS-derived aerosol products for the air quality community. The satellite component <strong>of</strong> this<br />
combined product will be produced at the optimum spatial resolution determined by Task 3 with<br />
16
well-understood error bars. Depending on the results <strong>of</strong> Task 1, the product may include pertinent<br />
auxiliary information to help interpret and translate the satellite-derived column values to<br />
important surface-based quantities.<br />
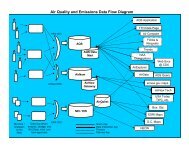
All near real-time data will be brought to one central location, NASA-LaRC AtSC, for processing<br />
and dissemination. Figure 15 shows the proposed data responsibility and flow for the generation<br />
<strong>of</strong> the combined near real-time product. To generate a useful product for use in air quality<br />
forecasting, we will combine the multivariate data in time and space. For this we anticipate using<br />
data fusion s<strong>of</strong>tware, such as VGeo (Virtual Global Explorer and Observatory). VGeo is an interactive<br />
data fusion and visual analysis tool for the construction <strong>of</strong> time varying, threedimensional<br />
data products involving large, multi-variate datasets.<br />
Data Responsibility and Flow for Prototype <strong>Near</strong>-<strong>Real</strong> <strong>Time</strong> Combined MODIS/PM2.5<br />
Product<br />
CIMMS/SSEC<br />
IMAPP<br />
(International; MODIS/AIRS<br />
Processing Package (IMAPP)<br />
for EOS Direct Broadcast Data)<br />
Chemical<br />
DAS<br />
[Assimilation]<br />
RAQMS<br />
MODIS Prototyping Data<br />
10:30 & 1:30<br />
local time<br />
NASA DAO FvDAS<br />
(Data Assimilation Office<br />
Finite vol-<br />
Data Assimilation umeSystem)Reanaly[Assimilasistion] Meteorological<br />
Dat<br />
a<br />
NASA LaRC AtSC<br />
(Prototype DAO near-real time combined<br />
MODIS/PM2.5/Met Off-line data product for air<br />
quality forecasters and managers – produced<br />
within 1 hour <strong>of</strong> receipt <strong>of</strong><br />
MODIS data.)<br />
EPA PM2.5 AIRNow<br />
(<strong>Air</strong> Quality Index<br />
Forecast Submittal System)<br />
<strong>US</strong> EPA/state/local air agencies<br />
dissemination <strong>of</strong> next day PM2.5<br />
<strong>Air</strong> Quality Index through<br />
established communication channels<br />
Figure 15. Data responsibility and flow for the generation <strong>of</strong> the combined near real-time product.<br />
17<br />
EPA AQS/AIRNow<br />
Data Archive<br />
(Central Data Archive for<br />
near-real time data reported<br />
by State/Local Chemical <strong>Air</strong> Agencies)<br />
DAS<br />
[Assimilation]<br />
PM Hourly PM2.5<br />
Data<br />
User Feedback<br />
For improvements
Figure 16. Left panel is a top down view <strong>of</strong> a 3-D false color image <strong>of</strong> MODIS-derived τa and cloud optical<br />
thickness, PM2.5 mass concentration, and NCEP 850mb winds. Right panel is 3-D false color iamge <strong>of</strong><br />
MODIS-derived τa and cloud optical thickness, hourly PM2.5 mass concentration (vertical color bars), and<br />
hourly Hysplit air parcel simulation (pink cubes).<br />
Figure 16 shows picture files extracted from VGeo from previous analysis <strong>of</strong> MODIS aerosol<br />
optical depth and cloud optical depth, hourly PM2.5 TEOM monitors, NCEP reanalysis wind<br />
fields, and Hysplit (Draxler et al., 1997; Draxler et al., 1998) trajectory results for September 10,<br />
2002. In addition to combining these data stream visually, we will also provide near real-time<br />
analysis and results. This will allow for analytical interpretation <strong>of</strong> the visual results, analogous<br />
to that <strong>of</strong> weather forecasting, where visual output is combined with summary site statistics. This<br />
analysis will likely be a subset <strong>of</strong> the analysis conducted under Task 1. The output <strong>of</strong> this analysis<br />
will be combined with the visual output <strong>of</strong> the data fusion product and pushed to a central<br />
EPA site on the WWW used by air quality forecasters.<br />
The prototype <strong>Air</strong> Quality Decision Support Tool is envisioned to have multiple analytic<br />
components beyond aerosol optical depth retrievals and AQI. The user will be able to interactively<br />
query and display data, run simple data mining algorithms such as time series analysis on<br />
the archive, and overlay other geospatial datasets on the aerosol optical depth products to perform<br />
correlative analysis. At the conclusion <strong>of</strong> Task 4 we expect to have a final prototype Decision<br />
Support Tool evaluated by the U.S. EPA and other <strong>Air</strong> Quality management organizations<br />
for near real-time air quality forecasting within the United States and possibly internationally.<br />
5. NRA PROGRAM RELEVANCE<br />
The NRA states, “It is likely that some <strong>of</strong> the EOS data will have immediate applications<br />
relevant to U.S. decision makers, forecast/warning services…. A limited number <strong>of</strong> Science Applications<br />
Projects will be considered for funding to enable real-time deliverables for the decision-support<br />
systems and for shore-term evaluation <strong>of</strong> satellite-observable, environmental conditions<br />
like fire locations, air pollution and aerosol coverage and evolution….”<br />
The MODIS aerosol products from Terra and Aqua have immediate applications for U.S. air<br />
quality managers who need to make decisions and order air quality warnings for the general public.<br />
These managers could use the existing MOD04 (Terra MODIS)/MYDO4 (Aqua MODIS)<br />
products in a near-real-time manner. As a first step we intend to provide the standard product<br />
within the required time frame, at minimal cost to this proposal. However, the value <strong>of</strong> this<br />
product to the <strong>Air</strong> Quality community needs scientific evaluation, and a more appropriate product,<br />
based on the same physics as the standard product, can be developed, implemented and<br />
18
tested within the 3-year duration <strong>of</strong> this current NRA. The proposed research fits the letter and<br />
spirit <strong>of</strong> the Science Applications section <strong>of</strong> the present NRA.<br />
6. MANAGEMENT PLAN<br />
To accomplish the objectives requires a dedicated team to each task with at least one NASA<br />
and one EPA representative on each team. The primary teams are the MODIS Aerosol Team (PI<br />
Chu and Co-I Remer), the CIMMS/SSEC Direct Broadcast Team (Co-I Bryan Baum), the<br />
NASA-LaRC/<strong>US</strong> EPA <strong>Air</strong> Quality Applications Team (Co-Is, Szkyman and Al-Saddi), and the<br />
<strong>US</strong> EPA <strong>Air</strong> Quality Index Team (Co-I Szkyman and EPA Collaborators). The Principal Investigator<br />
will oversee and provide guidance for all tasks, with a particular focus on Tasks 1 and 3.<br />
The <strong>US</strong> EPA Co-Investigator will provide the overall guidance for Tasks 2 and 4. Each team has<br />
its responsibilities headed by PI or Co-I(s). In addition to emails, the effective coordination with<br />
other teams will require monthly teleconferences and quarterly meetings held alternately between<br />
GSFC, CIMMS/SSEC, and EPA. The detailed project schedule and responsibilities are<br />
shown in the next two subsections.<br />
6.1 <strong>Time</strong>line<br />
Table 1. Project Schedule<br />
Task 1<br />
Task 2<br />
Task 3<br />
Task 4<br />
Study the relationship <strong>of</strong> MODIS-derived aerosol optical depth and<br />
PM2.5 mass concentration measured at the surface<br />
19<br />
Start<br />
Date<br />
End<br />
Date<br />
Summarize initial findings <strong>of</strong> MODIS/PM2.5 relationship. 10/01/03 12/31/03<br />
Create central database <strong>of</strong> historical MODIS/PM2.5/meterological data to support analyses<br />
under Task 1 and 2.<br />
10/01/03 12/31/03<br />
Develop detailed methodology for handling multiple data sets and analyses, and develop<br />
computer code.<br />
10/01/03 12/31/03<br />
Process data for co-incident MODIS V3 aerosol and hourly PM2.5 concentrations. 12/01/03 02/28/04<br />
Interpret results and develop necessary statistical model that explain multi-variant relationships<br />
<strong>of</strong> MODIS/PM2.5/meterological data.<br />
03/01/04 06/30/04<br />
Analyze correlation <strong>of</strong> MODIS (V3 & V4) aerosol optical depth and PM2.5 concentration<br />
measurements over entire <strong>US</strong> in four different seasons<br />
10/01/03 09/30/04<br />
Collect and study coherent measurements acquired at GSFC super site and in field deployments<br />
Examine regional aerosol transport pattern in both urban and rural<br />
areas<br />
10/01/03 09/30/05<br />
Review MODIS (V3 and V4) and PM2.5 data to identify suspect PM2.5 regional transport<br />
events<br />
12/01/03 01/31/04<br />
Use MODIS aerosol optical depth (V3 and V4) to develop and run air parcel trajectories for<br />
transport analysis<br />
02/01/04 02/28/04<br />
Characterize synoptic scale weather patterns using NASA DOA (or NCEP) reanalysis data 03/01/04 04/01/04<br />
Interpret results and provide an overall summary <strong>of</strong> regional transport patterns based on<br />
developed data<br />
Evaluate higher resolution (e.g., 5x5, 3x3, or 1x1 km<br />
04/01/04 06/30/04<br />
2 ) <strong>of</strong> MODIS<br />
aerosol retrievals for better characterizing aerosol spatial distribution<br />
Implement necessary changes to MODIS aerosol algorithm for generating high-resolution<br />
aerosol product<br />
10/01/03 12/31/03<br />
Error analysis <strong>of</strong> aerosol optical depths retrieved at different resolutions 01/01/04 03/31/04<br />
Validate the high-resolution retrievals with fine-resolution sunphotometer network<br />
(CLAMS, Baltimore County, etc.)<br />
04/01/04 06/30/04<br />
Apply to the analysis <strong>of</strong> Task 1 in metropolitan areas 07/01/04 09/30/04<br />
Prototype the development <strong>of</strong> a combined near-real time product<br />
utilizing MODIS aerosol optical depth and EPA PM2.5 mass concentration<br />
measurements<br />
Discuss user requirements and data definitions. Design, Develop, and Test s<strong>of</strong>tware for<br />
the receipt <strong>of</strong> near-real time data flow into NASA-LaRC AtsC<br />
07/01/04 09/30/04
Design, Develop, and Test interface with Data Fusion S<strong>of</strong>tware 10/01/04 01/01/05<br />
Design, Develop, Integrate, and Test Initial Combined Product 12/01/04 03/01/05<br />
Test Prototype <strong>of</strong> <strong>Near</strong> <strong>Real</strong>-<strong>Time</strong> Data Fusion and Output 03/01/05 09/30/05<br />
Validate Data Products 06/01/05 12/31/05<br />
Deploy in Operational Test Mode 01/01/06 09/30/06<br />
Operationalize for Transfer to AQ User Community 06/01/06 09/30/06<br />
Note: the start and end dates are based upon the funding beginning on October 1, 2003<br />
6.2 Personnel And Responsibilities<br />
PI Allen Chu has been responsible for the development, implementation, and validation <strong>of</strong><br />
the MODIS aerosol retrieval over land for the past 7 years. He led quality assessment and assurance<br />
<strong>of</strong> MODIS atmosphere products in planning and implementation. For this proposal he will<br />
be responsible for overseeing the entire management <strong>of</strong> the proposed research. He will concentrate<br />
on Task 3 and later on Task 4, while working closely with co-I Szykman on Task 1.<br />
Co-I Lorraine Remer is an established expert in the remote sensing <strong>of</strong> aerosols from satellite,<br />
and assuming that her maintenance/refinement proposal is accepted will be the MODIS team<br />
member responsible for the standard MODIS aerosol algorithm. In terms <strong>of</strong> this proposal she<br />
will be involved with all scientific decisions concerning the MODIS products and air quality, and<br />
will provide advice, as needed.<br />
Co-I James Sykzman is a senior analyst within <strong>US</strong> EPA air program. <strong>Over</strong> the past four<br />
year, he has worked directly with NASA personnel to provide EPA’s input into NASA code YO<br />
Application Program for <strong>Air</strong> Quality. He will coordinate involvement for EPA collaborators on<br />
all tasks and concentrate on Tasks 1, 2, and 4.<br />
Co-I J. A. Al-Saadi and LaRC colleagues conducted the preliminary comparisons <strong>of</strong><br />
MODIS aerosol optical depth and EPA surface PM2.5 measurements shown herein. He will lead<br />
task 4 working closely with the PI and Co-I Szykman, and will be responsible for the administration<br />
<strong>of</strong> the LaRC portion <strong>of</strong> the proposal. He will also assist Co-I Szykman in conducting Tasks 1<br />
and 2.<br />
Co-I Bryan Baum is a respected expert in remote sensing and the processing <strong>of</strong> remote sensing<br />
data. He will work with the personnel at CIMSS <strong>of</strong> University <strong>of</strong> Wisconsin-Madison to help<br />
integrate the aerosol products (MOD04) into the MODIS Direct Broadcast data stream. He will<br />
provide technical expertise to users <strong>of</strong> the aerosol products and provide scientific expertise for<br />
studies involving the aerosol products.<br />
Collaborator E. Judd Welton is a PI <strong>of</strong> MPLnet Project, a global network <strong>of</strong> Micropulse lidar<br />
and is involved in the development and analysis <strong>of</strong> GLAS aerosol data. He will be help in the<br />
use and interpretation <strong>of</strong> the MPL data from GSFC and the ARM Cart site.<br />
Collaborator Eric Vermote is an expert in atmospheric correction and radiative transfer. He<br />
is the MODIS science team member who developed the internal 1 km aerosol product for the<br />
Land team’s atmospheric correction process. In terms <strong>of</strong> this proposal, he will <strong>of</strong>fer advice on<br />
the development <strong>of</strong> fine resolution aerosol products.<br />
Collaborator Fred Dimmick leads <strong>US</strong> EPA’s <strong>Air</strong> Quality Trends Analysis Group and is recognized<br />
expert within the air quality community for developing and providing time relevant integrate<br />
analysis <strong>of</strong> air quality data for all <strong>of</strong> <strong>US</strong> EPA National Ambient <strong>Air</strong> Quality Standard. He<br />
will <strong>of</strong>f advice on the development <strong>of</strong> our integrate data analysis and will be one <strong>of</strong> EPA’s primary<br />
user for the output <strong>of</strong> Tasks 1-4.<br />
Collaborator Richard Wayland is a recognized expert in the field <strong>of</strong> <strong>Air</strong> Quality Forecasting,<br />
and leads <strong>US</strong> EPA’s group responsible for the AIRNow Ozone and PM2.5 <strong>Air</strong> Quality Forecast-<br />
20
ing. He will work closely with PI and Co-I’s Szykman and Al-Saadi to prototype the development<br />
<strong>of</strong> a combined near real-time product under Task 4 for the air quality forecast community.<br />
Collaborator David Williams is a respected expert in remote sensing and data processing. In<br />
terms <strong>of</strong> this proposal, he will <strong>of</strong>fer assistance on the development and validation <strong>of</strong> fine resolution<br />
aerosol products, Task 3, and implementation and evaluation <strong>of</strong> the prototype <strong>Air</strong> Quality<br />
Decision Support Tool at <strong>US</strong> EPA, Task 4.<br />
7. BUDGET AND MANPOWER REQUIREMENTS<br />
7.1 Budget Explanation<br />
• Direct labor represents civil servant salary and benefits contributed by GSFC. The Co-I,<br />
Dr. Lorraine Remer will devote 0.1 FTE (full time equivalent) on this proposal.<br />
• Budget is requested for direct labor charges plus benefit for: one FTE senior researcher<br />
(PI, Dr. D. Allen Chu). (See details in Appendix A)<br />
• The pass-thru grant to the LaRC is tabulated in detail in Appendix B. NASA-LaRC indirect<br />
cost are request for Jim Szykman, <strong>US</strong> EPA civil servant located on-site at NASA-LaRC.<br />
The associated salary costs for Jim Szykman are reflected in Appendix C <strong>of</strong> <strong>US</strong> EPA budget<br />
summaries (EPA In-kind-resource).<br />
• PI travel includes one domestic trip to AMS or AGU in each year, plus one trip for collaborative<br />
discussion between the PI and co-Is each year. We do not anticipate purchasing hardware<br />
or s<strong>of</strong>tware for this study. Cost for supplies include small purchases and publication costs.<br />
• Civil servant travel includes one domestic trip to AGU or other important domestic meeting<br />
in each year.<br />
• Facility and administrative costs are for GSFC indirect charges (see percentages in worksheet)<br />
• Other applicable costs include branch, division and directorate assessments<br />
7.2 Current/Pending Support and Relationship to Other Submitted Proposals<br />
As <strong>of</strong> December 2003, neither PI Chu nor Co-I Remer will have any confirmed continuing<br />
support. Co-I Al-Saadi has the continuing supports listed in the current support below<br />
Current support:<br />
Proposal Title: Infusing Satellite Data into Environmental <strong>Air</strong> Quality Applications<br />
PI: D. O. Neil; Co-I: Al-Saadi; Source <strong>of</strong> Support: NASA Earth Science Applications Office<br />
(NASA Code YO)<br />
Amount <strong>of</strong> Support: 0.50 FTE during FY03-FY05<br />
Proposal Title: Global 3D Model Studies <strong>of</strong> Polar Processes and Radionuclides, with Application<br />
to the Global Modeling Initiative PI: David Considine; Co-I: Al-Saadi; Source <strong>of</strong> Support:<br />
NASA; Amount: 0.25 FTE during FY03<br />
Proposal Title: Analysis <strong>of</strong> <strong>Air</strong>craft and Satellite Measurements <strong>of</strong> Lower Stratospheric Trace<br />
Gases and Lagrangian Photochemical Modeling; PI: R. Bradley Pierce, Co-I: Al-Saadi; Source<br />
<strong>of</strong> Support: NASA; Amount: 0.25 FTE during FY03<br />
Proposals pending, submitted in response to NOAA/NASA JCSDA:<br />
Proposal Title: Assimilation <strong>of</strong> Satellite and Surface Aerosol Measurements into Operational Data<br />
Systems<br />
21
PI: D. Allen Chu; Source <strong>of</strong> Support: NOAA; Amount: $157,000 for two years 2003 – 2005<br />
Proposals pending, submitted to NRA-02-OES-02<br />
Proposal Title: ENSO Climate Variability and its Impact on Stratospheric Ozone; PI: David<br />
Considine, Co-I: J. A. Al-Saadi; Source <strong>of</strong> Support: NASA; Amount: 0.25 FTE<br />
Proposal Title: Assimilation <strong>of</strong> satellite chemical measurements using a hierarchy <strong>of</strong> trajectory,<br />
regional, and global photochemical models; PI: R. Bradley Pierce, Co-I: J. A. Al-Saadi; Source<br />
<strong>of</strong> Support: NASA; Amount: 0.25 FTE<br />
Proposals pending, submitted in response to NRA-02-OES-06 include:<br />
Proposal Title: Combined Active and Passive Measurements for Improved Understanding <strong>of</strong><br />
Aerosol and Cloud Characteristics<br />
PI: Matthew McGill, Co-I: D. Allen Chu; Source <strong>of</strong> Support: NASA; Amount:$700,000 annually<br />
Proposal Title: Integrated Satellite and Cloud Modeling Study <strong>of</strong> Aerosol Effects on Radiation,<br />
Cloud Microphysics and Precipitation in the Boreal Regions<br />
PI: Lorraine Remer; Source <strong>of</strong> Support: NASA; Amount: $167,400 annually<br />
Proposal Title: "IDS proposal: The Global Aerosol System and its direct and indirect forcing <strong>of</strong><br />
climate."<br />
PI: Yoram Kaufman, co-I Lorraine Remer; Source <strong>of</strong> Support: NASA; Amount: $700,000 annually<br />
Proposal Title: Measurement <strong>of</strong> the First Aerosol Indirect Effect at Southern Great Plains using<br />
Ground-based Remote Sensing, Satellite Remote Sensing and Modeling.<br />
PI: Graham Feingold, Co-I Lorraine Remer; Source <strong>of</strong> Support: NASA; Amount: $145,000 annually<br />
Proposals submitted concurrently in response to NRA-03-OES-02:<br />
Proposal Title: <strong>Using</strong> Terra Data to Examine Tropospheric Aerosol and Trace Gas Distribution<br />
PI: David Edwards,Co-I: D. Allen Chu; Source <strong>of</strong> Support: NASA; Amount: $ 734,632 annually<br />
Proposal Title: Maintenance and refinement <strong>of</strong> the global MODIS aerosol products from Terra<br />
and Aqua (MOD04/MYD04)<br />
PI: Lorraine Remer; Source <strong>of</strong> Support: NASA; Amount: $456,600 in FY04<br />
Proposal Title: Measurement based evaluation <strong>of</strong> the aerosol radiative forcing <strong>of</strong> climate<br />
PI: Yoram Kaufman, co-I Lorraine Remer; Source <strong>of</strong> Support: NASA; Amount: $300,000 annually<br />
Relationship to other proposals submitted to this NRA (NRA-02-OES-02):<br />
The Remer proposal submitted above is a maintenance/refinement proposal <strong>of</strong> the existing/standard<br />
MODIS aerosol product. It does not compete with this proposal, which is a science<br />
proposal geared toward understanding the MODIS aerosol products in terms <strong>of</strong> regional and local<br />
air quality applications. The other proposals listed above, submitted to this NRA (Kaufman)<br />
address large-scale global change issues that the standard product was developed to explore.<br />
Thus there is no overlap.<br />
8. CONCL<strong>US</strong>IONS<br />
22
The assembled team for this proposal representing both those at NASA responsible for developing<br />
and evaluating the MODIS aerosol algorithm and those at the EPA representing the<br />
concerns <strong>of</strong> the <strong>Air</strong> Quality community provide a unique fusion <strong>of</strong> experience that can accelerate<br />
the useful application <strong>of</strong> Terra and Aqua MODIS aerosol products for immediate needs in the<br />
U.S. and internationally. The standard MODIS aerosol products provide accurate total column<br />
aerosol information over land and can be used with confidence in global change studies. We<br />
show some preliminary results that suggest that the products are also appropriate on the local and<br />
regional scale for air quality management applications. Although very encouraging, these preliminary<br />
results also show us that scientific uncertainty needs to be narrowed in order to produce<br />
a high quality Decision Support Tool.<br />
9. REFERENCES<br />
Chu, D. A., Y. J. Kaufman, L. A. Remer et al., Remote sensing <strong>of</strong> smoke from MODIS airborne<br />
simulator during SCAR-B experiment, J. Geophys. Res., 103, 31,979-31,987, 1998.<br />
Chu, D. A., Y. J. Kaufman, C. Ichoku et al., Validation <strong>of</strong> MODIS aerosol optical depth retrieval<br />
over land, Geophys. Res. Lett., 29(12), DOI 10.1029/2001GL013205, 2002.<br />
Chu, D. A., Y. J. Kaufman, J-D Chern, J-M Mao, C. Li, H. B. Holben, Global <strong>Monitoring</strong> <strong>of</strong> <strong>Air</strong><br />
<strong>Pollution</strong> over Land from EOS-Terra MODIS, J. Geophys. Res., submitted, 2003.<br />
Draxler, R.R.; Hess, G.D. Description <strong>of</strong> the HYSPLIT_4 modeling system, NOAA Technical<br />
Memorandum ERL ARL-224; Dec.1997, pp.24.<br />
Draxler, R.R.; Hess, G.D. An overview <strong>of</strong> the HYSPLIT_4 modeling system for trajectories, dispersion<br />
and deposition; Aust. Met. Mag. 1998, 47, pp. 295-308.<br />
Eldred, R. A.; Cahill, T.A.; Pitchford, M.; Malm, W.C. IMPROVE – a new remote area particulate<br />
monitoring system for visibility studies; Proc. APCA (<strong>Air</strong> <strong>Pollution</strong> Control Assoc.) Annual<br />
Meeting Pittsburgh, PA. 1988, 81, 1-16, 1988.<br />
Hsu, N. C., J. R. Herman, P. K. Bhartia, C. J. Seftor et al., Detection <strong>of</strong> biomass burning smoke<br />
from TOMS measurements, Geophys. Res. Lett., 23, 745-748, 1996.<br />
Herman, J. R., P. K. Bhartia, O. Torres, N. C. Hsu, C. J. Seftor, and E. Celarier, Global distribution<br />
<strong>of</strong> UV-absorbing aerosols from Nimbus-7/TOMS data, J. Geophys. Res., 102, 16,911-<br />
16,922, 1997.<br />
Kaufman, Y. J., D. Tanre, L. A. Remer, E. F. Vermote, D. A. Chu, B. N. Holben , Operational<br />
remote sensing <strong>of</strong> tropospheric aerosol over the land from EOS-MODIS, J. Geophys. Res.,<br />
102, 17,051-17,061, 1997.<br />
Remer, L. A., Y. J. Kaufman, D. Tanre, S. Mattoo, D. A. Chu, J. V. Martins, R.-R. Li, C. Ichoku,<br />
T. F. Eck, E. Vermote, B. N. Holben, The MODIS aerosol algorithm, products, and validation,<br />
in preparation to be submitted to BAMS, 2003.<br />
Szykman, J., D. Mintz, J. Creilson, M. Wayland, 2002: Impact <strong>of</strong> April 2001 Asian Dust Event<br />
on Particulate Matter Concentrations in the Unites States: A Symposium on <strong>Air</strong> Quality<br />
Methods and Technology. <strong>Air</strong> & Waste Management Association, San Francisco, CA, 13-15<br />
November.<br />
Tanré, D., Y. J. Kaufman, M. Herman, and S. Mattoo, Remote sensing <strong>of</strong> aerosol properties over<br />
oceans using the MODIS/EOS spectral radiances, J. Geophys. Res., 102, 16,971-16,988,<br />
1997.<br />
<strong>US</strong> Environmental Protection Agency, 1997a, National Ambient <strong>Air</strong> Quality Standards for Particulate<br />
Matter; Final Rule. Federal Register, 62FR38652, Washington, D.C., July 18, 1997.<br />
<strong>US</strong> Environmental Protection Agency, 1997b, Revised Requirements for Designation <strong>of</strong> Refer-<br />
23
ence and Equivalent Methods for PM2.5 and Ambient <strong>Air</strong> Quality Surveillance for Particulate<br />
Matter; Final Rule, Federal Register 62FR38763, Washington, D.C., July 18, 1997.<br />
<strong>US</strong> Environmental Protection Agency, 1999a, Regional Haze Regulations; Final Rule, Federal<br />
Register, 64FR35713, Washington, D.C., July 1, 1999.<br />
<strong>US</strong> Environmental Protection Agency, 1999b, <strong>Air</strong> Quality Index Reporting; Final Rule, Federal<br />
Register, 64FR42530, Washington, D.C., August 4, 1999<br />
<strong>US</strong> Environmental Protection Agency , 2001, National <strong>Air</strong> Quality and Emissions Trends Report,<br />
1999, EPA-454/R-01-004, U.S. Environmental Protection Agency, Office <strong>of</strong> <strong>Air</strong> Quality<br />
Planning and Standards, Research Triangle Park, NC 27711, March 2001.<br />
<strong>US</strong> Environmental Protection Agency, 2002, User Guide, <strong>Air</strong> Quality System, Office <strong>of</strong> <strong>Air</strong><br />
Quality Planning and Standards, ITPID/IMG, Research Triangle Park, NC 27711, April 4,<br />
2002.<br />
24