oxidation of c1-c10 hydrocarbons in stoichiometric and lean ...
oxidation of c1-c10 hydrocarbons in stoichiometric and lean ...
oxidation of c1-c10 hydrocarbons in stoichiometric and lean ...

You also want an ePaper? Increase the reach of your titles
YUMPU automatically turns print PDFs into web optimized ePapers that Google loves.
OXIDATION OF C1-C10 HYDROCARBONS IN STOICHIOMETRIC AND LEAN<br />
MIXTURES WITH AIR AND OXYGEN UNDER THE ACTION OF NANOSECOND<br />
DISCHARGE<br />
N.B.Anik<strong>in</strong> ‡ , S.M.Starikovskaia , A.Yu.Starikovskii <br />
Moscow Institute <strong>of</strong> Physics <strong>and</strong> Technology, Dolgoprudny, 141700, Russia<br />
Abstract<br />
The comprehensive experimental <strong>in</strong>vestigation<br />
<strong>of</strong> processes <strong>of</strong> alkanes slow <strong>oxidation</strong> <strong>in</strong> mixtures<br />
with oxygen <strong>and</strong> air under nanosecond uniform<br />
discharge has been performed. We have <strong>in</strong>vestigated<br />
k<strong>in</strong>etics <strong>of</strong> alkanes <strong>oxidation</strong> from methane<br />
to decane <strong>in</strong> <strong>stoichiometric</strong> <strong>and</strong> some <strong>lean</strong> mixtures<br />
with oxygen <strong>and</strong> air at room temperature under<br />
the action <strong>of</strong> high-voltage nanosecond uniform discharge.<br />
The discharge was <strong>in</strong>itiated with repetition<br />
rate 40 Hz by the electric negative polarity<br />
pulses with 10 kV amplitude <strong>and</strong> 25 ns duration<br />
<strong>in</strong> the discharge screened tube with 5 cm diameter<br />
<strong>and</strong> 20 cm length. Mixtures <strong>in</strong>itial pressures<br />
were varied <strong>in</strong> 0.76-10.6 torr range. The discharge<br />
current, electric field <strong>and</strong> <strong>in</strong>put energy have been<br />
measured with nanosecond time resolution. Time<br />
<strong>of</strong> full <strong>oxidation</strong> <strong>of</strong> alkanes was determ<strong>in</strong>ed.<br />
Experiment<br />
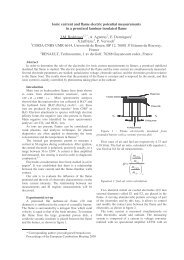
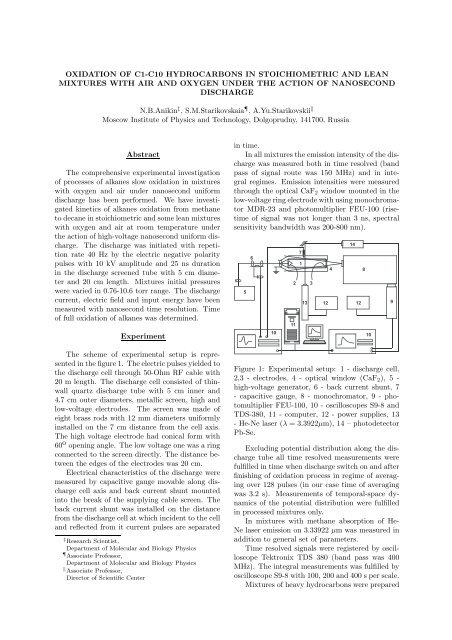
The scheme <strong>of</strong> experimental setup is represented<br />
<strong>in</strong> the figure 1. The electric pulses yielded to<br />
the discharge cell through 50-Ohm RF cable with<br />
20 m length. The discharge cell consisted <strong>of</strong> th<strong>in</strong>wall<br />
quartz discharge tube with 5 cm <strong>in</strong>ner <strong>and</strong><br />
4.7 cm outer diameters, metallic screen, high <strong>and</strong><br />
low-voltage electrodes. The screen was made <strong>of</strong><br />
eight brass rods with 12 mm diameters uniformly<br />
<strong>in</strong>stalled on the 7 cm distance from the cell axis.<br />
The high voltage electrode had conical form with<br />
60 o open<strong>in</strong>g angle. The low voltage one was a r<strong>in</strong>g<br />
connected to the screen directly. The distance between<br />
the edges <strong>of</strong> the electrodes was 20 cm.<br />
Electrical characteristics <strong>of</strong> the discharge were<br />
measured by capacitive gauge movable along discharge<br />
cell axis <strong>and</strong> back current shunt mounted<br />
<strong>in</strong>to the break <strong>of</strong> the supply<strong>in</strong>g cable screen. The<br />
back current shunt was <strong>in</strong>stalled on the distance<br />
from the discharge cell at which <strong>in</strong>cident to the cell<br />
<strong>and</strong> reflected from it current pulses are separated<br />
‡ Research Scientist,<br />
Department <strong>of</strong> Molecular <strong>and</strong> Biology Physics<br />
Associate Pr<strong>of</strong>essor,<br />
Department <strong>of</strong> Molecular <strong>and</strong> Biology Physics<br />
Associate Pr<strong>of</strong>essor,<br />
Director <strong>of</strong> Scientific Center<br />
<strong>in</strong> time.<br />
In all mixtures the emission <strong>in</strong>tensity <strong>of</strong> the discharge<br />
was measured both <strong>in</strong> time resolved (b<strong>and</strong><br />
pass <strong>of</strong> signal route was 150 MHz) <strong>and</strong> <strong>in</strong> <strong>in</strong>tegral<br />
regimes. Emission <strong>in</strong>tensities were measured<br />
through the optical CaF2 w<strong>in</strong>dow mounted <strong>in</strong> the<br />
low-voltage r<strong>in</strong>g electrode with us<strong>in</strong>g monochromator<br />
MDR-23 <strong>and</strong> photomultiplier FEU-100 (risetime<br />
<strong>of</strong> signal was not longer than 3 ns, spectral<br />
sensitivity b<strong>and</strong>width was 200-800 nm).<br />
Figure 1: Experimental setup: 1 - discharge cell,<br />
2,3 - electrodes, 4 - optical w<strong>in</strong>dow (CaF2), 5 -<br />
high-voltage generator, 6 - back current shunt, 7<br />
- capacitive gauge, 8 - monochromator, 9 - photomultiplier<br />
FEU-100, 10 - oscilloscopes S9-8 <strong>and</strong><br />
TDS-380, 11 - computer, 12 - power supplies, 13<br />
- He-Ne laser (λ =3.3922µm), 14 – photodetector<br />
Pb-Se.<br />
Exclud<strong>in</strong>g potential distribution along the discharge<br />
tube all time resolved measurements were<br />
fulfilled <strong>in</strong> time when discharge switch on <strong>and</strong> after<br />
f<strong>in</strong>ish<strong>in</strong>g <strong>of</strong> <strong>oxidation</strong> process <strong>in</strong> regime <strong>of</strong> averag<strong>in</strong>g<br />
over 128 pulses (<strong>in</strong> our case time <strong>of</strong> averag<strong>in</strong>g<br />
was 3.2 s). Measurements <strong>of</strong> temporal-space dynamics<br />
<strong>of</strong> the potential distribution were fulfilled<br />
<strong>in</strong> processed mixtures only.<br />
In mixtures with methane absorption <strong>of</strong> He-<br />
Ne laser emission on 3.33922 µm was measured <strong>in</strong><br />
addition to general set <strong>of</strong> parameters.<br />
Time resolved signals were registered by oscilloscope<br />
Tektronix TDS 380 (b<strong>and</strong> pass was 400<br />
MHz). The <strong>in</strong>tegral measurements was fulfilled by<br />
oscilloscope S9-8 with 100, 200 <strong>and</strong> 400 s per scale.<br />
Mixtures <strong>of</strong> heavy <strong>hydrocarbons</strong> were prepared
under condition when partial pressure <strong>of</strong> an alkane<br />
lower than saturated vapor pressure at room temperature.<br />
A portion <strong>of</strong> an alkane was <strong>in</strong>jected <strong>in</strong>to<br />
the 10-liter vacuum-processed. The mass <strong>of</strong> the<br />
protion was smaller on 20% than mass <strong>of</strong> saturated<br />
vapor pressure <strong>of</strong> this alkane <strong>in</strong> this volume<br />
at room temperature. The control <strong>of</strong> pressure <strong>of</strong><br />
gas <strong>in</strong> the volume allowed to measure the alkane<br />
concentration <strong>in</strong> the volume. Later we filled the<br />
volume by the oxygen up to the required pressure.<br />
Results <strong>and</strong> discussion<br />
K<strong>in</strong>etics <strong>of</strong> alkanes <strong>oxidation</strong> <strong>in</strong> the discharge.<br />
Stoichiometric mixtures<br />
Figure 2: Spectrum <strong>of</strong> the discharge emission a)<br />
— <strong>in</strong> pure methane <strong>and</strong> b) — <strong>in</strong> the processed<br />
methane-oxygen mixture. The pressure is 4 torr<br />
Emission spectra <strong>of</strong> the discharge <strong>in</strong> the pure<br />
methane <strong>and</strong> <strong>in</strong> the processed methane-oxygen<br />
<strong>stoichiometric</strong> mixture are represented <strong>in</strong> the figure<br />
2. The spectrum <strong>in</strong> the pure methane consist<br />
<strong>of</strong> the repulsive cont<strong>in</strong>uum <strong>of</strong> hydrogen (the<br />
transition H2(a 3 Π − b 3 Σ)). The emission b<strong>and</strong><br />
<strong>of</strong> CH(A 2 ∆ → X 2 Π)which corresponds to the<br />
transition v ′ = 0 → v ′′ = 0 is good identified.<br />
The ma<strong>in</strong> part <strong>of</strong> molecular b<strong>and</strong>s <strong>of</strong> visible<br />
<strong>and</strong> near ultraviolet ranges, which appears <strong>in</strong><br />
the processed methane-oxygen mixture, belongs to<br />
the molecule CO + 2 (A2 Π). B<strong>and</strong>s <strong>of</strong> the radical<br />
OH(A 2 Σ → X 2 Π)are also clearly st<strong>and</strong>s out. We<br />
are able to identify <strong>and</strong> control some weak b<strong>and</strong>s<br />
<strong>of</strong> CO Angstrom system (CO(B 1 Σ → A 1 Π)).<br />
From the figure it is clearly seen that the<br />
CH(A 2 ∆ → X 2 Π) b<strong>and</strong> emission <strong>in</strong> the methane<br />
strongly overlaps by the CO + 2 (A2 Π → X 2 Π) <strong>in</strong><br />
the mixture. Hence, on the early stage <strong>of</strong> methaneoxygen<br />
mixture process<strong>in</strong>g it is important to take<br />
necessary steps to separate these b<strong>and</strong>s. The<br />
OH(A 2 Σ → X 2 Π) spectrum also overlaps by the<br />
CO + 2 emission spectrum. In mixtures <strong>of</strong> alkanes<br />
with air multiple <strong>and</strong> strong b<strong>and</strong>s <strong>of</strong> 1-st negative<br />
<strong>and</strong> 1-st <strong>and</strong> 2-nd positive systems <strong>of</strong> nitrogen<br />
appear <strong>in</strong> the spectrum. They partially overlap the<br />
emission spectrum <strong>of</strong> CH, CO + 2 <strong>and</strong> OH b<strong>and</strong>s. In<br />
the system <strong>of</strong> Angstrom the b<strong>and</strong> on the 518.6 nm<br />
is not overlaped by another b<strong>and</strong>s. In all experiments<br />
weak l<strong>in</strong>es <strong>of</strong> Balmer series <strong>of</strong> hydrogen were<br />
observed.<br />
As it has been <strong>in</strong>dicated above, the identification<br />
<strong>of</strong> b<strong>and</strong>s <strong>in</strong> the case, when they overlap <strong>in</strong><br />
a narrow spectral b<strong>and</strong>, was realized on the basis<br />
<strong>of</strong> the time-resolved experiments with nanosecond<br />
resolution. The listed b<strong>and</strong>s <strong>of</strong> the molecules were<br />
registered <strong>in</strong> all <strong>in</strong>vestigated <strong>stoichiometric</strong> mixtures,<br />
both <strong>in</strong> mixtures with oxygen <strong>and</strong> with air,<br />
<strong>and</strong> these b<strong>and</strong>s were used as <strong>in</strong>dicators <strong>of</strong> <strong>hydrocarbons</strong><br />
<strong>oxidation</strong> process <strong>in</strong> the discharge.<br />
Tak<strong>in</strong>g <strong>in</strong>to account quench<strong>in</strong>g constants <strong>and</strong><br />
life-time <strong>of</strong> these states, measured <strong>in</strong> time-resolved<br />
experiments, excitation rates <strong>of</strong> emitt<strong>in</strong>g states <strong>in</strong>tegrated<br />
over the discharge action time were reconstructed.<br />
It is necessary to note that quench<strong>in</strong>g<br />
constants <strong>of</strong> ions CO + 2 (B2Σ), CO + 2 (A2Π) <strong>and</strong><br />
N + 2 (B2Σ) by reagents <strong>and</strong> products are not differ<br />
practically. On the contrary, quench<strong>in</strong>g constants<br />
<strong>of</strong> CO(B1Σ), CH(A2∆) <strong>and</strong> OH(A2Σ) states<br />
are approximately 30-50% higher <strong>in</strong> products than<br />
these <strong>in</strong> reagents. This fact can be expla<strong>in</strong>ed by<br />
appearance <strong>of</strong> water <strong>in</strong> the products.<br />
In <strong>stoichiometric</strong> mixtures <strong>of</strong> alkanes with air<br />
excitation rates <strong>of</strong> N2(C 3Π,v ′ = 1), N2(B3Π,v ′ =<br />
6) <strong>and</strong> N + 2 (B2Σ,v ′ = 0) have been obta<strong>in</strong>ed on the<br />
basis <strong>of</strong> the time-resolved emission <strong>of</strong> transitions<br />
N2(C 3Π,v ′ =1→ B3Π,v ′′ = 7), N2(B3Π,v ′ =<br />
6 → A3Σ,v ′′ = 3) <strong>and</strong> N + 2 (B2Σ,v ′ = 0 →<br />
X2Σ,v ′′ = 2). These rates were reconstructed<br />
at the <strong>in</strong>stant <strong>of</strong> time when discharge switched on<br />
<strong>and</strong> after the <strong>oxidation</strong> is fulfilled. We <strong>in</strong>tegrated<br />
these rates over the time <strong>of</strong> the discharge. It has<br />
been shown that the <strong>in</strong>tegral rates <strong>in</strong> the <strong>in</strong>stant<br />
<strong>of</strong> time corresponded to the discharge beg<strong>in</strong>n<strong>in</strong>g<br />
are not changed to the <strong>in</strong>stant, when <strong>oxidation</strong><br />
was fulfilled, on 10% for N2(C 3Π) <strong>and</strong> N + 2 (B2Σ) states. At that, <strong>in</strong> the process <strong>of</strong> <strong>oxidation</strong> the<br />
rate <strong>of</strong> N + 2 (B2Σ,v ′ = 0) state excitation dim<strong>in</strong>ished<br />
on 25% approximately. It has been shown<br />
that N2(C 3Π,v ′ = 1) <strong>and</strong> N + 2 (B2Σ,v ′ = 0) states<br />
are excited by the direct electron impact from the<br />
ground state <strong>of</strong> molecular nitrogen. Inasmuch as<br />
<strong>in</strong> the discharge the nitrogen concentration is practically<br />
constant that the <strong>in</strong>tegral rates constants <strong>of</strong><br />
N2(C 3Π,v ′ = 1) <strong>and</strong> N + 2 (B2Σ,v ′ = 0) sates excitation<br />
are changed <strong>in</strong> the process <strong>of</strong> <strong>oxidation</strong> on<br />
10% <strong>and</strong> 25% correspond<strong>in</strong>gly. We noted that the<br />
excitation <strong>of</strong> N2(C 3Π,v ′ = 1) <strong>and</strong> N + 2 (B2Σ,v ′ =<br />
0) takes place dur<strong>in</strong>g the pulses <strong>of</strong> the highvoltage,<br />
at that time N2(B3Π,v ′ = 6) excites
<strong>in</strong> the discharge afterglow <strong>in</strong> generally <strong>and</strong> its excitation<br />
rate was correlated with the emission <strong>of</strong><br />
N2(C 3 Π,v ′ =1→ B 3 Π,v ′′ = 7) transition. From<br />
this fact followed that the N2(B 3 Π,v ′ = 6) state<br />
excited <strong>in</strong> processes <strong>of</strong> deactivation <strong>of</strong> N2(C 3 Π)<br />
state. Thresholds <strong>of</strong> excitation <strong>of</strong> N2(C 3 Π,v ′ =<br />
1) <strong>and</strong> N + 2 (B2 Σ,v ′ = 0) states by electron impact<br />
are equal to ∼12 <strong>and</strong> 19 eV correspond<strong>in</strong>gly. Inasmuch<br />
as thresholds <strong>of</strong> all <strong>in</strong>vestigated states are<br />
lower than 19 eV, it can be assumed that constant<br />
rates <strong>of</strong> excitation <strong>of</strong> these electronic states <strong>in</strong>tegrated<br />
over the discharge emission time were not<br />
changed more than on 25% dur<strong>in</strong>g the <strong>oxidation</strong><br />
process. At the same time the threshold is lower<br />
the change <strong>of</strong> rate constant <strong>in</strong> <strong>oxidation</strong> process is<br />
smaller.<br />
Thus, composition mixture changes <strong>in</strong> the <strong>oxidation</strong><br />
process is caused by changes <strong>of</strong> quench<strong>in</strong>g<br />
<strong>and</strong> excitation rates change an <strong>in</strong>tegral <strong>in</strong>tensity <strong>of</strong><br />
any controlled b<strong>and</strong> no more than 50 %. Hence,<br />
on the basis <strong>of</strong> the <strong>in</strong>tegral emission <strong>in</strong>tensity we<br />
can obta<strong>in</strong> qualitative dependencies <strong>of</strong> concentrations,<br />
from which produced excited states. At the<br />
same time this fact weakly <strong>in</strong>fluences on the characteristic<br />
time obta<strong>in</strong>ed from the <strong>in</strong>tegral emission<br />
<strong>of</strong> transitions CO(B 1 Σ → A 1 Π), CO + 2 (B2 Σ →<br />
X 2 Π), OH(A 2 Σ → X 2 Π) <strong>and</strong> CH(A 2 ∆ → X 2 Π).<br />
Figure 3: Integral over time emission <strong>in</strong>tensities <strong>of</strong><br />
transitions CH(A 2 ∆ → X 2 Π), CO(B 1 Σ → A 1 Π),<br />
OH(A 2 Σ → X 2 Π) <strong>and</strong> methane concentration,<br />
measured by the absorption <strong>of</strong> the He-Ne laser<br />
emission on the wavelenght λ = 3.3922µ m, <strong>in</strong><br />
the discharge. The <strong>in</strong>itial pressure <strong>of</strong> the mixture<br />
CH4+O2 is 7.56 torr<br />
The dependencies <strong>of</strong> the <strong>in</strong>tegral <strong>in</strong>tensity <strong>of</strong><br />
the emission on time <strong>in</strong> the methane mixtures were<br />
approximated by the function exp(−t/τ(p)) or the<br />
function 1 − exp(−t/τ(p)) with the good accuracy<br />
(see figure 3). It is necessary to note that <strong>in</strong> the<br />
experiment the full <strong>oxidation</strong> <strong>of</strong> methane was registered<br />
that clearly seen by the [CH4](t) curve obta<strong>in</strong>ed<br />
from laser absorption measurements <strong>in</strong> the<br />
figure 3. Here you can see the <strong>in</strong>tegral emission <strong>of</strong><br />
CH(A 2 ∆ → X 2 Π) radical. It is clearly seen, that<br />
beg<strong>in</strong>n<strong>in</strong>g with the discharge practically the curve<br />
<strong>of</strong> the emission <strong>in</strong>tensity <strong>of</strong> CH(A 2 ∆ → X 2 Π) is<br />
not differ form the methane concentration curve.<br />
This fact allows to assume that the CH(A 2 ∆ →<br />
X 2 Π) emission is the good <strong>in</strong>dicator <strong>of</strong> <strong>hydrocarbons</strong><br />
<strong>in</strong> the discharge.<br />
Figure 4: Integral over time emission <strong>in</strong>tensities <strong>of</strong><br />
transitions CH(A 2 ∆ → X 2 Π), CO(B 1 Σ → A 1 Π),<br />
CO + 2 (B2 Σ → X 2 Π) <strong>and</strong> OH(A 2 Σ → X 2 Π) <strong>in</strong><br />
the discharge. The <strong>in</strong>itial pressure <strong>of</strong> the mixture<br />
C2H6+O2 is 7.56 torr<br />
In mixtures <strong>of</strong> alkanes, which is more heavy<br />
than methane, dependencies <strong>of</strong> emission have more<br />
comprehensive form that can be expla<strong>in</strong>ed by accumulation<br />
<strong>of</strong> <strong>in</strong>termediates (probably CO <strong>and</strong> unsaturated<br />
<strong>hydrocarbons</strong>) <strong>in</strong> the alkane <strong>oxidation</strong><br />
process <strong>and</strong> consequent those after<strong>oxidation</strong>. The<br />
example <strong>of</strong> <strong>in</strong>tegral <strong>oxidation</strong> <strong>of</strong> the ethane for<br />
7.54 torr pressure is represented <strong>in</strong> the figure 4.<br />
It is clearly seen that curves are not described by<br />
simple functions <strong>and</strong> essentially differ from each<br />
other.<br />
Time <strong>of</strong> full <strong>oxidation</strong> is def<strong>in</strong>ed as time at<br />
which the signal from photomultiplier reaches level<br />
<strong>of</strong> 0.95I∞ for wavelengths (290 <strong>and</strong> 307,8 nm) corresponded<br />
to OH(A 2 Σ → X 2 Π) <strong>and</strong> CO(B 1 Σ →<br />
A 1 Π) transition <strong>and</strong> level 1.05I∞ for wavelengths<br />
(430 <strong>and</strong> 518.6 nm) corresponded to CO + 2 (B2 Σ →<br />
X 2 Π) <strong>and</strong> CH(A 2 ∆ → X 2 Π) transitions.<br />
It is important to note that times <strong>of</strong> <strong>oxidation</strong><br />
obta<strong>in</strong>ed from emission <strong>of</strong> different b<strong>and</strong>s <strong>in</strong> the
same experimental condition are rather different,<br />
ow<strong>in</strong>g to different <strong>in</strong>fluence <strong>of</strong> processes <strong>of</strong> excitation<br />
<strong>and</strong> quench<strong>in</strong>g on different states dur<strong>in</strong>g the<br />
mixture transformation, but times obta<strong>in</strong>ed from<br />
emission <strong>of</strong> the same b<strong>and</strong> <strong>in</strong> different mixtures<br />
are practically the same with<strong>in</strong> the experimental<br />
accuracy. Because <strong>of</strong> the fact that the experimental<br />
dispersion is m<strong>in</strong>imal for the time obta<strong>in</strong>ed<br />
from CO(B 1 Σ → A 1 Π)b<strong>and</strong> emission, we designate<br />
time obta<strong>in</strong>ed from the emission <strong>of</strong> this b<strong>and</strong><br />
as the time <strong>of</strong> alkane full <strong>oxidation</strong>.<br />
In the figure 5 times <strong>of</strong> full <strong>oxidation</strong> for different<br />
alkanes are represented. It is clearly seen, that<br />
time <strong>of</strong> methane full <strong>oxidation</strong> is nearly twice as<br />
large as times <strong>of</strong> full <strong>oxidation</strong> for other alkanes as<br />
<strong>in</strong> mixtures with oxygen so <strong>in</strong> mixtures with air.<br />
For other alkanes times <strong>of</strong> full <strong>oxidation</strong> are not<br />
differ with the experimental dispersion. In mixture<br />
with air times <strong>of</strong> full <strong>oxidation</strong> are twice or<br />
more as small as times <strong>in</strong> the same mixtures with<br />
oxygen. Tak<strong>in</strong>g <strong>in</strong>to account that total quantity <strong>of</strong><br />
alkanes smaller <strong>in</strong> <strong>stoichiometric</strong> mixtures with air<br />
than one <strong>in</strong> mixtures with oxygen, rates <strong>of</strong> allkanes<br />
<strong>in</strong> mixtures with oxygen <strong>oxidation</strong> are twice as<br />
small as one <strong>in</strong> mixtures with oxygen.<br />
Thus, <strong>stoichiometric</strong> mixtures <strong>of</strong> alkanes with<br />
air <strong>and</strong> oxygen under nanosecond uniform discharge<br />
action at ambient temperature have been<br />
oxidized entirely. Oxidation <strong>of</strong> all alkanes beg<strong>in</strong>n<strong>in</strong>g<br />
with ethane takes place for the same time<br />
<strong>in</strong> <strong>stoichiometric</strong> mixtures. The methane oxidizes<br />
<strong>in</strong> two times more slowly than other <strong>in</strong>vestigated<br />
alkanes.<br />
C4H10 <strong>oxidation</strong> <strong>in</strong> <strong>lean</strong> mixtures with oxygen<br />
under nanosecond discharge<br />
As <strong>in</strong>dicated above, <strong>oxidation</strong> <strong>of</strong> alkanes beg<strong>in</strong>n<strong>in</strong>g<br />
with ethane under nanosecond discharge action<br />
proceeds for the same time under the same<br />
experimental conditions (<strong>in</strong>itial pressure, energy<br />
<strong>in</strong>put). One can expla<strong>in</strong> this fact most logically<br />
<strong>in</strong> approximation <strong>of</strong> weak <strong>in</strong>fluence <strong>of</strong> excited <strong>and</strong><br />
charged particles produc<strong>in</strong>g by electron impact<br />
to molecules <strong>of</strong> fuel <strong>in</strong> compare with <strong>in</strong>fluence <strong>of</strong><br />
the impact to molecules <strong>of</strong> oxygen, <strong>in</strong>termediates<br />
<strong>and</strong> products, at first time water. It is known<br />
that electron impact thresholds <strong>of</strong> alkanes (<strong>in</strong> set<br />
methane–propane) dissociation reduce on 1 eV approximately<br />
with a <strong>in</strong>creas<strong>in</strong>g on a carbon’s atom.<br />
Steric factor <strong>in</strong>creases proportionally to a quantity<br />
<strong>of</strong> C atom <strong>in</strong> molecules <strong>of</strong> alkanes, at the<br />
same time a concentration <strong>of</strong> an alkan <strong>in</strong> <strong>stoichiometric</strong><br />
mixture decreases <strong>in</strong>versely proportional to<br />
the quantity <strong>of</strong> C atom. Thus, it should be expected,<br />
that with change <strong>of</strong> <strong>stoichiometric</strong> mixtures<br />
from light to heavy alkanes the variation <strong>of</strong><br />
an alkane concentration be compensated by variation<br />
<strong>of</strong> steric factor. However, with a quantity<br />
Figure 5: Dependencies <strong>of</strong> alkanes full <strong>oxidation</strong><br />
times on <strong>in</strong>itial pressures <strong>of</strong> <strong>stoichiometric</strong> mixtures,<br />
obta<strong>in</strong>ed from CO(B 1 Σ → A 1 Π) b<strong>and</strong> emission.<br />
The data for the <strong>stoichiometric</strong> mixtures <strong>of</strong><br />
oxygen with alkanes from ethane to hexane are<br />
denoted as “C2–C6+O2”, <strong>and</strong> data for the <strong>stoichiometric</strong><br />
mixtures <strong>of</strong> oxygen with alkanes from<br />
ethane to hexane are denoted as “C5–C6+air” (see<br />
table 1 <strong>and</strong> 4)<br />
<strong>of</strong> carbon’s atom <strong>in</strong> an alkane molecule <strong>in</strong>creas<strong>in</strong>g<br />
a dissociation threshold by electron impact is decreased.<br />
It should be expected, <strong>of</strong> course, faster<br />
<strong>oxidation</strong> <strong>of</strong> more heavy alkanes <strong>in</strong> compare with<br />
more lightly, which did not obta<strong>in</strong> <strong>in</strong> experiments.<br />
Let us consider possible explanations <strong>of</strong> this fact.<br />
Figure 6: The sum <strong>of</strong> the energy <strong>in</strong>put <strong>in</strong> the first<br />
<strong>and</strong> the second high-voltage pulses: a) <strong>in</strong> the <strong>in</strong>itial<br />
mixture, b) <strong>in</strong> the mixture transformed by the<br />
discharge<br />
Excitation <strong>of</strong> molecular oxygen, its dissociation<br />
<strong>and</strong> ionization <strong>and</strong> so may be excitation <strong>and</strong> dissociation<br />
<strong>of</strong> products (at first time water) <strong>and</strong> <strong>in</strong>termediates<br />
entirely govern the alkanes <strong>oxidation</strong>.<br />
It is need to note, that <strong>in</strong> <strong>stoichiometric</strong> mixtures<br />
the quantity <strong>of</strong> oxygen is weakly varied from an<br />
alkane to another alkane <strong>and</strong> after process<strong>in</strong>g <strong>in</strong><br />
all mixtures the same quantity <strong>of</strong> water is produced.<br />
Difference <strong>in</strong> quantity <strong>of</strong> the carbon diox-
ide produced <strong>in</strong> <strong>oxidation</strong> process <strong>in</strong> all mixtures<br />
is negligible. So, the quantity <strong>of</strong> oxygen <strong>in</strong> <strong>stoichiometric</strong><br />
mixture with ethane is 20% lower than<br />
it <strong>in</strong> mixture with hexane, on the same percents<br />
quantity <strong>of</strong> carbon dioxide produced <strong>in</strong> <strong>oxidation</strong><br />
process is lower. It is necessary to note that water<br />
dissociates by electron impact more easily <strong>in</strong><br />
comparison with carbon dioxide — water has lager<br />
absolute values <strong>of</strong> cross-sections <strong>of</strong> electron impact<br />
processes <strong>and</strong> essentially lowers thresholds; radicals<br />
generated from water are more active.<br />
Figure 7: Integral over time emission <strong>in</strong>tensities<br />
<strong>of</strong> transition CO(B 1 Σ → A 1 Π) <strong>in</strong> the discharge.<br />
The <strong>in</strong>itial pressures <strong>of</strong> the mixtures are 1.51 torr<br />
for a), 5.29 torr for b) <strong>and</strong> 9.83 tor for c)<br />
Thus, produced active particles <strong>of</strong> oxidant react<br />
with non-excited hydrocarbon’s molecules, at that<br />
excitation, dissociation <strong>and</strong> ionization <strong>of</strong> <strong>hydrocarbons</strong><br />
itself do not <strong>in</strong>fluence on <strong>oxidation</strong> rate. Us<strong>in</strong>g<br />
the methods described above, we have <strong>in</strong>vestigated<br />
<strong>oxidation</strong> <strong>of</strong> <strong>lean</strong> mixture <strong>of</strong> butane with<br />
oxygen. In the figure 6 the energy <strong>in</strong>put for <strong>stoichiometric</strong><br />
<strong>and</strong> some <strong>lean</strong> mixtures <strong>in</strong> dependence<br />
on the mixture pressure is represented. It is clearly<br />
seen that changes <strong>of</strong> energy <strong>in</strong>put with equivalence<br />
ratio are not higher than 13% <strong>of</strong> pulse energy <strong>and</strong><br />
specifically small for the range <strong>of</strong> maximum energy<br />
<strong>in</strong>put <strong>in</strong> the <strong>in</strong>itial mixture. And so we can assume<br />
that the discharge condition, which control excitation<br />
processes are not differ essentially for mixtures<br />
with different equivalence ratio from 0 to 1. In the<br />
figure 7 dynamics <strong>of</strong> the CO(B 1 Σ → A 1 Π) <strong>in</strong>tegral<br />
emission <strong>in</strong> the <strong>in</strong>vestigated mixtures is represented.<br />
It has clearly seen that with decreas<strong>in</strong>g<br />
<strong>of</strong> the equivalence ratio the time <strong>of</strong> full <strong>oxidation</strong><br />
decreases. Based on this, we discard the second<br />
hypothesis. Really, if the <strong>oxidation</strong> time is controlled<br />
by rates <strong>of</strong> excitation, dissociation <strong>and</strong> ionization<br />
<strong>of</strong> butane, then the time <strong>of</strong> full <strong>oxidation</strong><br />
should not depend on the equivalence ratio, because<br />
with decreas<strong>in</strong>g <strong>of</strong> the equivalence ratio the<br />
<strong>in</strong>itial concentration <strong>of</strong> butane <strong>and</strong> the rate <strong>of</strong> <strong>oxidation</strong><br />
decrease proportionally. Also it is necessary<br />
to note that there are grow<strong>in</strong>g parts <strong>of</strong> emission<br />
curves which practically co<strong>in</strong>cides to each over.<br />
Time <strong>of</strong> full <strong>oxidation</strong> obta<strong>in</strong>ed from CO(B 1 Σ →<br />
A 1 Π) <strong>in</strong>tegral emission <strong>and</strong> time <strong>of</strong> <strong>of</strong> maximum <strong>of</strong><br />
CO(B 1 Σ → A 1 Π) emission are represented <strong>in</strong> the<br />
figure 8. It is clearly seen that the time decreases<br />
l<strong>in</strong>early with decreas<strong>in</strong>g the equivalence ratio that<br />
should be expected <strong>in</strong> the case <strong>of</strong> weak <strong>in</strong>fluence <strong>of</strong><br />
excitation, dissociation <strong>and</strong> ionization <strong>of</strong> alkanes<br />
by the discharge. Really, the quantity <strong>of</strong> oxygen <strong>in</strong><br />
<strong>stoichiometric</strong> mixture differs from it <strong>in</strong> mixture<br />
with equivalence ratio 0.1 on 11%, hence variations<br />
<strong>of</strong> concentrations <strong>of</strong> excited molecules, ions<br />
<strong>and</strong> atoms <strong>of</strong> oxygen no more than 11%. At the<br />
same time the concentration <strong>of</strong> butane changes <strong>in</strong><br />
one order <strong>of</strong> magnitude, therefore dependence <strong>of</strong><br />
time <strong>of</strong> full <strong>oxidation</strong> on equivalence ratio have to<br />
be l<strong>in</strong>ear with the good accuracy.<br />
Figure 8: Time <strong>of</strong> full <strong>oxidation</strong> obta<strong>in</strong>ed from<br />
CO(B 1 Σ → A 1 Π) b<strong>and</strong> emission - a) <strong>and</strong> time<br />
<strong>of</strong> CO(B 1 Σ → A 1 Π) b<strong>and</strong> emission maximum<br />
versus <strong>in</strong>itial pressure <strong>of</strong> butane with oxygen <strong>lean</strong><br />
mixtures<br />
Thus, under our experimental condition, excitation,<br />
ionization <strong>and</strong> dissociation <strong>of</strong> an alkane<br />
by electron impact did not <strong>in</strong>fluence on the rate<br />
<strong>of</strong> the alkane <strong>oxidation</strong>. The <strong>oxidation</strong> process is<br />
controlled by processes <strong>of</strong> produc<strong>in</strong>g <strong>of</strong> ions, excited<br />
molecules <strong>and</strong> atoms from oxygen, water, <strong>and</strong><br />
carbon dioxide <strong>and</strong> probably from <strong>in</strong>termediates,<br />
which produce on the early stage <strong>of</strong> <strong>hydrocarbons</strong><br />
<strong>oxidation</strong> process.<br />
C10H22 <strong>oxidation</strong> <strong>in</strong> <strong>lean</strong> mixture with oxygen<br />
under nanosecond discharge action<br />
Real fuels used <strong>in</strong> <strong>in</strong>ternal-combustion eng<strong>in</strong>es<br />
consist <strong>of</strong> <strong>hydrocarbons</strong> C8-C16, therefore it should<br />
be exam<strong>in</strong>ate universality <strong>of</strong> above drawn conclusions<br />
on the example <strong>of</strong> alkane higher than C6. For<br />
this work we chouse n-decane C10H22. At 25 o C<br />
saturated vapor pressure <strong>of</strong> n-decane is equal 0.9<br />
torr, <strong>and</strong> so the maximal pressure <strong>of</strong> <strong>stoichiometric</strong><br />
mixture with oxygen is equal 18 torr. The preparation<br />
<strong>of</strong> the mixture was analogous as for hexane<br />
<strong>and</strong> pentane mixtures. A portion <strong>of</strong> decane was <strong>in</strong>jected<br />
<strong>in</strong>to the 10-liter vacuum-processed volume.<br />
The portion <strong>of</strong> decane was smaller than value <strong>of</strong><br />
saturated vapor pressure <strong>of</strong> n-decane at 25 o C<strong>in</strong><br />
10-liter volume. Later we added oxygen <strong>in</strong>to the<br />
volume. The mixture was mixed by ventilator. In<br />
spite <strong>of</strong> the forced mix<strong>in</strong>g, concentration <strong>of</strong> decane<br />
<strong>in</strong>creases very slowly, that we expla<strong>in</strong>ed by very<br />
slow evaporation <strong>of</strong> decane under ambient temperature<br />
condition.<br />
As unit was used the emission <strong>in</strong>tensity <strong>of</strong><br />
OH(A 2 Σ → X 2 Π) <strong>in</strong> the processed <strong>stoichiometric</strong><br />
mixture <strong>of</strong> butane with oxygen. We controlled the
concentration <strong>of</strong> decane by follow<strong>in</strong>g method. The<br />
current mixture was oxidized <strong>in</strong> nanosecond discharge.<br />
The spectrum <strong>of</strong> emission <strong>of</strong> the mixture<br />
compared with spectra obta<strong>in</strong>ed <strong>in</strong> processed mixtures<br />
<strong>of</strong> butane <strong>and</strong> oxygen with different equivalence<br />
ratios. Emission <strong>in</strong>tensities <strong>of</strong> OH <strong>and</strong> CO + 2<br />
b<strong>and</strong>s <strong>in</strong> processed butane-oxygen mixtures upon<br />
equivalence ratio, which are used to obta<strong>in</strong> decane<br />
concentration depend on equivalence ratio essentially<br />
non-l<strong>in</strong>early. We expla<strong>in</strong>ed this fact by the<br />
<strong>in</strong>fluence <strong>of</strong> concentration <strong>of</strong> water on electron energy<br />
distribution function that is by changes <strong>of</strong><br />
constants <strong>of</strong> excitation <strong>of</strong> these states by electron<br />
impact with water concentration changes. In this<br />
figure also emission <strong>in</strong>tensities <strong>of</strong> processed decane<br />
oxygen mixture on the same wavelengths are represented.<br />
The emission <strong>in</strong>tensities <strong>of</strong> different b<strong>and</strong>s<br />
were <strong>in</strong>terpolated between measured po<strong>in</strong>ts <strong>and</strong> extrapolated<br />
to the zero po<strong>in</strong>t l<strong>in</strong>early. These dependencies<br />
allowed to obta<strong>in</strong> the equivalence ratio <strong>of</strong><br />
the decane mixture. Values <strong>of</strong> the equivalence ratio<br />
determ<strong>in</strong>ed from measurements fulfilled on different<br />
wavelengths <strong>and</strong> <strong>in</strong> different pressures are<br />
represented <strong>in</strong> the table 1. The concentration <strong>of</strong> ndecane<br />
obta<strong>in</strong>ed by this method amounted to 0.12<br />
dur<strong>in</strong>g 3 days <strong>of</strong> mix<strong>in</strong>g. That is necessary 30 days<br />
to obta<strong>in</strong> the <strong>stoichiometric</strong> mixture <strong>of</strong> n-decane<br />
with oxygen. Thus, there is no sense to prepare<br />
<strong>stoichiometric</strong> mixture <strong>of</strong> n-decan with oxygen <strong>in</strong><br />
room temperature ow<strong>in</strong>g to very long preparation<br />
time, <strong>and</strong> so we <strong>in</strong>vestigated <strong>oxidation</strong> process <strong>in</strong><br />
the mixture with 0.12±0.01 <strong>stoichiometric</strong> ratio.<br />
In the mixture was registered energy contribution<br />
<strong>and</strong> CO(B 1 Σ → A 1 Π) emission <strong>in</strong>tensity. The energy<br />
contribution <strong>in</strong> dependence on the pressure is<br />
represented <strong>in</strong> the figure 9 both for decane mixture<br />
<strong>and</strong> for butane mixtures. It is necessary to note<br />
that difference between energy <strong>in</strong>puts <strong>in</strong> <strong>in</strong>itial <strong>and</strong><br />
<strong>in</strong> processed mixtures is negligibly small ow<strong>in</strong>g to<br />
the oxygen is the ma<strong>in</strong> constituent <strong>of</strong> these mixtures.<br />
It is clearly seen that energy contribution <strong>in</strong><br />
different mixture does not differ with<strong>in</strong> the range<br />
<strong>of</strong> experimental data scatter<strong>in</strong>g. Thus, excitation<br />
<strong>of</strong> a gas occurred with the same <strong>in</strong>tensity for all<br />
mixtures.<br />
In the figure 10 times <strong>of</strong> full <strong>oxidation</strong> obta<strong>in</strong>ed<br />
by emission <strong>in</strong>tensities <strong>of</strong> CO(B 1 Σ → A 1 Π) b<strong>and</strong>s<br />
for butane-oxygen mixtures <strong>and</strong> for the decaneoxygen<br />
mixture are represented. It is clearly seen<br />
Table 1: Equivalence ratio.<br />
Pressure, torr 1.51 5.29 9.83<br />
λ = 290 nm 0.096 0.116 0.08<br />
λ = 306 nm 0.205 0.114 0.135<br />
λ = 330 nm 0.12 0.129 0.113<br />
Figure 9: Energy <strong>in</strong>put for butane <strong>and</strong> decane mixtures<br />
with O2. Equivalence ratio <strong>of</strong> butane mixture<br />
is 0.1 <strong>and</strong> one <strong>of</strong> the decane mixture is 0.12±0.01<br />
Figure 10: Time <strong>in</strong>tervals between discharge beg<strong>in</strong>n<strong>in</strong>g<br />
<strong>and</strong> CO(B 1 Σ → A 1 Π) emission maximum —<br />
a) <strong>and</strong> <strong>in</strong>stants <strong>of</strong> full <strong>oxidation</strong> — b)<br />
that time <strong>of</strong> full <strong>oxidation</strong> <strong>of</strong> n-decane is approximately<br />
equal to the time <strong>of</strong> full <strong>oxidation</strong> <strong>of</strong> butane<br />
<strong>in</strong> mixture with 0.1 equivalence ratio. Thus, the<br />
conclusions, which we have made for mixtures <strong>of</strong><br />
alkanes C2-C6 early, can be extended on alkanes<br />
that are more heavy.<br />
Acknowledgments<br />
This work was partially supported Grants by<br />
PR0-1349-MO-02 EOARD/CRDF; Grant 02-3.2-<br />
97 by M<strong>in</strong>istry for Higher Education <strong>of</strong> Russian<br />
Federation; grant 02-03-33376 <strong>of</strong> Russian Foundation<br />
for Basic Research; Project 1440 by ISTC;<br />
Award MO-011-0 <strong>of</strong> the CRDF. Work <strong>of</strong> N.B.Anik<strong>in</strong><br />
was partially supported <strong>in</strong> accordance with his<br />
grant Y1-C-11-09; work <strong>of</strong> S.M.Starikovskaia was<br />
partially supported by grant <strong>of</strong> President RF for<br />
young DrSc.