Experimental and numerical detonation cell in H2-N2O-Ar mixtures
Experimental and numerical detonation cell in H2-N2O-Ar mixtures
Experimental and numerical detonation cell in H2-N2O-Ar mixtures

Create successful ePaper yourself
Turn your PDF publications into a flip-book with our unique Google optimized e-Paper software.
<strong>Experimental</strong> <strong>and</strong> <strong>numerical</strong> <strong>detonation</strong> <strong>cell</strong> <strong>in</strong><br />
<strong>H2</strong>-<strong>N2O</strong>-<strong>Ar</strong> <strong>mixtures</strong><br />
R. Mével 1,2,∗ ,D.Davidenko 1 ,F.Lafosse 1 , G. Dupré 1,2 <strong>and</strong> C.-E. Paillard 1,2<br />
1 Institut de Combustion, Aérothermique, Réactivité et Environnement<br />
2 University of Orléans<br />
Abstract<br />
The <strong>in</strong>vestigation of <strong>detonation</strong> <strong>in</strong> hydrogen-nitrous oxide <strong>mixtures</strong> is related to several important <strong>in</strong>dustrial<br />
safety issues <strong>in</strong>clud<strong>in</strong>g nuclear waste storage <strong>and</strong> semi-conductor production. Because of a limited number of<br />
<strong>detonation</strong> <strong>cell</strong> size data available <strong>in</strong> the literature, the present study aims at provid<strong>in</strong>g additional experimental<br />
data <strong>and</strong> estimat<strong>in</strong>g several methods to predict <strong>detonation</strong> <strong>cell</strong> size. Detonation <strong>cell</strong> size is measured at<br />
different argon dilution <strong>and</strong> <strong>in</strong>itial pressures, for <strong>mixtures</strong> with equivalence ratios from 0.3 to 2.5. It is shown<br />
that even at low <strong>in</strong>itial pressure, <strong>H2</strong>-<strong>N2O</strong>-<strong>Ar</strong> <strong>mixtures</strong> are very sensitive to <strong>detonation</strong>. Us<strong>in</strong>g a detailed<br />
chemical k<strong>in</strong>etic model, the semi-empirical correlation by Ng has been shown to give accurate prediction of<br />
<strong>cell</strong> size. After a specific reduction of the detailed scheme <strong>and</strong> the adjustment of the <strong>detonation</strong> velocity to<br />
match the experimental one, a 2-D Euler simulation has been shown a capability to provide reliable <strong>cell</strong> size<br />
data for stoichiometric <strong>mixtures</strong>.<br />
Introduction<br />
Detonation <strong>in</strong> hydrogen-nitrous oxide <strong>mixtures</strong> is<br />
related to several important safety issues. The first<br />
one is related to some nuclear wastes storage at<br />
Anford site s<strong>in</strong>ce these wastes periodically release a<br />
gaseous mixture ma<strong>in</strong>ly composed of hydrogen <strong>and</strong><br />
nitrous oxide [1–5]. The second one is the safety<br />
of semi-conductor manufactur<strong>in</strong>g processes s<strong>in</strong>ce<br />
hydrogen-nitrous oxide k<strong>in</strong>etics play an important<br />
role <strong>in</strong> the oxidation of silane by nitrous oxide [6].<br />
Among explosion hazards, the <strong>detonation</strong> is the<br />
most dangerous one s<strong>in</strong>ce it can result <strong>in</strong> large scale<br />
destructions. Direct <strong>in</strong>itiation of <strong>detonation</strong> is rarely<br />
taken <strong>in</strong>to account <strong>in</strong> risk assessment because the<br />
required energy is high compared to that <strong>in</strong>duc<strong>in</strong>g a<br />
deflagration. Nevertheless, it has been shown that<br />
conf<strong>in</strong>ement conditions can facilitate the deflagration<br />
to <strong>detonation</strong> transition (DDT) [7].<br />
A fundamental parameter for risk assement is the<br />
<strong>detonation</strong> <strong>cell</strong> size. Effects of the equivalence ratio,<br />
<strong>in</strong>itial pressure <strong>and</strong> dilution on the <strong>detonation</strong> <strong>cell</strong><br />
size of <strong>H2</strong>-<strong>N2O</strong>(-diluent) <strong>mixtures</strong> have been studied<br />
[8–10] but the available data are quite limited<br />
if compared to more common <strong>mixtures</strong> such as<br />
hydrocarbon-air or hydrogen-air <strong>mixtures</strong>.<br />
Specific Objectives<br />
The objective of the present study is, first, to provide<br />
additional experimental data on the <strong>detonation</strong> <strong>cell</strong><br />
∗ Correspond<strong>in</strong>g author: mevel@cnrs-orleans.fr<br />
Proceed<strong>in</strong>gs of the European Combustion Meet<strong>in</strong>g 2009<br />
1<br />
size for hydrogen-nitrous oxide <strong>mixtures</strong> <strong>and</strong>, second,<br />
to evaluate the accuracy of <strong>cell</strong> size prediction us<strong>in</strong>g<br />
both a semi-empirical correlation (based on chemical<br />
k<strong>in</strong>etics) <strong>and</strong> 2-D <strong>numerical</strong> simulations.<br />
Materials <strong>and</strong> Methods<br />
Materials<br />
Hydrogen-nitrous oxide-argon <strong>mixtures</strong> are prepared<br />
from high purity grade gas supplied by Air Liquide.<br />
Each gas is <strong>in</strong>troduced <strong>in</strong> a 10 L Pyrex tank us<strong>in</strong>g the<br />
partial pressure method <strong>and</strong> mixed by a magnetic<br />
stirrer for at least half an hour prior to experiments.<br />
The <strong>in</strong>itial conditions are varied with<strong>in</strong> the follow<strong>in</strong>g<br />
ranges: equivalence ratio (Φ) between 0.3 <strong>and</strong> 2.5,<br />
dilution from 20 to 60 mol% <strong>Ar</strong>, <strong>and</strong> <strong>in</strong>itial pressure<br />
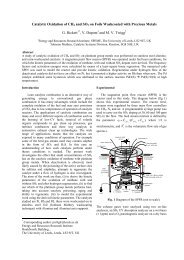
between 7 <strong>and</strong> 35 kPa. Detonations are <strong>in</strong>itiated <strong>in</strong><br />
a shock tube beh<strong>in</strong>d an <strong>in</strong>cident shock wave. The<br />
shock tube is made of sta<strong>in</strong>less steel. The driver<br />
section is 0.9 m long <strong>and</strong> has an <strong>in</strong>ner diameter of<br />
128 mm. The driven section is 4.6 m long <strong>and</strong> has<br />
an <strong>in</strong>ner diameter of 78 mm. The two parts of the<br />
tube are l<strong>in</strong>ked to vacuum pumps <strong>and</strong> separated by a<br />
double membrane system which allows a good control<br />
of the driver section pressure, P4. Four pressure<br />
transducers are mounted flush to the driven section<br />
<strong>in</strong>ner wall <strong>and</strong> allow to measure the shock velocity<br />
with an accuracy of 1%. The measurement of the<br />
wave velocity permits to calculate the temperature<br />
<strong>and</strong> pressure conditions beh<strong>in</strong>d the shock wave. The<br />
classical soot record method is used to evaluate the<br />
sensitivity to <strong>detonation</strong> of different <strong>mixtures</strong>. An
example of soot record is shown <strong>in</strong> Figure 1.<br />
Soot records are digitised <strong>and</strong> analysed us<strong>in</strong>g<br />
the Visilog software. The <strong>cell</strong> size, λ, reported<br />
<strong>in</strong> the present study corresponds to the mean of<br />
the largest <strong>and</strong> smallest <strong>cell</strong>s measured on a given foil.<br />
Figure 1: <strong>Experimental</strong> soot record of <strong>detonation</strong> <strong>cell</strong>s <strong>in</strong><br />
a<strong>H2</strong>-<strong>N2O</strong>-<strong>Ar</strong> mixture. Initial conditions: Φ = 1; X<strong>Ar</strong> =<br />
0.2; P1 =10kPa;T1 = 295 K.<br />
Methods<br />
The presently used chemical k<strong>in</strong>etic model, constituted<br />
of 203 reactions <strong>and</strong> 32 species, was previously<br />
described <strong>and</strong> validated aga<strong>in</strong>st numerous experimental<br />
shock-tube, flow reactor <strong>and</strong> flame speed<br />
data [11, 12]. S<strong>in</strong>ce it is too large to be directly<br />
applied to multidimensional <strong>detonation</strong> simulations,<br />
it has to be reduced to the m<strong>in</strong>imum number of<br />
reactions describ<strong>in</strong>g the heat release dynamics <strong>in</strong><br />
the <strong>detonation</strong> wave. The reduction was conducted<br />
us<strong>in</strong>g an automatic procedure [13] for the elim<strong>in</strong>ation<br />
of redundant chemical reactions. This procedure is<br />
based on the simulation of an autoignition process <strong>in</strong><br />
a homogeneous adiabatic constant-pressure reactor.<br />
The importance of each reaction is evaluated from<br />
an error criterion based on the follow<strong>in</strong>g macroscopic<br />
characteristics of the oxidation process: ignition<br />
delay time (time <strong>in</strong>terval to the thermicity peak),<br />
maximum thermicity, profiles of temperature <strong>and</strong><br />
mean molar mass. The errors are determ<strong>in</strong>ed with<br />
respect to the same characteristics obta<strong>in</strong>ed with the<br />
detailed k<strong>in</strong>etic model. Reactions are elim<strong>in</strong>ated one<br />
after the other, start<strong>in</strong>g from the least important one<br />
until none of the rema<strong>in</strong><strong>in</strong>g reactions can be deleted<br />
without exceed<strong>in</strong>g the imposed error tolerances,<br />
result<strong>in</strong>g <strong>in</strong> a reduced k<strong>in</strong>etic scheme.<br />
For <strong>cell</strong> size prediction, two methods are used. The<br />
first one corresponds to the classical correlation, λ<br />
=A.Δi, withΔi, the <strong>in</strong>duction distance <strong>and</strong> A, the<br />
ratio of the <strong>cell</strong> size to the <strong>in</strong>duction distance. The<br />
second one is the use of a 2D Euler code to simulate<br />
2<br />
the <strong>detonation</strong> wave propagation.<br />
Instead of us<strong>in</strong>g the A ratio obta<strong>in</strong>ed from previous<br />
experiments, A is calculated us<strong>in</strong>g the Ng’s method,<br />
described <strong>in</strong> details <strong>in</strong> Refs. [14, 15]. Briefly, A is<br />
obta<strong>in</strong>ed from the reduced activation energy, ɛi, as<br />
def<strong>in</strong>ed by Schultz <strong>and</strong> Shepherd [16], a stability<br />
parameter, χ, which corresponds to the ratio of the<br />
<strong>in</strong>duction distance to the reaction distance, <strong>and</strong> fit<br />
coefficients. This method allows the use of detailed<br />
k<strong>in</strong>etic schemes with<strong>in</strong> the ”Shock <strong>and</strong> Detonation<br />
Tool Box” from Caltech to determ<strong>in</strong>e <strong>in</strong>duction<br />
distances.<br />
A high-resolution Euler code for a reactive flow,<br />
based on the shock-captur<strong>in</strong>g, Weighted Essentially<br />
Non-Oscillatory (WENO) scheme of the fifth order<br />
[17], is applied to a 2-D <strong>detonation</strong> simulation.<br />
To avoid restrictions on the time step, the time<br />
<strong>in</strong>tegration is performed with the semi-implicit<br />
additive Runge-Kutta scheme ASIRK2C [18]. The<br />
convective terms are <strong>in</strong>cluded <strong>in</strong> the explicit operator<br />
whereas all source terms are treated implicitly. The<br />
global time step is controlled by impos<strong>in</strong>g a Courant<br />
number equal to 0.7. The code is parallized us<strong>in</strong>g<br />
MPI library.<br />
2D simulations are made on two rectangular doma<strong>in</strong>s<br />
whose dimensions are 150 mm <strong>in</strong> the direction of<br />
the <strong>detonation</strong> propagation <strong>and</strong> 39 mm or 78 mm <strong>in</strong><br />
the transversal direction. The computational mesh<br />
is structured <strong>and</strong> orthogonal. In the longitud<strong>in</strong>al<br />
direction, it consists of 500 po<strong>in</strong>ts uniformly distributed<br />
with a step of 50 μm <strong>and</strong> 500 po<strong>in</strong>ts with<br />
progressively <strong>in</strong>creas<strong>in</strong>g spac<strong>in</strong>g. The <strong>detonation</strong><br />
front is kept with<strong>in</strong> the first mesh portion. In the<br />
transversal direction, the mesh consists of 400 or 800<br />
equally spaced po<strong>in</strong>ts.<br />
To obta<strong>in</strong> a nearly st<strong>and</strong><strong>in</strong>g <strong>detonation</strong> front,<br />
a uniform flow at the Chapman-Jouguet (CJ)<br />
<strong>detonation</strong> velocity is imposed on the <strong>in</strong>let boundary.<br />
CJ conditions are considered on the outlet<br />
boundary. Symmetry or perfectly reflect<strong>in</strong>g conditions<br />
are imposed on the two rema<strong>in</strong><strong>in</strong>g boundaries.<br />
Results <strong>and</strong> Discussion<br />
<strong>Experimental</strong> results<br />
As a first step, the evolution of wave velocity as<br />
a function of the pressure ratio of driver to driven<br />
sections (P4/P1) is measured. This ratio (P4/P1)<br />
is l<strong>in</strong>ked to the shock strength. Stoichiometric<br />
<strong>mixtures</strong>, 50 mol% <strong>Ar</strong> diluted, at <strong>in</strong>itial pressures<br />
of 10 kPa <strong>and</strong> 20 kPa are used. Figure 2 shows the<br />
results obta<strong>in</strong>ed at <strong>in</strong>itial pressure of 10 kPa.<br />
In the left part of the graph, the velocity of the<br />
<strong>in</strong>cident shock <strong>in</strong>creases l<strong>in</strong>early with (P4/P1) ratio.<br />
Then, for a critical ratio around 55, the coupl<strong>in</strong>g<br />
between the shock wave <strong>and</strong> the reaction zone
ecomes effective <strong>in</strong>duc<strong>in</strong>g a large jump <strong>in</strong> the<br />
measured velocity. F<strong>in</strong>ally, as the (P4/P1) ratio<br />
cont<strong>in</strong>ues to <strong>in</strong>crease, the wave velocity tends to<br />
stabilize at the self-susta<strong>in</strong>ed CJ velocity. It can be<br />
noted that the critical pressure ratio is significantly<br />
reduced at higher <strong>in</strong>itial pressure ((P4/P1)≈35 for<br />
P1 = 20 kPa) due to the decrease of the critical<br />
energy for <strong>detonation</strong> onset. Critical conditions<br />
for the <strong>detonation</strong> onset have been estimated at<br />
several <strong>in</strong>itial pressures from the ideal 1-D shock<br />
wave theory, us<strong>in</strong>g the velocity measurements as a<br />
function of the (P4/P1) ratio. For P1 =10kPa,the<br />
critical temperature <strong>and</strong> pressure are 904 K <strong>and</strong> 127<br />
kPa, respectively. For P1 = 20 kPa, the critical temperature<br />
is 750 K <strong>and</strong> the critical pressure is 188 kPa.<br />
Wave velocity (m/s)<br />
2400<br />
2000<br />
1600<br />
1200<br />
800<br />
400<br />
<strong>Experimental</strong> data<br />
CJ velocity<br />
20 40 60 80<br />
P 4/P 1<br />
Figure 2: Wave velocity <strong>in</strong> <strong>H2</strong>-<strong>N2O</strong>-<strong>Ar</strong> mixture as a function<br />
of the (P4/P1) ratio. Initial conditions: Φ = 1; X<strong>Ar</strong><br />
=0.5;P1 =10kPa;T1 = 295 K<br />
λ (mm)<br />
10<br />
80<br />
70<br />
60<br />
50<br />
40<br />
30<br />
20<br />
X <strong>Ar</strong> = 0.2<br />
X <strong>Ar</strong> = 0.4<br />
X <strong>Ar</strong> = 0.6<br />
1<br />
Equivalence ratio<br />
Figure 3: Detonation <strong>cell</strong> size <strong>in</strong> <strong>H2</strong>-<strong>N2O</strong>-<strong>Ar</strong> <strong>mixtures</strong><br />
as a function of equivalence ratio at different dilutions.<br />
Initial conditions: Φ = 0.3-2.5; X<strong>Ar</strong> = 0.2-0.6; P1 =10<br />
kPa; T1 = 295 K<br />
3<br />
λ (mm)<br />
100<br />
10<br />
1<br />
P 1 = 7 kPa<br />
P 1 = 10 kPa<br />
P 1 = 35 kPa<br />
1<br />
Equivalence ratio<br />
Figure 4: Detonation <strong>cell</strong> size <strong>in</strong> <strong>H2</strong>-<strong>N2O</strong>-<strong>Ar</strong> <strong>mixtures</strong><br />
as a function of equivalence ratio at different <strong>in</strong>itial pressures.<br />
Initial conditions: Φ = 0.3-2.5; X<strong>Ar</strong> =0.2;P1 =<br />
7-35 kPa; T1 = 295 K<br />
As a second step, <strong>detonation</strong> <strong>cell</strong> size has been<br />
measured at various equivalence ratios, dilutions<br />
<strong>and</strong> <strong>in</strong>itial pressures. Figure 3 <strong>and</strong> Figure 4 present<br />
the evolution of the <strong>cell</strong> size as a function of the<br />
equivalence ratio at different dilution levels <strong>and</strong><br />
<strong>in</strong>itial pressures, respectively. As it can be seen, the<br />
<strong>cell</strong> size dependence on the equivalence ratio presents<br />
the classical U-shape with a m<strong>in</strong>imum value around<br />
stoichiometry: stoichiometric <strong>H2</strong>-<strong>N2O</strong> <strong>mixtures</strong> are<br />
the most sensitive to <strong>detonation</strong>. It can also be<br />
noted that λ decreases with the decrease of dilution<br />
<strong>and</strong> with the <strong>in</strong>crease of <strong>in</strong>itial pressure, both be<strong>in</strong>g<br />
typical features.<br />
Numerical results<br />
The reduced k<strong>in</strong>etic model presented here has been<br />
obta<strong>in</strong>ed for a stoichiometric mixture with the follow<strong>in</strong>g<br />
molar composition: X<strong>H2</strong> =0.3,X<strong>N2O</strong> =0.3,X<strong>Ar</strong><br />
= 0.4. The same mixture is considered for the 2D<br />
simulations of the <strong>detonation</strong> wave.<br />
The reduction is performed on a 1-D parametric grid<br />
def<strong>in</strong>ed <strong>in</strong> terms of post-shock conditions (P <strong>and</strong> T) <strong>in</strong><br />
the range of shock velocity from 0.8 DCJ to 1.6 DCJ,<br />
DCJ be<strong>in</strong>g the CJ <strong>detonation</strong> velocity. The follow<strong>in</strong>g<br />
7 reactions are identified as important:<br />
O + <strong>H2</strong> = H + OH (1)<br />
OH + <strong>H2</strong> = <strong>H2</strong>O + H (2)<br />
OH + H + M = <strong>H2</strong>O + M (3)<br />
<strong>N2O</strong>(+M) =N2 + O(+M) (4)<br />
<strong>N2O</strong> + H = N2 + OH (5)
NH + NO = <strong>N2O</strong> + H (6)<br />
NH + NH = N2 + H + H (7)<br />
By analyz<strong>in</strong>g the reduced model, it is found that the<br />
role of the reverse reaction R6 <strong>and</strong> forward reaction<br />
R7 consists to limit the consumption of H radical by<br />
the forward reaction R5. Further reduction could<br />
be achieved by elim<strong>in</strong>at<strong>in</strong>g the two last reactions<br />
<strong>and</strong> reduc<strong>in</strong>g the rate constant of reaction R5. The<br />
reduction of the preexponenial factor of reaction<br />
R5 by 45 % allows to compensate the effect of<br />
reactions R6 <strong>and</strong> R7 <strong>and</strong> to delete 2 species, NH <strong>and</strong><br />
NO, among the 10 rema<strong>in</strong><strong>in</strong>g species. F<strong>in</strong>ally, the<br />
partially globalized version of the reduced model,<br />
noted as globalized model, <strong>in</strong>cludes reactions R1-R5.<br />
More details on the reduction procedure can be<br />
found <strong>in</strong> [19]<br />
Several tests have been performed to validate the<br />
reduced k<strong>in</strong>etic schemes. Their applicability to<br />
<strong>detonation</strong> simulations is tested us<strong>in</strong>g the constantpressure<br />
reactor model. The <strong>in</strong>itial conditions are<br />
determ<strong>in</strong>ed beh<strong>in</strong>d a shock wave propagat<strong>in</strong>g <strong>in</strong> a<br />
fresh mixture at P1 = 10 kPa <strong>and</strong> T1 = 297 K.<br />
The shock velocity, D, is varied with<strong>in</strong> the range<br />
(0.8-1.2) DCJ, whereDCJ = 1897 m/s, yield<strong>in</strong>g the<br />
follow<strong>in</strong>g variations of the post-shock conditions: P2<br />
= 241-546 kPa <strong>and</strong> T2 = 1316-2465 K. Figure 5<br />
presents a comparison of the maximum thermicity<br />
<strong>and</strong> of time to maximum thermicity, predicted with<br />
the three k<strong>in</strong>etic schemes: detailed, reduced R1-R7,<br />
globalized R1-R5. From Figure 5, one can see that<br />
the results given by the three reaction mechanisms<br />
are <strong>in</strong> good agreement. The predictions provided by<br />
the last one are as accurate as those given by the<br />
reduced scheme R1-R7.<br />
Maximum thermicity (s -1 )<br />
1x10 7<br />
1x10 6<br />
Time to maximum<br />
Thermicity<br />
Maximum<br />
Thermicity<br />
Detailed scheme<br />
Reduced scheme<br />
Globalized scheme<br />
0.8 0.9 1 1.1 1.2<br />
D/DCJ<br />
Figure 5: Maximum thermicity <strong>and</strong> time to maximum<br />
thermicity <strong>in</strong> a <strong>H2</strong>-<strong>N2O</strong>-<strong>Ar</strong> mixture as a function of<br />
D/DCJ: comparison between the detailed, the reduced<br />
<strong>and</strong> the globalized chemical schemes. Initial conditions:<br />
Φ=1;X<strong>Ar</strong> =0.4;P1 = 10.1 kPa; T1 = 297 K.<br />
1x10 -4<br />
1x10 -5<br />
1x10 -6<br />
1x10 -7<br />
Time to maximum thermicity (s)<br />
4<br />
Other tests were conducted us<strong>in</strong>g the ZND model.<br />
Figure 6 shows spatial profiles of temperature <strong>and</strong><br />
thermicity computed with the detailed <strong>and</strong> globalized<br />
k<strong>in</strong>etic schemes for D = DCJ. The latter gives<br />
a slightly higher <strong>detonation</strong> velocity DCJ = 1908<br />
m/s. This example proves that the reduced scheme<br />
provides correct profiles of macroscopic quantities<br />
dur<strong>in</strong>g the entire oxidation process. 2D <strong>detonation</strong><br />
simulations discussed below have been conducted<br />
with the globalized k<strong>in</strong>etic scheme.<br />
Temperature (K)<br />
3200<br />
2800<br />
2400<br />
2000<br />
1600<br />
Detailled scheme<br />
Globalized scheme<br />
Temperature<br />
0.0004 0.0008 0.0012<br />
Distance (m)<br />
Thermicity<br />
1E+006<br />
8E+005<br />
4E+005<br />
0E+000<br />
Figure 6: Temperature <strong>and</strong> thermicity profiles <strong>in</strong> a <strong>H2</strong>-<br />
<strong>N2O</strong>-<strong>Ar</strong> mixture: comparison between the detailed <strong>and</strong><br />
the globalized chemical scheme. Initial conditions: Φ =<br />
1; X<strong>Ar</strong> =0.4;P1 = 10.1 kPa; T1 = 297 K.<br />
For the <strong>cell</strong> size prediction, first, the correlation of Ng<br />
has been tested aga<strong>in</strong>st the experimental data from<br />
the present study. Figure 7 shows an example of the<br />
results obta<strong>in</strong>ed.<br />
λ (mm)<br />
100<br />
10<br />
0.2<br />
T 1 = 295 K<br />
X <strong>Ar</strong> = 0.2<br />
0.3<br />
P 1 = 7 kPa<br />
P 1 = 10 kPa<br />
P 1 = 35 kPa<br />
0.4<br />
0.5<br />
0.6 0.7 0.8 0.9<br />
Equivalence ratio<br />
1<br />
Thermicity (s-1)<br />
2 3<br />
Figure 7: Comparison between Ng’s <strong>cell</strong> size correlation<br />
<strong>and</strong> the experimental <strong>detonation</strong> <strong>cell</strong> size of <strong>H2</strong>-<strong>N2O</strong>-<strong>Ar</strong><br />
mixture. Initial conditions: Φ = 0.3-2.5; X<strong>Ar</strong> =0.2;P1<br />
=7-35kPa;T1 = 297 K.<br />
It can be seen that the correlation allows a good<br />
quantitative prediction of the <strong>cell</strong> size with a mean<br />
error around 40 %. The evolution of <strong>cell</strong> size as
a function of the equivalence ratio, <strong>in</strong>itial pressure<br />
<strong>and</strong> dilution is well reproduced by the correlation.<br />
As important parameters of the correlation (the<br />
<strong>in</strong>duction distance <strong>and</strong> the reaction zone length)<br />
are derived from the detailed scheme, it can be<br />
concluded that the accuracy of the predicted <strong>cell</strong><br />
size is directly related to the quality of the k<strong>in</strong>etic<br />
scheme. Thus, the correlation of Ng can be used as a<br />
reliable tool as long as a carefully validated detailed<br />
chemical model is used.<br />
Further, 2-D <strong>numerical</strong> simulations have been performed.<br />
Figure 8 <strong>and</strong> Figure 9 show a Schlieren picture<br />
of the <strong>detonation</strong> front <strong>and</strong> a <strong>numerical</strong> soot<br />
record, respectively.<br />
Figure 8: Numerical Schlieren picture of a simulated <strong>detonation</strong><br />
<strong>in</strong> a <strong>H2</strong>-<strong>N2O</strong>-<strong>Ar</strong> mixture. Initial conditions: Φ =<br />
1; X<strong>Ar</strong> =0.4;P1 = 10.1 kPa; T1 = 297 K.<br />
The <strong>numerical</strong> soot foils are used to estimate the <strong>cell</strong><br />
size. The mean <strong>cell</strong> size <strong>in</strong> the simulations presented<br />
<strong>in</strong> Figure 8 <strong>and</strong> Figure 9 is 9 mm, that is almost<br />
two times smaller than the experimental one. As the<br />
velocity of the simulated <strong>detonation</strong> is 50 m/s higher<br />
than <strong>in</strong> the experiment, it was decided to adjust the<br />
propagation velocity <strong>in</strong> the simulation. The desired<br />
effect can be achieved by modify<strong>in</strong>g the enthalpy<br />
of formation of <strong>H2</strong>O, the most important oxidation<br />
product. Based on computational tests, the modified<br />
enthalpy of formation must be -221.1 kJ/mol <strong>in</strong>stead<br />
of the st<strong>and</strong>ard value of -241.8 kJ/mol. Additionnal<br />
simulations have been performed <strong>and</strong> a mean <strong>cell</strong><br />
size of 18 mm was derived, perfectly match<strong>in</strong>g the<br />
experimental data. Figure 10 sums up the results<br />
of the different <strong>numerical</strong> simulations <strong>and</strong> compares<br />
them with the experimental results <strong>and</strong> Ng’s correlation.<br />
5<br />
Figure 9: Example of <strong>numerical</strong> soot foil obta<strong>in</strong>ed <strong>in</strong> a<br />
<strong>H2</strong>-<strong>N2O</strong>-<strong>Ar</strong> mixture. Initial conditions: Φ = 1; X<strong>Ar</strong> =<br />
0.4; P1 = 10.1 kPa; T1 = 297 K.<br />
λ (mm)<br />
100<br />
10<br />
<strong>Experimental</strong> data<br />
λnum-adjusted<br />
λnum<br />
λNg<br />
1<br />
Equivalence ratio<br />
Figure 10: Dependence of the <strong>cell</strong> size on the equivalence<br />
ratio <strong>in</strong> <strong>H2</strong>-<strong>N2O</strong>-<strong>Ar</strong> <strong>mixtures</strong>: comparison between experimental<br />
data <strong>and</strong> different predictions. Initial conditions:<br />
Φ = 0.3-2.5; X<strong>Ar</strong> =0.4;P1 =10kPa;T1 = 295 K.<br />
Theoretically, the most reliable method for <strong>cell</strong> size<br />
prediction would consist <strong>in</strong> deriv<strong>in</strong>g the <strong>detonation</strong><br />
<strong>cell</strong> size from <strong>numerical</strong> simulation. In practice, such<br />
simulations are very costly <strong>and</strong> require a drastic<br />
reduction of the chemical k<strong>in</strong>etics so that it is often<br />
taken <strong>in</strong>to account as a s<strong>in</strong>gle irreversible step.<br />
In <strong>detonation</strong> waves, <strong>in</strong>stabilities result from the<br />
coupl<strong>in</strong>g between chemistry <strong>and</strong> gasdynamics. Consequently,<br />
it is not surpris<strong>in</strong>g that the use of a s<strong>in</strong>gle<br />
reaction results <strong>in</strong> poor <strong>cell</strong> size prediction. In the<br />
present study, although the detailed scheme has been<br />
strongly reduced, the chemical mechanism consists<br />
of 5 reversible reactions. The <strong>cell</strong> size predicted<br />
us<strong>in</strong>g this approach is with<strong>in</strong> the experimental range<br />
of measurement. However, the obta<strong>in</strong>ed value is
almost two times smaller than the experimental<br />
one. This difference can be expla<strong>in</strong>ed by the high<br />
propagation velocity of the simulated <strong>detonation</strong>.<br />
The <strong>detonation</strong> wave never reaches the theoretical<br />
CJ velocity, even after several meters of propagation,<br />
<strong>and</strong> keeps a speed excess of 10 m/s compared to CJ<br />
velocity. <strong>Experimental</strong>ly, self-susta<strong>in</strong>ed <strong>detonation</strong><br />
waves exhibit a speed deficit rang<strong>in</strong>g between 2<br />
% <strong>and</strong> 10 % of the CJ velocity accord<strong>in</strong>g to their<br />
stability level. In case of a <strong>detonation</strong> onset, one can<br />
observe very small <strong>detonation</strong> <strong>cell</strong>s which <strong>in</strong>crease <strong>in</strong><br />
size with distance, s<strong>in</strong>ce the overdriven <strong>detonation</strong><br />
is weakened by rarefaction waves. Consequently,<br />
the <strong>cell</strong> size is strongly related to the propagation<br />
velocity of the <strong>detonation</strong>, so that the faster simulated<br />
<strong>detonation</strong> exhibits smaller <strong>cell</strong>s than that<br />
experimentally observed. In order to obta<strong>in</strong> a more<br />
reliable <strong>cell</strong> size data from the 2-D simulations,<br />
the heat reaction can be decreased to simulate<br />
energy <strong>and</strong> momentum losses responsible for the<br />
velocity deficit observed <strong>in</strong> experiments. This later<br />
approach provides a good estimation of the measured<br />
<strong>cell</strong> size, which seems to validate the present analysis.<br />
Conclusions<br />
Detonation <strong>cell</strong> size of <strong>H2</strong>-<strong>N2O</strong>-<strong>Ar</strong> <strong>mixtures</strong> has<br />
been measured over a wide range of equivalence<br />
ratio, <strong>in</strong>itial pressure <strong>and</strong> dilution: it exhibits typical<br />
behaviour.<br />
Us<strong>in</strong>g a detailed k<strong>in</strong>etic model, the semi-empirical<br />
correlation of Ng has been tested with respect<br />
to available data <strong>and</strong> showed good results. After<br />
a specific reduction of the detailed scheme, <strong>cell</strong><br />
size prediction has also been performed from 2-D<br />
Euler simulations. It has been demonstrated that<br />
a good agreement with experimental data can be<br />
achieved by adjust<strong>in</strong>g the propagation velocity of the<br />
simulated <strong>detonation</strong> with the experimental one.<br />
Efforts will be carried on, us<strong>in</strong>g this approach<br />
<strong>and</strong> specific reduced chemical schemes, <strong>in</strong> order to<br />
check if the evolution of <strong>cell</strong> size as a function of<br />
equivalence ratio can be accurately described.<br />
Acknowledgements<br />
This work was partly supported by a grant<br />
from the French ”M<strong>in</strong>istère de l’ Éducation et de<br />
l’Enseignement supérieur”.<br />
References<br />
[1] MacFarlane D., Bott T., Brown L., Stack D.,<br />
K<strong>in</strong>d<strong>in</strong>ger J., Deremer R., Medhekar S. <strong>and</strong><br />
Miskschl T., <strong>in</strong> Proceed<strong>in</strong>gs of the PSAM-II<br />
Conference, 101 Risk Assessment of Nuclear<br />
Waste Storage <strong>and</strong> Process<strong>in</strong>g, (1994), pp. 1–6.<br />
6<br />
[2] Roblyer S., F<strong>in</strong>frock S. <strong>and</strong> Powell W., <strong>in</strong> Proceed<strong>in</strong>gs<br />
of the International Conference: Mathematics<br />
<strong>and</strong> Computations, Reactor Physics,<br />
<strong>and</strong> Environmental Analyses, (1995), pp. 225–<br />
234.<br />
[3] Titzler P., Legare D. <strong>and</strong> Barrus H., Trans. Am.<br />
Nucl. Soc., 69 (1993) 484.<br />
[4] Fox G. <strong>and</strong> Stepnewski D., Trans. Am. Nucl.<br />
Soc., 70 (1994) 85–86.<br />
[5] Bryan S., K<strong>in</strong>g C. <strong>and</strong> Pederson L., Trans. Am.<br />
Nucl. Soc., 81 (1999) 97–99.<br />
[6] Mick H. <strong>and</strong> Roth P., J. phys. chem., 98 (1994)<br />
5310–5313.<br />
[7] Dorofeev S., Sidorov V. <strong>and</strong> Dvo<strong>in</strong>ishnikov A.,<br />
Combust. Flame, 104 (1996) 95–110.<br />
[8] Akbar R., Kaneshige M., Schultz E. <strong>and</strong> Shepherd<br />
J., Tech. Rep. FM-97-3, Explosion Dynamics<br />
Laboratory, California Institute of Technology<br />
(1997).<br />
[9] Kaneshige M., Schultz E., Pfahl U., Shepherd<br />
J. <strong>and</strong> Akbar R., <strong>in</strong> Proceed<strong>in</strong>gs of the 22 nd International<br />
Symposium on Shock Waves, vol. 1,<br />
(1994), pp. 251–256.<br />
[10] Pfahl U., Schultz E. <strong>and</strong> Shepherd J., Tech. Rep.<br />
FM-98-5, Graduate Aeronautical Laboratories,<br />
California Institute of Technology (1998).<br />
[11] Mével R., Javoy S., Lafosse F., Chaumeix N.,<br />
Dupré G. <strong>and</strong> Paillard C.E., Proc. Combust.<br />
Inst., 32 (2009).<br />
[12] Javoy S., Mével R. <strong>and</strong> Paillard C.E., Int. j.<br />
chem. k<strong>in</strong>et., (In press).<br />
[13] Davidenko D., Ph.D. thesis, Université<br />
d’Orléans (2005).<br />
[14] Ng H., Ph.D. thesis, McGill University (2005).<br />
[15] Ng H., Ju Y. <strong>and</strong> Lee J., Int. j. hydrogen energy,<br />
32 (2007) 93–99.<br />
[16] Schultz E. <strong>and</strong> Shepherd J., Tech. Rep. FM-99-5,<br />
GALCIT (2000).<br />
[17] Jiang G.S. <strong>and</strong> Shu C.W., J. comput. phys., 126<br />
(1996) 202–228.<br />
[18] Zhong X., J. comput. phys., 128 (1996) 19–31.<br />
[19] Davidenko D., Mével R. <strong>and</strong> Dupré G., <strong>in</strong> Proceed<strong>in</strong>gs<br />
of the Fourth European Combustion<br />
Meet<strong>in</strong>g, (2009), vol. 4.