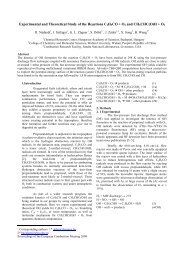
Experimental and numerical detonation cell in H2-N2O-Ar mixtures
Experimental and numerical detonation cell in H2-N2O-Ar mixtures
Experimental and numerical detonation cell in H2-N2O-Ar mixtures

Create successful ePaper yourself
Turn your PDF publications into a flip-book with our unique Google optimized e-Paper software.
NH + NO = <strong>N2O</strong> + H (6)<br />
NH + NH = N2 + H + H (7)<br />
By analyz<strong>in</strong>g the reduced model, it is found that the<br />
role of the reverse reaction R6 <strong>and</strong> forward reaction<br />
R7 consists to limit the consumption of H radical by<br />
the forward reaction R5. Further reduction could<br />
be achieved by elim<strong>in</strong>at<strong>in</strong>g the two last reactions<br />
<strong>and</strong> reduc<strong>in</strong>g the rate constant of reaction R5. The<br />
reduction of the preexponenial factor of reaction<br />
R5 by 45 % allows to compensate the effect of<br />
reactions R6 <strong>and</strong> R7 <strong>and</strong> to delete 2 species, NH <strong>and</strong><br />
NO, among the 10 rema<strong>in</strong><strong>in</strong>g species. F<strong>in</strong>ally, the<br />
partially globalized version of the reduced model,<br />
noted as globalized model, <strong>in</strong>cludes reactions R1-R5.<br />
More details on the reduction procedure can be<br />
found <strong>in</strong> [19]<br />
Several tests have been performed to validate the<br />
reduced k<strong>in</strong>etic schemes. Their applicability to<br />
<strong>detonation</strong> simulations is tested us<strong>in</strong>g the constantpressure<br />
reactor model. The <strong>in</strong>itial conditions are<br />
determ<strong>in</strong>ed beh<strong>in</strong>d a shock wave propagat<strong>in</strong>g <strong>in</strong> a<br />
fresh mixture at P1 = 10 kPa <strong>and</strong> T1 = 297 K.<br />
The shock velocity, D, is varied with<strong>in</strong> the range<br />
(0.8-1.2) DCJ, whereDCJ = 1897 m/s, yield<strong>in</strong>g the<br />
follow<strong>in</strong>g variations of the post-shock conditions: P2<br />
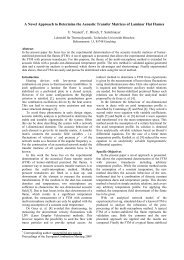
= 241-546 kPa <strong>and</strong> T2 = 1316-2465 K. Figure 5<br />
presents a comparison of the maximum thermicity<br />
<strong>and</strong> of time to maximum thermicity, predicted with<br />
the three k<strong>in</strong>etic schemes: detailed, reduced R1-R7,<br />
globalized R1-R5. From Figure 5, one can see that<br />
the results given by the three reaction mechanisms<br />
are <strong>in</strong> good agreement. The predictions provided by<br />
the last one are as accurate as those given by the<br />
reduced scheme R1-R7.<br />
Maximum thermicity (s -1 )<br />
1x10 7<br />
1x10 6<br />
Time to maximum<br />
Thermicity<br />
Maximum<br />
Thermicity<br />
Detailed scheme<br />
Reduced scheme<br />
Globalized scheme<br />
0.8 0.9 1 1.1 1.2<br />
D/DCJ<br />
Figure 5: Maximum thermicity <strong>and</strong> time to maximum<br />
thermicity <strong>in</strong> a <strong>H2</strong>-<strong>N2O</strong>-<strong>Ar</strong> mixture as a function of<br />
D/DCJ: comparison between the detailed, the reduced<br />
<strong>and</strong> the globalized chemical schemes. Initial conditions:<br />
Φ=1;X<strong>Ar</strong> =0.4;P1 = 10.1 kPa; T1 = 297 K.<br />
1x10 -4<br />
1x10 -5<br />
1x10 -6<br />
1x10 -7<br />
Time to maximum thermicity (s)<br />
4<br />
Other tests were conducted us<strong>in</strong>g the ZND model.<br />
Figure 6 shows spatial profiles of temperature <strong>and</strong><br />
thermicity computed with the detailed <strong>and</strong> globalized<br />
k<strong>in</strong>etic schemes for D = DCJ. The latter gives<br />
a slightly higher <strong>detonation</strong> velocity DCJ = 1908<br />
m/s. This example proves that the reduced scheme<br />
provides correct profiles of macroscopic quantities<br />
dur<strong>in</strong>g the entire oxidation process. 2D <strong>detonation</strong><br />
simulations discussed below have been conducted<br />
with the globalized k<strong>in</strong>etic scheme.<br />
Temperature (K)<br />
3200<br />
2800<br />
2400<br />
2000<br />
1600<br />
Detailled scheme<br />
Globalized scheme<br />
Temperature<br />
0.0004 0.0008 0.0012<br />
Distance (m)<br />
Thermicity<br />
1E+006<br />
8E+005<br />
4E+005<br />
0E+000<br />
Figure 6: Temperature <strong>and</strong> thermicity profiles <strong>in</strong> a <strong>H2</strong>-<br />
<strong>N2O</strong>-<strong>Ar</strong> mixture: comparison between the detailed <strong>and</strong><br />
the globalized chemical scheme. Initial conditions: Φ =<br />
1; X<strong>Ar</strong> =0.4;P1 = 10.1 kPa; T1 = 297 K.<br />
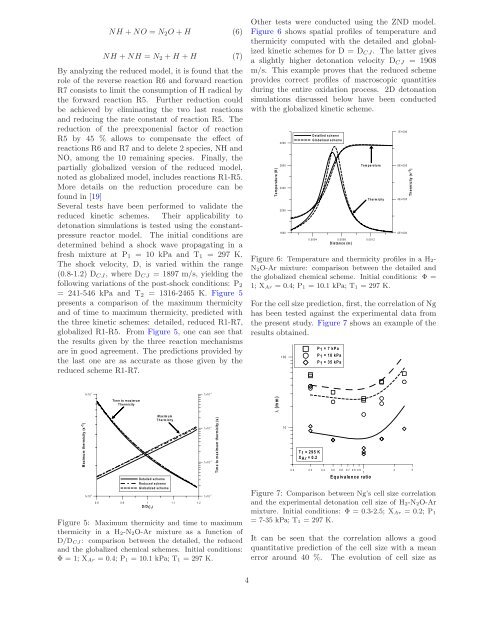
For the <strong>cell</strong> size prediction, first, the correlation of Ng<br />
has been tested aga<strong>in</strong>st the experimental data from<br />
the present study. Figure 7 shows an example of the<br />
results obta<strong>in</strong>ed.<br />
λ (mm)<br />
100<br />
10<br />
0.2<br />
T 1 = 295 K<br />
X <strong>Ar</strong> = 0.2<br />
0.3<br />
P 1 = 7 kPa<br />
P 1 = 10 kPa<br />
P 1 = 35 kPa<br />
0.4<br />
0.5<br />
0.6 0.7 0.8 0.9<br />
Equivalence ratio<br />
1<br />
Thermicity (s-1)<br />
2 3<br />
Figure 7: Comparison between Ng’s <strong>cell</strong> size correlation<br />
<strong>and</strong> the experimental <strong>detonation</strong> <strong>cell</strong> size of <strong>H2</strong>-<strong>N2O</strong>-<strong>Ar</strong><br />
mixture. Initial conditions: Φ = 0.3-2.5; X<strong>Ar</strong> =0.2;P1<br />
=7-35kPa;T1 = 297 K.<br />
It can be seen that the correlation allows a good<br />
quantitative prediction of the <strong>cell</strong> size with a mean<br />
error around 40 %. The evolution of <strong>cell</strong> size as