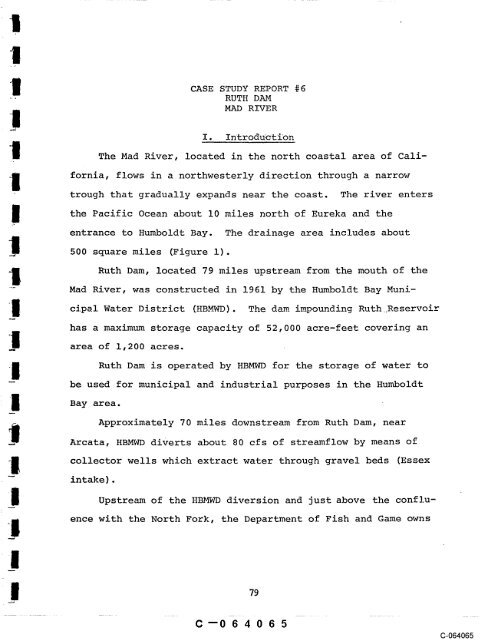
CASE STUDY REPORT #6 RUTH DAM MAD RIVER I. IntroduCtiOn ...
CASE STUDY REPORT #6 RUTH DAM MAD RIVER I. IntroduCtiOn ...
CASE STUDY REPORT #6 RUTH DAM MAD RIVER I. IntroduCtiOn ...

You also want an ePaper? Increase the reach of your titles
YUMPU automatically turns print PDFs into web optimized ePapers that Google loves.
<strong>CASE</strong> <strong>STUDY</strong> <strong>REPORT</strong> <strong>#6</strong><br />
<strong>RUTH</strong> <strong>DAM</strong><br />
<strong>MAD</strong> <strong>RIVER</strong><br />
I. <strong>IntroduCtiOn</strong><br />
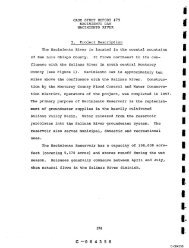
The Mad River, located in the north coastal area of Cali-<br />
fornia, flows in a northwesterly direction through a narrow<br />
trough that gradually expands near the coast. The river enters<br />
the Pacific Ocean about 10 miles north of Eureka and the<br />
entrance to Humboldt Bay. The drainage area includes about<br />
500 square miles (Figure i).<br />
Ruth Dam, located 79 miles upstream from the mouth of the<br />
Mad River, was constructed in 1961 by the Humboldt Bay Muni-<br />
cipal Water District (HBMWD). The dam impounding Ruth..Reservoir<br />
has a maximum storage capacity of 52,000 acre-feet covering an<br />
area of 1,200 acres.<br />
Ruth Dam is operated by HBMWD for the storage of water to<br />
be used for municipal and industrial purposes in the Humboldt<br />
Bay area.<br />
Approximately 70 miles downstream from Ruth Dam, near<br />
Arcata, HBMWD diverts about 80 cfs of streamflow by means of<br />
collector wells which extract water through gravel beds (Essex<br />
intake).<br />
Upstream of the HBMWD diversion and just above the conflu-<br />
ence with the North Fork, the Department of Fish and Game owns<br />
C--064065<br />
(3-064065
Essex Diversion ..<br />
rrler<br />
Scale I :500,000 k Rufh Dam<br />
0 5 I0<br />
Miles<br />
Figure I - Mad River Drainage ’.<br />
Figure 1<br />
LOCATION MAP<br />
~’" ~<br />
Source: California Department of Fish and Game, 1968.<br />
C--064066<br />
8O<br />
C-064066
and operates a king salmon, silver salmon and steelhead<br />
hatchery. The Mad River hatchery began’operating in 1967 and<br />
was intended to supplement natural reproduction of salmon and<br />
steelhead in other coastal streams as well as the Mad River.<br />
Total production for king salmon, silver salmon and steelhead<br />
in 1974 was about 1,900,000 fish, averaging close to one ounce<br />
each. This is a department-owned installation and is not part<br />
of any water projects mitigation feature.<br />
II. P.re.-Project Conditions<br />
The Mad River, like other streams in the north coastal<br />
area, has high precipitation and runoff during the winter and<br />
spring months. A dry season occurs from May to October, thus<br />
natural stream flows ~ur~g ~he s~!m~er and fal! are<br />
low (Figure 2). Occasionally during the dry time of year the<br />
entire flow in sections near the mouth would be under the<br />
gravel, leaving dry stretches of channel (Department of Fish<br />
and Game, 1958).<br />
The most important pre-project Mad River fishery resources<br />
from the standpoint of recreation and economics are the anadro-<br />
mous fish populations. The three major anadromous fish using<br />
the spawning grounds and nursery habitat of the river are the<br />
king salmon, silver salmon and steelhead trout. Other anadro-<br />
mous fish, such as coastal cutthroat and sturgeon, are present<br />
in smaller numbers.<br />
C--064067<br />
(3-064067
POST’PROJECT= OCTOBER 196| --SEPTENBER 1975<br />
GAUGE STATION NO. 11480500<br />
700-- MEAN MONTHLY FLOW SOURCE= USGS SURFACE WATER RECORDS VOL.I ’<br />
600- 1232
Rainbow trout are important resident fish in the upper<br />
reach of the river and in most of the u~per watershed tribu-<br />
taries.<br />
The upstream migration of most of the salmon and steel-<br />
head begins with the onset of heavy fall rains. At the time of<br />
entry into the Mad River estuary, during minimum flow years,<br />
the migration is influenced by a sand bar at the river mouth.<br />
In years when the mouth is not blocked by the sand bar, king<br />
salmon are usually the first species of salmon found migrating<br />
upstream, sometimes as early as August. Often the migration<br />
is blocked farther upstream where the flow of the river is<br />
not sufficient to provide a surface flow (Department of Fish<br />
and Game, 1958).<br />
Silver salmon and steelhead trout do not enter the Mad<br />
River in large numbers until the streamflow rises to higher<br />
levels. The migration and spawning activities usually peak<br />
about a month after those of the king salmon. Steelhead<br />
migration continues through the winter months with most of<br />
the spawning activities taking place in late winter or early<br />
spring.<br />
On the main stem of the Mad River about halfway between<br />
the river mouth and the present Ruth Dam site, a 2-mile<br />
section of river channel is composed of large boulders with<br />
C--064069<br />
(3-064069
a 25-foot fall at the head of the section. This fall, near<br />
the confluence of Wilson Creek, is the upstream limit of<br />
anadromous fish migration (see Figure I). Another similar<br />
barrier is present on the North Fork Mad River as shown on<br />
Figure i. The removal of these natural barriers would approxi-<br />
mately double the spawning habitat for salmon and steelhead.<br />
A partial barrier to fish migration was Sweasey Dam<br />
located 17 miles above the river mouth (see Figure i). The<br />
dam, owned by the City of Eureka, was built in 1938 and demol-<br />
ished in 1970 because of excessive sedimentation in the reser-<br />
voir and non use. Sweasey Dam was equipped with a fish ladder<br />
and an unscreened diversion that continuously conveyed a little<br />
over 5 cfs to the City of Eureka (USGS, 1960).<br />
The effect of Sweasey Dam as a partial barrier to migrating<br />
fish and the efficiency of the fish ladder is not fully known.<br />
The dam has been a complete barrier to fish during flood flows<br />
on the Mad River when the fish ladder has been completely<br />
destroyed or made difficult to ascend. The ladder was destroyed<br />
once in 1955 by flood flows and was not repaired until the<br />
following season.<br />
In 1938 the Department of Fish and Game began counting<br />
upstream migrant fish passing over Sweasey Dam. These counts<br />
are some measure of pre-project fish populations in the Mad<br />
River, but do not provide a direct indication of fish popu-<br />
lations using downstream spawning grounds.<br />
C--064070<br />
C-064070
Pre-project counts taken at the dam showed a significant<br />
decline in the populations of salmon and steelhead using the<br />
spawning grounds between Sweasey Dam and the barrier falls<br />
near Wilson Creek. The king salmon spawning run dwindled<br />
from a peak of 3,139 fish in 1941 to only 19 fish in 1959.<br />
The small number of fish counted in 1959 could be the result<br />
of the flood flows that occurred in 1955 which adversely<br />
affected migration and egg survival. Steelhead trout runs<br />
declined by almost 50 percent from the late 1930’s to the<br />
years immediately prior to the construction of Ruth Dam in<br />
1961.<br />
The mean number of king salmon passing over Sweasey<br />
Dam from 1938 to 1958 was 756 fish annually. The range of<br />
the annual counts was from a high of 3,139 in 1941 to a low<br />
of 19 in 1959. The number of upstream migrants peaks in the<br />
month of November.<br />
The Department of Fish and Game conducted a tagging study<br />
during two spawning seasons to estimate the size of the king<br />
salmon run on the Mad River. From the results of the study, it<br />
was estimated that on the average, about 5,200 king salmon<br />
spawn on the Mad River (Department of Fish and Game, 1958).<br />
The average number of silver salmon spawning above Sweasey<br />
Dam was 322 fish annually from 1938 to 1954. The range during<br />
this period was from 725 in 1939 to a low of 59 in 1954.<br />
Although no tagging studies were conducted, the Department of<br />
Fish and Game estimated that 2,108 silver salmon spawned annually<br />
in the Mad River.<br />
C--064071<br />
(3-064071
pre-project dry year flow (1955) of 5 cfs (Figure 2). An<br />
anticipated minimum flow of 37 cfs was to be provided in the<br />
river below the HBMWD diversion. This would represent a<br />
greater flow than the pre-project minimum when the riffles<br />
would be almost dry at times. The Department of Fish and<br />
Game did not know whether the project flow would keep the<br />
river open to the ocean. It was conceivable that the sand<br />
bar would still obstruct the mouth of the river during years<br />
of light rains in the late fall and early winter months<br />
(Department of Fish and Game, 1957). The Department of Fish<br />
and Game in its 1957 report stated that: "Provisions should<br />
be made so that adequate amounts of water could be released<br />
from Ruth Dam to break the sand bar and keep the mouth open<br />
until natural stream flow is sufficient to do so". It had to<br />
be determined what minimum stream flow would be required and<br />
the optimum timing of the minimum in-stream flow requirements<br />
needed to provide passage at the mouth.<br />
The water district’s plan of operation for Ruth Reservoir<br />
was to impound water during winter rains and release water<br />
during summer and fall months. At the storage phase of the<br />
reservoir, no water would normally be released; stream flow<br />
accretion below the dam site was expected to provide an ade-<br />
quate amount of stream flow for the HBMWD intake 70 miles<br />
downstream. The Department of Fish and Game recommended (1958)<br />
that a minimum stream flow release of 5 cfs be made from Ruth<br />
Dam to prevent stranding immediately below the dam and maintain<br />
a surface flow along the upper river channel.<br />
C--064072<br />
C-064072
When Ruth Dam was constructed in 1961, the Department of<br />
Fish and Game negotiated an agreement with the HBMWD that<br />
established terms for the protection and preservation of fish<br />
and wildlife and partial compensation for the loss of spawning<br />
beds inundated by the reservoir (spawning beds that could be<br />
used after removal of the barrier falls).<br />
To prevent stranding of fish in the river channel below<br />
Ruth Dam during the time that water is to be impounded, a<br />
constant release of 5 cfs from the outlet of the dam was<br />
required in the agreement. This flow would be augmented by<br />
releases at the dam for downstream diversion at Essex and<br />
maintenance of surface flows at the river mouth.<br />
The department further required that waters would not be<br />
stored in Ruth Reservoir when flows to the ocean below the<br />
HBMWD diversion are less than the following:<br />
Month cfs<br />
October 40 cfs<br />
November to June 75 cfs<br />
July 50 cfs<br />
August 40 cfs<br />
September 30 cfs<br />
Records of in-stream flow release negotiation did not<br />
reveal the reasoning behind this particular flow release<br />
recommendation. It must be assumed that these minimum in-<br />
stream flows were to provide anadromous fish with transportation<br />
C--064073<br />
89<br />
(3-064073
flows at the sand bar and along the lower 9-mile reach of the<br />
river. Year-round minimum flows to the estuary section of<br />
the river would provide habitat for estuarine and salt tolerant<br />
species of fish.<br />
A final term of the minimum fish flow agreement signed<br />
by HBMWD required that the agreement be incorporated in the<br />
terms of the State Water Rights Permit that was issued to<br />
the district. .<br />
IV. Post-~oj.e~ct _<br />
The operation of Ruth Dam provided for greater stream<br />
flow in the Mad River in late summer and early fall over pre-<br />
project conditions. The stream flow hydrograph (Figure 2)<br />
during the dry time of year<br />
from Ruth Dam to the HBMWD intake. The stream flow to the<br />
ocean, nine miles below the intake has averaged 60 cfs du~ing<br />
the late summer and early fall (see Figure 3). This flow<br />
regime improved conditions at the river mouth and in the I<br />
estuary.<br />
The Mad River estuary, located about 6 miles below the<br />
HBMWD intake, provides habitat for some of the more important<br />
fishery resources of the Mad River. The in-stream flow require-<br />
ments below the diversion provide for the maintenance of the I<br />
anadromous fish populations and other species of fish using I<br />
the estuarine habitat, i.e., starry flounder, ocean perch,<br />
sculpin. When the flows to the ocean below the intake are<br />
C--064074<br />
i<br />
C-064074
greatly reduced, salt water penetrates farther upstream and<br />
changes the salinity gradients present in the estuary.<br />
The estuary, with its salinity gradient, serves as an<br />
acclimatization and holding area for returning as well as out-<br />
migrating salmon, steelhead and coastal cutthroat. It is<br />
also an important rearing area for seaward migrant juvenile<br />
king salmon and of lesser importance to the juvenile silver<br />
salmon and steelhead. Streamflows into the estuary deliver<br />
nutrients and provide habitat for several other species of<br />
fish.<br />
Estimates of population size for Mad River salmon and<br />
steelhead runs occurring after the operation of Ruth Reservoir<br />
were not found. Estimates of the numbers of fish that could<br />
be accommodated by the available spawning gravels are: 1,000<br />
king salmon, 8,000 silver salmon and 6,000 steelhead (U. S.<br />
Army Corps of Engineers, 1972). These estimates were based on<br />
the assumption that a permanent natural barrier to upstream<br />
migration exists 50 miles above the river mouth (see Figure I).<br />
Salmon and steelhead counts taken at Sweasey Dam showed.<br />
a sharp decline in the spawning runs in the years immediately<br />
before the construction of Ruth Dam. The runs never fully<br />
recovered from this decline until the Department of Fish and<br />
Game began operating the Mad River hatchery in 1967. Fish<br />
artificially spawned at the hatchery supplement the natural<br />
reproduction in the river.<br />
C--064076<br />
C-064076
The lack of recovery after increased flows is not clearly<br />
defined. The presence of Sweasey Dam dhring pre-project con-<br />
ditions undoubtedly had an undesirable effect on anadromous<br />
fish migrations. Although the dam had a fish ladder, it<br />
generally caused stress on upstream migrating fish and limited<br />
their passage during times of exceptionally high flows. Since<br />
removal of the dam in 1970, some observations indicate increased<br />
steelhead runs into the upper reaches of the river and increased<br />
use of king salmon spawning areas in upstream reaches where<br />
they had rarely spawned in previous years. It is unknown what<br />
contribution the Mad River hatchery has made to this increased<br />
range of the upstream migration. The relatively short period<br />
of time since 1970 does not permit a realistic assessment of<br />
recent trends.<br />
Another factor preventing salmon and steelhead from<br />
reaching their full potential is the suspended sediments in<br />
the waters of the river and its tributaries. This condition<br />
results from the combination of an unstable watershed and<br />
logging and road construction. The loss of spawning gravel<br />
due to the sedimentation of fine materials and associated<br />
changes in stream flow regime have eliminated much spawning<br />
habitat. In addition, unpredictable phenomena such asthe<br />
exceptionally severe storm of 1964, when many of the stream<br />
channels were scoured while others had sediment deposition<br />
up to 8 feet in depth, has had effects on the fish habitat.<br />
C--064077<br />
C-064077
Another source of turbidity is the discharge from Ruth<br />
Reservoir at the base of the dam. The outflow is exception-<br />
ally turbid (usually in excess of 15 JTU). The turbidity<br />
from this source is discernible as far as 22 miles downstream<br />
from the dam.<br />
The persistent high turbidity levels in the river below<br />
Ruth Dam have adversely affected aquatic plant production,<br />
degraded the habitat of bottom-dwelling organisms and have<br />
interfered with the feeding activities of fish.<br />
Available USGS records show that the Mad River basin is<br />
one of the highest silt-producing basins in the United States<br />
(U. So Army Corps of Engineers, 1972). The total sediment<br />
yield from the river’s entire drainaqe is about 1,070 acre-<br />
feet per year.<br />
I<br />
V. Conclusion I<br />
The storage of winter runoff by Ruth Dam has provided an<br />
increased instream flow in the Mad River as compared to the<br />
pre-project natural streamflow condition (see Figure 2). The I<br />
increased streamflow assists in the maintenance of a salinity<br />
gradient and associated habitat in the Mad River estuary. I<br />
Apparently the minimum flow of 5 cfs immediately below<br />
Ruth Dam provides a survival habitat for some fish.<br />
Insofar as can be determined, no investigation was made to I<br />
determine an ecologically required minimum flow.<br />
C--064078<br />
C-064078
The winter minimum flows below Humboldt Bay MWD water<br />
intake have created created more stability in the tidal<br />
portion of the river although this general effect was not<br />
quantified. It is assumed that it has improved conditions<br />
for the migrations of anadromous fish during dry years and<br />
during years when rainfall does not start until late autumn.<br />
The project permitted Sweasey Dam to be removed, and this<br />
dam was a serious impediment to salmon and steelhead migrations.<br />
Turbidity increases in the Mad River below Ruth Dam were<br />
not anticipated. Releases from Ruth Reservoir added addi-<br />
tional turbidity to the Mad River and this condition has<br />
adversely modified downstream trout habitat;<br />
I 95<br />
C--064079<br />
C-064079
Personal Communications<br />
BIBLIOGRAPHY<br />
Coots, Millard. 1976. California Department of Fish and Game,<br />
Region i.<br />
La Faunce, Don. 1976. California Department of Fish and Game,<br />
Region i.<br />
References<br />
California. Department of Fish and Game. [n.d.] Counts of<br />
anadromous fishes at Sweasy Dam in Department of Fish and<br />
Game exhibits at State Water Rights Board hearings. 8 pp.<br />
¯ 1958. A preliminary evaluation of the effect of<br />
the Ruth Dam project on fisheries of the Mad River.<br />
Water Projects Report.<br />
¯ 1973. The natural resources of Humboldt Bay.<br />
160 pp.<br />
U. S. Army Corps of Engineers. 1972. Draft environmental<br />
impact statement Butler Valley Dam and Blue Lake project.<br />
170 pp.<br />
U. S. Fish and Wildlife Service. 1960. Natural resources of<br />
northwestern California. A preliminary survey of fish<br />
and wildlife resources. I00 pp.<br />
C--064080<br />
C-064080