Worksheet - Seismograms - Earthguide
Worksheet - Seismograms - Earthguide
Worksheet - Seismograms - Earthguide

You also want an ePaper? Increase the reach of your titles
YUMPU automatically turns print PDFs into web optimized ePapers that Google loves.
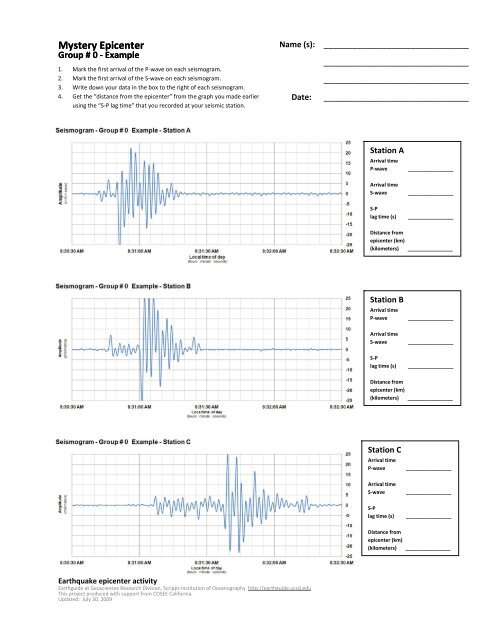
Mystery Epicenter<br />
Group # 0 ‐ Example<br />
1. Mark the first arrival of the P‐wave on each seismogram.<br />
2. Mark the first arrival of the S‐wave on each seismogram.<br />
3. Write down your data in the box to the right of each seismogram.<br />
4. Get the “distance from the epicenter” from the graph you made earlier,<br />
using the “S‐P lag time” that you recorded at your seismic station.<br />
Earthquake epicenter activity<br />
<strong>Earthguide</strong> at Geosciences Research Division, Scripps Institution of Oceanography http://earthguide.ucsd.edu<br />
This project produced with support from COSEE California.<br />
Updated: July 30, 2009<br />
Name (s): ______________________________<br />
______________________________<br />
______________________________<br />
Date: ______________________________<br />
Station A<br />
Arrival time<br />
P‐wave ________________<br />
Arrival time<br />
S‐wave ________________<br />
S‐P<br />
lag time (s) ________________<br />
Distance from<br />
epicenter (km)<br />
(kilometers) ________________<br />
Station B<br />
Arrival time<br />
P‐wave ________________<br />
Arrival time<br />
S‐wave ________________<br />
S‐P<br />
lag time (s) ________________<br />
Distance from<br />
epicenter (km)<br />
(kilometers) ________________<br />
Station C<br />
Arrival time<br />
P‐wave ________________<br />
Arrival time<br />
S‐wave ________________<br />
S‐P<br />
lag time (s) ________________<br />
Distance from<br />
epicenter (km)<br />
(kilometers) ________________
Mystery Epicenter<br />
Group #1<br />
1. Mark the first arrival of the P‐wave on each seismogram.<br />
2. Mark the first arrival of the S‐wave on each seismogram.<br />
3. Write down your data in the box to the right of each seismogram.<br />
4. Get the “distance from the epicenter” from the graph you made earlier,<br />
using the “S‐P lag time” that you recorded at your seismic station.<br />
Earthquake epicenter activity<br />
<strong>Earthguide</strong> at Geosciences Research Division, Scripps Institution of Oceanography http://earthguide.ucsd.edu<br />
This project produced with support from COSEE California.<br />
Name (s): ______________________________<br />
______________________________<br />
______________________________<br />
Date: ______________________________<br />
Station A<br />
Arrival time<br />
P‐wave ________________<br />
Arrival time<br />
S‐wave ________________<br />
S‐P<br />
lag time (s) ________________<br />
Distance from<br />
epicenter (km)<br />
(kilometers) ________________<br />
Station B<br />
Arrival time<br />
P‐wave ________________<br />
Arrival time<br />
S‐wave ________________<br />
S‐P<br />
lag time (s) ________________<br />
Distance from<br />
epicenter (km)<br />
(kilometers) ________________<br />
Station C<br />
Arrival time<br />
P‐wave ________________<br />
Arrival time<br />
S‐wave ________________<br />
S‐P<br />
lag time (s) ________________<br />
Distance from<br />
epicenter (km)<br />
(kilometers) ________________
Mystery Epicenter<br />
Group #2<br />
1. Mark the first arrival of the P‐wave on each seismogram.<br />
2. Mark the first arrival of the S‐wave on each seismogram.<br />
3. Write down your data in the box to the right of each seismogram.<br />
4. Get the “distance from the epicenter” from the graph you made earlier,<br />
using the “S‐P lag time” that you recorded at your seismic station.<br />
Earthquake epicenter activity<br />
<strong>Earthguide</strong> at Geosciences Research Division, Scripps Institution of Oceanography http://earthguide.ucsd.edu<br />
This project produced with support from COSEE California.<br />
Name (s): ______________________________<br />
______________________________<br />
Station A<br />
Arrival time<br />
P‐wave ________________<br />
Arrival time<br />
S‐wave ________________<br />
S‐P<br />
lag time (s) ________________<br />
Distance from<br />
epicenter (km)<br />
(kilometers) ________________<br />
Station B<br />
Arrival time<br />
P‐wave ________________<br />
Arrival time<br />
S‐wave ________________<br />
S‐P<br />
lag time (s) ________________<br />
Distance from<br />
epicenter (km)<br />
(kilometers) ________________<br />
Station C<br />
Arrival time<br />
P‐wave ________________<br />
Arrival time<br />
S‐wave ________________<br />
S‐P<br />
lag time (s) ________________<br />
Distance from<br />
epicenter (km)<br />
(kilometers) ________________<br />
.0<br />
______________________________<br />
Date: ______________________________
Mystery Epicenter<br />
Group #3<br />
1. Mark the first arrival of the P‐wave on each seismogram.<br />
2. Mark the first arrival of the S‐wave on each seismogram.<br />
3. Write down your data in the box to the right of each seismogram.<br />
4. Get the “distance from the epicenter” from the graph you made earlier,<br />
using the “S‐P lag time” that you recorded at your seismic station.<br />
Earthquake epicenter activity<br />
<strong>Earthguide</strong> at Geosciences Research Division, Scripps Institution of Oceanography http://earthguide.ucsd.edu<br />
This project produced with support from COSEE California.<br />
Name (s): ______________________________<br />
______________________________<br />
______________________________<br />
Date: ______________________________<br />
Station A<br />
Arrival time<br />
P‐wave ________________<br />
Arrival time<br />
S‐wave ________________<br />
S‐P<br />
lag time (s) ________________<br />
Distance from<br />
epicenter (km)<br />
(kilometers) ________________<br />
Station B<br />
Arrival time<br />
P‐wave ________________<br />
Arrival time<br />
S‐wave ________________<br />
S‐P<br />
lag time (s) ________________<br />
Distance from<br />
epicenter (km)<br />
(kilometers) ________________<br />
Station C<br />
Arrival time<br />
P‐wave ________________<br />
Arrival time<br />
S‐wave ________________<br />
S‐P<br />
lag time (s) ________________<br />
Distance from<br />
epicenter (km)<br />
(kilometers) ________________
Mystery Epicenter<br />
Group #4<br />
1. Mark the first arrival of the P‐wave on each seismogram.<br />
2. Mark the first arrival of the S‐wave on each seismogram.<br />
3. Write down your data in the box to the right of each seismogram.<br />
4. Get the “distance from the epicenter” from the graph you made earlier,<br />
using the “S‐P lag time” that you recorded at your seismic station.<br />
Earthquake epicenter activity<br />
<strong>Earthguide</strong> at Geosciences Research Division, Scripps Institution of Oceanography http://earthguide.ucsd.edu<br />
This project produced with support from COSEE California.<br />
Name (s): ______________________________<br />
______________________________<br />
______________________________<br />
Date: ______________________________<br />
Station A<br />
Arrival time<br />
P‐wave ________________<br />
Arrival time<br />
S‐wave ________________<br />
S‐P<br />
lag time (s) ________________<br />
Distance from<br />
epicenter (km)<br />
(kilometers) ________________<br />
Station B<br />
Arrival time<br />
P‐wave ________________<br />
Arrival time<br />
S‐wave ________________<br />
S‐P<br />
lag time (s) ________________<br />
Distance from<br />
epicenter (km)<br />
(kilometers) ________________<br />
Station C<br />
Arrival time<br />
P‐wave ________________<br />
Arrival time<br />
S‐wave ________________<br />
S‐P<br />
lag time (s) ________________<br />
Distance from<br />
epicenter (km)<br />
(kilometers) ________________
Mystery Epicenter<br />
Group #5<br />
1. Mark the first arrival of the P‐wave on each seismogram.<br />
2. Mark the first arrival of the S‐wave on each seismogram.<br />
3. Write down your data in the box to the right of each seismogram.<br />
4. Get the “distance from the epicenter” from the graph you made earlier,<br />
using the “S‐P lag time” that you recorded at your seismic station.<br />
Earthquake epicenter activity<br />
<strong>Earthguide</strong> at Geosciences Research Division, Scripps Institution of Oceanography http://earthguide.ucsd.edu<br />
This project produced with support from COSEE California.<br />
Name (s): ______________________________<br />
______________________________<br />
______________________________<br />
Date: ______________________________<br />
Station A<br />
Arrival time<br />
P‐wave ________________<br />
Arrival time<br />
S‐wave ________________<br />
S‐P<br />
lag time (s) ________________<br />
Distance from<br />
epicenter (km)<br />
(kilometers) ________________<br />
Station B<br />
Arrival time<br />
P‐wave ________________<br />
Arrival time<br />
S‐wave ________________<br />
S‐P<br />
lag time (s) ________________<br />
Distance from<br />
epicenter (km)<br />
(kilometers) ________________<br />
Station C<br />
Arrival time<br />
P‐wave ________________<br />
Arrival time<br />
S‐wave ________________<br />
S‐P<br />
lag time (s) ________________<br />
Distance from<br />
epicenter (km)<br />
(kilometers) ________________
Mystery Epicenter<br />
Group #6<br />
1. Mark the first arrival of the P‐wave on each seismogram.<br />
2. Mark the first arrival of the S‐wave on each seismogram.<br />
3. Write down your data in the box to the right of each seismogram.<br />
4. Get the “distance from the epicenter” from the graph you made earlier,<br />
using the “S‐P lag time” that you recorded at your seismic station.<br />
Earthquake epicenter activity<br />
<strong>Earthguide</strong> at Geosciences Research Division, Scripps Institution of Oceanography http://earthguide.ucsd.edu<br />
This project produced with support from COSEE California.<br />
Name (s): ______________________________<br />
______________________________<br />
______________________________<br />
Date: ______________________________<br />
Station A<br />
Arrival time<br />
P‐wave ________________<br />
Arrival time<br />
S‐wave ________________<br />
S‐P<br />
lag time (s) ________________<br />
Distance from<br />
epicenter (km)<br />
(kilometers) ________________<br />
Station B<br />
Arrival time<br />
P‐wave ________________<br />
Arrival time<br />
S‐wave ________________<br />
S‐P<br />
lag time (s) ________________<br />
Distance from<br />
epicenter (km)<br />
(kilometers) ________________<br />
Station C<br />
Arrival time<br />
P‐wave ________________<br />
Arrival time<br />
S‐wave ________________<br />
S‐P<br />
lag time (s) ________________<br />
Distance from<br />
epicenter (km)<br />
(kilometers) ________________
Mystery Epicenter<br />
Group #7<br />
1. Mark the first arrival of the P‐wave on each seismogram.<br />
2. Mark the first arrival of the S‐wave on each seismogram.<br />
3. Write down your data in the box to the right of each seismogram.<br />
4. Get the “distance from the epicenter” from the graph you made earlier,<br />
using the “S‐P lag time” that you recorded at your seismic station.<br />
Earthquake epicenter activity<br />
<strong>Earthguide</strong> at Geosciences Research Division, Scripps Institution of Oceanography http://earthguide.ucsd.edu<br />
This project produced with support from COSEE California.<br />
Name (s): ______________________________<br />
______________________________<br />
______________________________<br />
Date: ______________________________<br />
Station A<br />
Arrival time<br />
P‐wave ________________<br />
Arrival time<br />
S‐wave ________________<br />
S‐P<br />
lag time (s) ________________<br />
Distance from<br />
epicenter (km)<br />
(kilometers) ________________<br />
Station B<br />
Arrival time<br />
P‐wave ________________<br />
Arrival time<br />
S‐wave ________________<br />
S‐P<br />
lag time (s) ________________<br />
Distance from<br />
epicenter (km)<br />
(kilometers) ________________<br />
Station C<br />
Arrival time<br />
P‐wave ________________<br />
Arrival time<br />
S‐wave ________________<br />
S‐P<br />
lag time (s) ________________<br />
Distance from<br />
epicenter (km)<br />
(kilometers) ________________
Mystery Epicenter<br />
Group #8<br />
1. Mark the first arrival of the P‐wave on each seismogram.<br />
2. Mark the first arrival of the S‐wave on each seismogram.<br />
3. Write down your data in the box to the right of each seismogram.<br />
4. Get the “distance from the epicenter” from the graph you made earlier,<br />
using the “S‐P lag time” that you recorded at your seismic station.<br />
Earthquake epicenter activity<br />
<strong>Earthguide</strong> at Geosciences Research Division, Scripps Institution of Oceanography http://earthguide.ucsd.edu<br />
This project produced with support from COSEE California.<br />
Name (s): ______________________________<br />
______________________________<br />
______________________________<br />
Date: ______________________________<br />
Station A<br />
Arrival time<br />
P‐wave ________________<br />
Arrival time<br />
S‐wave ________________<br />
S‐P<br />
lag time (s) ________________<br />
Distance from<br />
epicenter (km)<br />
(kilometers) ________________<br />
Station B<br />
Arrival time<br />
P‐wave ________________<br />
Arrival time<br />
S‐wave ________________<br />
S‐P<br />
lag time (s) ________________<br />
Distance from<br />
epicenter (km)<br />
(kilometers) ________________<br />
Station C<br />
Arrival time<br />
P‐wave ________________<br />
Arrival time<br />
S‐wave ________________<br />
S‐P<br />
lag time (s) ________________<br />
Distance from<br />
epicenter (km)<br />
(kilometers) ________________
Mystery Epicenter<br />
Group #9<br />
1. Mark the first arrival of the P‐wave on each seismogram.<br />
2. Mark the first arrival of the S‐wave on each seismogram.<br />
3. Write down your data in the box to the right of each seismogram.<br />
4. Get the “distance from the epicenter” from the graph you made earlier,<br />
using the “S‐P lag time” that you recorded at your seismic station.<br />
Earthquake epicenter activity<br />
<strong>Earthguide</strong> at Geosciences Research Division, Scripps Institution of Oceanography http://earthguide.ucsd.edu<br />
This project produced with support from COSEE California.<br />
Name (s): ______________________________<br />
______________________________<br />
______________________________<br />
Date: ______________________________<br />
Station A<br />
Arrival time<br />
P‐wave ________________<br />
Arrival time<br />
S‐wave ________________<br />
S‐P<br />
lag time (s) ________________<br />
Distance from<br />
epicenter (km)<br />
(kilometers) ________________<br />
Station B<br />
Arrival time<br />
P‐wave ________________<br />
Arrival time<br />
S‐wave ________________<br />
S‐P<br />
lag time (s) ________________<br />
Distance from<br />
epicenter (km)<br />
(kilometers) ________________<br />
Station C<br />
Arrival time<br />
P‐wave ________________<br />
Arrival time<br />
S‐wave ________________<br />
S‐P<br />
lag time (s) ________________<br />
Distance from<br />
epicenter (km)<br />
(kilometers) ________________
Mystery Epicenter<br />
Group #10<br />
1. Mark the first arrival of the P‐wave on each seismogram.<br />
2. Mark the first arrival of the S‐wave on each seismogram.<br />
3. Write down your data in the box to the right of each seismogram.<br />
4. Get the “distance from the epicenter” from the graph you made earlier,<br />
using the “S‐P lag time” that you recorded at your seismic station.<br />
Earthquake epicenter activity<br />
<strong>Earthguide</strong> at Geosciences Research Division, Scripps Institution of Oceanography http://earthguide.ucsd.edu<br />
This project produced with support from COSEE California.<br />
Name (s): ______________________________<br />
______________________________<br />
______________________________<br />
Date: ______________________________<br />
Station A<br />
Arrival time<br />
P‐wave ________________<br />
Arrival time<br />
S‐wave ________________<br />
S‐P<br />
lag time (s) ________________<br />
Distance from<br />
epicenter (km)<br />
(kilometers) ________________<br />
Station B<br />
Arrival time<br />
P‐wave ________________<br />
Arrival time<br />
S‐wave ________________<br />
S‐P<br />
lag time (s) ________________<br />
Distance from<br />
epicenter (km)<br />
(kilometers) ________________<br />
Station C<br />
Arrival time<br />
P‐wave ________________<br />
Arrival time<br />
S‐wave ________________<br />
S‐P<br />
lag time (s) ________________<br />
Distance from<br />
epicenter (km)<br />
(kilometers) ________________
Mystery Epicenter<br />
Group #11<br />
1. Mark the first arrival of the P‐wave on each seismogram.<br />
2. Mark the first arrival of the S‐wave on each seismogram.<br />
3. Write down your data in the box to the right of each seismogram.<br />
4. Get the “distance from the epicenter” from the graph you made earlier,<br />
using the “S‐P lag time” that you recorded at your seismic station.<br />
Earthquake epicenter activity<br />
<strong>Earthguide</strong> at Geosciences Research Division, Scripps Institution of Oceanography http://earthguide.ucsd.edu<br />
This project produced with support from COSEE California<br />
Updated: January 31, 2011.<br />
Name (s): ______________________________<br />
______________________________<br />
......<br />
______________________________<br />
Date: ______________________________<br />
Station A<br />
Arrival time<br />
P‐wave ________________<br />
Arrival time<br />
S‐wave ________________<br />
S‐P<br />
lag time (s) ________________<br />
Distance from<br />
epicenter (km)<br />
(kilometers) ________________<br />
Station B<br />
Arrival time<br />
P‐wave ________________<br />
Arrival time<br />
S‐wave ________________<br />
S‐P<br />
lag time (s) ________________<br />
Distance from<br />
epicenter (km)<br />
(kilometers) ________________<br />
Station C<br />
Arrival time<br />
P‐wave ________________<br />
Arrival time<br />
S‐wave ________________<br />
S‐P<br />
lag time (s) ________________<br />
Distance from<br />
epicenter (km)<br />
(kilometers) ________________
Mystery Epicenter<br />
Group #12<br />
1. Mark the first arrival of the P‐wave on each seismogram.<br />
2. Mark the first arrival of the S‐wave on each seismogram.<br />
3. Write down your data in the box to the right of each seismogram.<br />
4. Get the “distance from the epicenter” from the graph you made earlier,<br />
using the “S‐P lag time” that you recorded at your seismic station.<br />
Earthquake epicenter activity<br />
<strong>Earthguide</strong> at Geosciences Research Division, Scripps Institution of Oceanography http://earthguide.ucsd.edu<br />
This project produced with support from COSEE California.<br />
Name (s): ______________________________<br />
______________________________<br />
______________________________<br />
Date: ______________________________<br />
Station A<br />
Arrival time<br />
P‐wave ________________<br />
Arrival time<br />
S‐wave ________________<br />
S‐P<br />
lag time (s) ________________<br />
Distance from<br />
epicenter (km)<br />
(kilometers) ________________<br />
Station B<br />
Arrival time<br />
P‐wave ________________<br />
Arrival time<br />
S‐wave ________________<br />
S‐P<br />
lag time (s) ________________<br />
Distance from<br />
epicenter (km)<br />
(kilometers) ________________<br />
Station C<br />
Arrival time<br />
P‐wave ________________<br />
Arrival time<br />
S‐wave ________________<br />
S‐P<br />
lag time (s) ________________<br />
Distance from<br />
epicenter (km)<br />
(kilometers) ________________
Mystery Epicenter<br />
Group #13<br />
1. Mark the first arrival of the P‐wave on each seismogram.<br />
2. Mark the first arrival of the S‐wave on each seismogram.<br />
3. Write down your data in the box to the right of each seismogram.<br />
4. Get the “distance from the epicenter” from the graph you made earlier,<br />
using the “S‐P lag time” that you recorded at your seismic station.<br />
Earthquake epicenter activity<br />
<strong>Earthguide</strong> at Geosciences Research Division, Scripps Institution of Oceanography http://earthguide.ucsd.edu<br />
This project produced with support from COSEE California.<br />
Name (s): ______________________________<br />
______________________________<br />
______________________________<br />
Date: ______________________________<br />
Station A<br />
Arrival time<br />
P‐wave ________________<br />
Arrival time<br />
S‐wave ________________<br />
S‐P<br />
lag time (s) ________________<br />
Distance from<br />
epicenter (km)<br />
(kilometers) ________________<br />
Station B<br />
Arrival time<br />
P‐wave ________________<br />
Arrival time<br />
S‐wave ________________<br />
S‐P<br />
lag time (s) ________________<br />
Distance from<br />
epicenter (km)<br />
(kilometers) ________________<br />
Station C<br />
Arrival time<br />
P‐wave ________________<br />
Arrival time<br />
S‐wave ________________<br />
S‐P<br />
lag time (s) ________________<br />
Distance from<br />
epicenter (km)<br />
(kilometers) ________________
Mystery Epicenter<br />
Group #14<br />
1. Mark the first arrival of the P‐wave on each seismogram.<br />
2. Mark the first arrival of the S‐wave on each seismogram.<br />
3. Write down your data in the box to the right of each seismogram.<br />
4. Get the “distance from the epicenter” from the graph you made earlier,<br />
using the “S‐P lag time” that you recorded at your seismic station.<br />
Earthquake epicenter activity<br />
<strong>Earthguide</strong> at Geosciences Research Division, Scripps Institution of Oceanography http://earthguide.ucsd.edu<br />
This project produced with support from COSEE California.<br />
Name (s): ______________________________<br />
______________________________<br />
______________________________<br />
Date: ______________________________<br />
Station A<br />
Arrival time<br />
P‐wave ________________<br />
Arrival time<br />
S‐wave ________________<br />
S‐P<br />
lag time (s) ________________<br />
Distance from<br />
epicenter (km)<br />
(kilometers) ________________<br />
Station B<br />
Arrival time<br />
P‐wave ________________<br />
Arrival time<br />
S‐wave ________________<br />
S‐P<br />
lag time (s) ________________<br />
Distance from<br />
epicenter (km)<br />
(kilometers) ________________<br />
Station C<br />
Arrival time<br />
P‐wave ________________<br />
Arrival time<br />
S‐wave ________________<br />
S‐P<br />
lag time (s) ________________<br />
Distance from<br />
epicenter (km)<br />
(kilometers) ________________<br />
.

![Density Presentation 1 [.pdf] - Earthguide](https://img.yumpu.com/18214521/1/190x146/density-presentation-1-pdf-earthguide.jpg?quality=85)