Distribution characteristics and ecological risk of heavy metals in ...
Distribution characteristics and ecological risk of heavy metals in ...
Distribution characteristics and ecological risk of heavy metals in ...

Create successful ePaper yourself
Turn your PDF publications into a flip-book with our unique Google optimized e-Paper software.
Environment Protection Eng<strong>in</strong>eer<strong>in</strong>g<br />
Vol. 38 2012 No. 4<br />
DOI: 10.5277/EPE120412<br />
SEYEDEH BELIN TAVAKOLY SANY*, AISHAH SALLEH*, ABDUL HALIM SULAIMAN*,<br />
A. SASEKUMAR*, GHAZALEHMONAZAMI TEHRANI * , MAJID REZAYI** , ***<br />
DISTRIBUTION CHARACTERISTICS<br />
AND ECOLOGICAL RISK OF HEAVY METALS IN SURFACE<br />
SEDIMENTS OF WEST PORT, MALAYSIA<br />
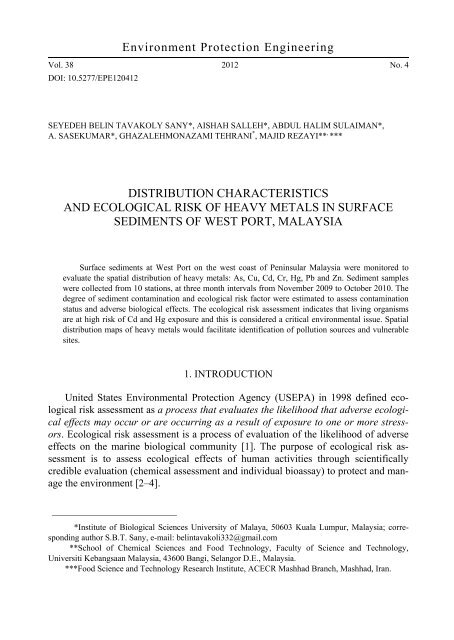
Surface sediments at West Port on the west coast <strong>of</strong> Pen<strong>in</strong>sular Malaysia were monitored to<br />
evaluate the spatial distribution <strong>of</strong> <strong>heavy</strong> <strong>metals</strong>: As, Cu, Cd, Cr, Hg, Pb <strong>and</strong> Zn. Sediment samples<br />
were collected from 10 stations, at three month <strong>in</strong>tervals from November 2009 to October 2010. The<br />
degree <strong>of</strong> sediment contam<strong>in</strong>ation <strong>and</strong> <strong>ecological</strong> <strong>risk</strong> factor were estimated to assess contam<strong>in</strong>ation<br />
status <strong>and</strong> adverse biological effects. The <strong>ecological</strong> <strong>risk</strong> assessment <strong>in</strong>dicates that liv<strong>in</strong>g organisms<br />
are at high <strong>risk</strong> <strong>of</strong> Cd <strong>and</strong> Hg exposure <strong>and</strong> this is considered a critical environmental issue. Spatial<br />
distribution maps <strong>of</strong> <strong>heavy</strong> <strong>metals</strong> would facilitate identification <strong>of</strong> pollution sources <strong>and</strong> vulnerable<br />
sites.<br />
1. INTRODUCTION<br />
United States Environmental Protection Agency (USEPA) <strong>in</strong> 1998 def<strong>in</strong>ed <strong>ecological</strong><br />
<strong>risk</strong> assessment as a process that evaluates the likelihood that adverse <strong>ecological</strong><br />
effects may occur or are occurr<strong>in</strong>g as a result <strong>of</strong> exposure to one or more stressors.<br />
Ecological <strong>risk</strong> assessment is a process <strong>of</strong> evaluation <strong>of</strong> the likelihood <strong>of</strong> adverse<br />
effects on the mar<strong>in</strong>e biological community [1]. The purpose <strong>of</strong> <strong>ecological</strong> <strong>risk</strong> assessment<br />
is to assess <strong>ecological</strong> effects <strong>of</strong> human activities through scientifically<br />
credible evaluation (chemical assessment <strong>and</strong> <strong>in</strong>dividual bioassay) to protect <strong>and</strong> manage<br />
the environment [2–4].<br />
________________________<br />
*Institute <strong>of</strong> Biological Sciences University <strong>of</strong> Malaya, 50603 Kuala Lumpur, Malaysia; correspond<strong>in</strong>g<br />
author S.B.T. Sany, e-mail: bel<strong>in</strong>tavakoli332@gmail.com<br />
**School <strong>of</strong> Chemical Sciences <strong>and</strong> Food Technology, Faculty <strong>of</strong> Science <strong>and</strong> Technology,<br />
Universiti Kebangsaan Malaysia, 43600 Bangi, Selangor D.E., Malaysia.<br />
***Food Science <strong>and</strong> Technology Research Institute, ACECR Mashhad Branch, Mashhad, Iran.
140<br />
S.B. TAVAKOLY SANY et al.<br />
In recent decades, many researchers have focused their attention on the potential<br />
threat <strong>of</strong> <strong>heavy</strong> <strong>metals</strong> <strong>in</strong> the environment [5–9] because <strong>of</strong> their toxicity <strong>and</strong> ability to<br />
accumulate <strong>in</strong> the food cha<strong>in</strong> [10, 11]. Despite attempts to control anthropogenic<br />
sources, metal concentrations <strong>in</strong>crease <strong>in</strong> the mar<strong>in</strong>e environment <strong>and</strong> are a serious<br />
threat to liv<strong>in</strong>g organisms <strong>and</strong> human health [5, 12, 13]. The majority <strong>of</strong> trace elements<br />
orig<strong>in</strong>ate from igneous rock. These concentrations can be used as background<br />
concentrations or concentrations that are unaffected by anthropogenic sources. This<br />
<strong>in</strong>formation can help to discrim<strong>in</strong>ate between the proportion <strong>of</strong> <strong>metals</strong> due to anthropogenic<br />
sources or natural sources <strong>in</strong> environment. In the mar<strong>in</strong>e environment, anthropogenic<br />
sources are <strong>in</strong>fluenced from several sources such as river discharge, deposition<br />
from the atmosphere, <strong>in</strong>dustrial waste <strong>in</strong>put <strong>and</strong> shipp<strong>in</strong>g activities [14, 15].<br />
There have been many studies on the toxic effects <strong>of</strong> essential <strong>and</strong> non-essential<br />
(tox<strong>in</strong>) <strong>heavy</strong> <strong>metals</strong>. These studies show that the optimal concentration <strong>of</strong> <strong>heavy</strong> <strong>metals</strong><br />
<strong>in</strong> the environment causes optimal function (reproduction <strong>and</strong> growth) <strong>of</strong> organisms<br />
<strong>and</strong> humans, <strong>and</strong> the variation <strong>of</strong> optimal concentrations leads to a decrease <strong>in</strong><br />
optimal function<strong>in</strong>g <strong>and</strong> eventual death [16, 17].<br />
At least twenty <strong>heavy</strong> <strong>metals</strong> have been identified as essential elements to the<br />
health <strong>of</strong> both humans <strong>and</strong> organisms at low quantities but toxic at slightly higher<br />
quantities. These <strong>in</strong>clude iron, chromium, nickel, manganese, copper <strong>and</strong> z<strong>in</strong>c. Lead,<br />
cadmium, mercury <strong>and</strong> arsenic are known as toxic <strong>metals</strong> <strong>and</strong> are considered the top<br />
twenty hazardous substances <strong>in</strong> the priority list prepared by US Environmental Protection<br />
Agency [18].<br />
Ecological <strong>risk</strong> assessment <strong>in</strong> costal water <strong>of</strong> the West Port is a difficult task because<br />
this area is greatly <strong>in</strong>fluenced by non-po<strong>in</strong>t sources <strong>of</strong> pollution such as shipp<strong>in</strong>g<br />
activities, port development <strong>and</strong> l<strong>and</strong> discharge. Strong hydrodynamic turbulence due<br />
to the northeast monsoon is another <strong>in</strong>fluential factor because it causes significant<br />
variation <strong>in</strong> contam<strong>in</strong>ation, a temporal scale probably brought about by dispersion <strong>of</strong><br />
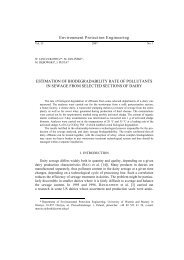
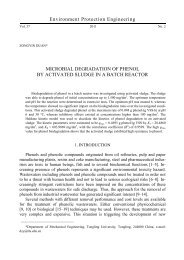
sediments. To reduce the limitations effect, the stations were selected on three parallels<br />
transect (l<strong>in</strong>es) with three distances (100, 500, 1000 m, respectively) from the<br />
coastl<strong>in</strong>e or berth l<strong>in</strong>e (cf. Fig. 1). This selection led to better underst<strong>and</strong><strong>in</strong>g <strong>of</strong> distribution<br />
pattern <strong>of</strong> contam<strong>in</strong>ants, <strong>and</strong> helped to select vulnerable station. Moreover, the<br />
field work<strong>in</strong>g was done fourfold dur<strong>in</strong>g one year (two times <strong>in</strong> northeast monsoon <strong>and</strong><br />
two times <strong>in</strong> southwest monsoon).<br />
The objectives <strong>of</strong> the present study are the follow<strong>in</strong>g: (i) estimat<strong>in</strong>g <strong>heavy</strong> metal<br />
concentrations (As, Cd, Cr, Cu, Hg, Pb, Zn) <strong>and</strong> to evaluate their contam<strong>in</strong>ation level<br />
<strong>in</strong> surface sediments, (ii) describ<strong>in</strong>g the distribution pattern <strong>of</strong> <strong>heavy</strong> <strong>metals</strong> <strong>in</strong> surface<br />
sediments <strong>and</strong> identify<strong>in</strong>g vulnerable stations, <strong>and</strong> (iii) evaluat<strong>in</strong>g <strong>ecological</strong> <strong>risk</strong> <strong>and</strong><br />
assess<strong>in</strong>g adverse biological effects on mar<strong>in</strong>e animals. In view <strong>of</strong> the importance <strong>of</strong><br />
West Port as an <strong>in</strong>ternational shipp<strong>in</strong>g port <strong>and</strong> an <strong>in</strong>dustrial centre located <strong>in</strong> a mangrove<br />
environment, it is necessary to study sediment chemistry <strong>in</strong> order to evaluate<br />
environmental quality to control pollution <strong>and</strong> protect liv<strong>in</strong>g resources.
Ecological <strong>risk</strong> <strong>of</strong> <strong>heavy</strong> <strong>metals</strong> <strong>in</strong> surface sediments<br />
2. EXPERIMENTAL<br />
Area <strong>of</strong> study. West Port is one <strong>of</strong> the Malaysia’s pr<strong>in</strong>cipal gateways <strong>and</strong> the busiest<br />
port with 22 berths. West Port has been developed along the Klang Strait <strong>and</strong> it is well<br />
sheltered by several mangrove isl<strong>and</strong>s <strong>and</strong> mudflats form<strong>in</strong>g a natural enclosure. The<br />
study area was restricted to a narrow channel between Klang Isl<strong>and</strong> <strong>and</strong> Che Mat Z<strong>in</strong><br />
Isl<strong>and</strong> on the west <strong>of</strong> the Indah isl<strong>and</strong>, n<strong>in</strong>e stations were selected from three transects<br />
parallel to the coastl<strong>in</strong>e at three different distances (Fig. 1 <strong>and</strong> Table 1) as well as one<br />
station as control po<strong>in</strong>t was selected 21 km away <strong>in</strong> a remote area from the West Port.<br />
The study area lies with<strong>in</strong> the humid tropics where the ra<strong>in</strong>y season prevails dur<strong>in</strong>g the<br />
northeast monsoon (November to March) <strong>and</strong> dry season dur<strong>in</strong>g the southwest monsoon<br />
(April to October). Heavy ra<strong>in</strong>fall is normally experienced dur<strong>in</strong>g the early part <strong>of</strong> the<br />
monsoon while dry spells occur dur<strong>in</strong>g the later part. At West Port, sea water had the<br />
follow<strong>in</strong>g <strong>characteristics</strong>: the average sal<strong>in</strong>ity 30.25 ± 1.36‰, average temperature<br />
30.04 ± 0.62 °C, average surface dissolved oxygen (DO) 5.38 ± 0.17 mg/dm 3 , <strong>and</strong><br />
monthly average surface <strong>and</strong> bottom pH values are between 7.85 <strong>and</strong> 8.25 [19].<br />
Fig. 1. Location <strong>of</strong> the sampl<strong>in</strong>g stations <strong>in</strong> West Port, Malaysia<br />
141
142<br />
S.B. TAVAKOLY SANY et al.<br />
Physical <strong>and</strong> chemical description <strong>of</strong> sampl<strong>in</strong>g stations<br />
Table 1<br />
Station Code Description<br />
F<strong>in</strong>e sediment<br />
[%]<br />
S<strong>and</strong><br />
[%]<br />
TOC<br />
[%]<br />
Depth<br />
[m]<br />
100 m after cement berth 1-WC100 coastl<strong>in</strong>e 53.57 46.42 10.24 12.5<br />
500 m after cement berth 2-WC500 remote area 45.96 54.03 7.74 19.5<br />
1000 m after cement berth 3-WC1000 mangrove 63.42 36.57 11.98 7.8<br />
100 m after liquid berth 4-WL100 coastl<strong>in</strong>e 56.33 43.66 9.14 13.3<br />
500 m after liquid berth 5-WL500 remote area 41.10 58.89 7.55 20.3<br />
1000 m after liquid berth 6-WL1000 mangrove 70.81 29.18 12.76 8.8<br />
100 m after conta<strong>in</strong>er berth 7-WT100 coastl<strong>in</strong>e 52.31 47.68 10.63 15.5<br />
500 m after conta<strong>in</strong>er berth 8-WT500 remote area 50.69 49.30 10.15 21.11<br />
1000 m after conta<strong>in</strong>er berth 9-WT1000 mangrove 70.36 29.63 15.49 6.8<br />
21 km from the Port 10-CP remote area 51.60 48.39 10.46 17.5<br />
Sampl<strong>in</strong>g <strong>and</strong> experimental methods. Sediment samples were dried at 105 °C) <strong>in</strong><br />
an oven, <strong>and</strong> passed through a 2 mm mesh sieve to remove coarser particles. A multiwavelength<br />
particle size analyzer (Beckman Coulter Company, model LS 13 320) was<br />
used to analyse the sediment granules. The percentages <strong>of</strong> the three fractions <strong>of</strong> gra<strong>in</strong><br />
sizes were measured: Clay (64 μm). A carbon analyzer<br />
(Horbia Model 8210) was used to estimate the total organic carbon (TOC) <strong>and</strong><br />
their specific procedure was described by Fang <strong>and</strong> Hong [20].<br />
About 2 g <strong>of</strong> the sediment used for metal analysis was treated with 2 cm 3 <strong>of</strong> 48%<br />
hydr<strong>of</strong>luoric acid (HF) <strong>and</strong> 2 cm 3 <strong>of</strong> 65% nitric acid (HNO3), heated to dryness, <strong>and</strong><br />
allowed to cool down. 0.5 g <strong>of</strong> 99.99% boric acid was added to the cooled solution<br />
<strong>and</strong> the result<strong>in</strong>g suspensions was centrifuged. The decanted solution from the centrifugal<br />
operation was filtered us<strong>in</strong>g Whatman No. 40 filter paper <strong>and</strong> the volume<br />
made up to 50 cm 3 with demonized water for measurement <strong>of</strong> total concentration <strong>of</strong><br />
<strong>heavy</strong> <strong>metals</strong> [21]. Plasma mass spectrometry (ICP/MS) was used to analyze the follow<strong>in</strong>g<br />
suite <strong>of</strong> <strong>metals</strong>: As, Cu, Cd, Cr, Hg, Pb <strong>and</strong> Zn. Stock reference solutions <strong>of</strong><br />
1000 mg/dm 3 were diluted to prepare work<strong>in</strong>g st<strong>and</strong>ards <strong>and</strong> the matrix matched with<br />
similar acidity, both important for various concentration ranges. The entire chemical<br />
compound used had the highest purity <strong>and</strong> Milliq <strong>and</strong> Ellix quality water <strong>and</strong> soap<br />
were applied to wash <strong>and</strong> r<strong>in</strong>se the crystal material <strong>and</strong> Teflon bottles prior to analysis.<br />
Laboratory blanks, field duplicates, <strong>and</strong> st<strong>and</strong>ard reference materials (SRM) 2702<br />
were applied to improve quality assurance dur<strong>in</strong>g laboratory analyses. SRM 2702 is<br />
a natural st<strong>and</strong>ard reference <strong>of</strong> <strong>in</strong>organic material collected from mar<strong>in</strong>e sediment with<br />
the licensed concentration.<br />
In this study, the percentage <strong>of</strong> recovery varied between 91 <strong>and</strong> 104 The st<strong>and</strong>ard<br />
methods <strong>in</strong>dicated warn<strong>in</strong>g limits for matrix spike recoveries from 87 to 113%; thus,<br />
the range <strong>of</strong> recovery was reasonable <strong>in</strong> this study [22]. Potential contam<strong>in</strong>ation was<br />
detected by reagent blanks dur<strong>in</strong>g the analytical <strong>and</strong> digestion procedure. Statistical
Ecological <strong>risk</strong> <strong>of</strong> <strong>heavy</strong> <strong>metals</strong> <strong>in</strong> surface sediments<br />
analysis <strong>of</strong> nonparametric Kurskal Wallis was applied to better underst<strong>and</strong> metal<br />
variation <strong>and</strong> significant differences between stations. Geo-statistical analysis was<br />
done with the Surfer 8 s<strong>of</strong>tware based on GPS values obta<strong>in</strong>ed from stations. This<br />
method is a practical tool for better underst<strong>and</strong><strong>in</strong>g contam<strong>in</strong>ation <strong>in</strong> each location because<br />
this provides a comprehensive distribution pattern along a large area.<br />
Ecological <strong>risk</strong> assessment. Hakanson developed a model to assess <strong>ecological</strong> <strong>risk</strong><br />
for toxic compounds <strong>in</strong> aquatic systems. The model is known as a practical model to<br />
evaluate aquatic pollution. It may <strong>in</strong>tegrate mutual <strong>in</strong>teractions, toxicity sedimentation<br />
character <strong>and</strong> sensitivity <strong>of</strong> aquatic systems. The model was described based on the<br />
degree <strong>of</strong> sediment contam<strong>in</strong>ation <strong>and</strong> potential <strong>ecological</strong> <strong>risk</strong> <strong>in</strong>dex for the bas<strong>in</strong> <strong>and</strong><br />
given substance [23–25].<br />
The contam<strong>in</strong>ation degree is estimated to assess contam<strong>in</strong>ation level <strong>of</strong> contam<strong>in</strong>ants<br />
<strong>in</strong> sediment by concentration <strong>of</strong> substance <strong>and</strong> background value [26]<br />
C<br />
n n n<br />
i<br />
0−1 d = f = i<br />
i= 1 j= 1 Cn<br />
C C<br />
where: C d – the contam<strong>in</strong>ation degree,<br />
143<br />
∑ ∑ (1)<br />
i<br />
i<br />
C f – the contam<strong>in</strong>ation factor, 0 1<br />
C − – the average<br />
content <strong>of</strong> compound <strong>in</strong> question (i) from surface sediment (0–1 cm) at the accu-<br />
i<br />
mulation area, C n – background value for the compound estimated from Eq. (2) based<br />
on the data <strong>of</strong> previous studies dur<strong>in</strong>g [23]:<br />
C = x+ s<br />
(2)<br />
i<br />
n x<br />
i<br />
where C n is the natural background value, x is is the mean <strong>of</strong> per-<strong>in</strong>dustrial data or old<br />
previous studies <strong>and</strong> sx is a st<strong>and</strong>ard division. Contam<strong>in</strong>ation factor was ranged as low<br />
i<br />
i<br />
i<br />
i<br />
( C n < 1), moderate (1 ≤ C f < 3), considerable (3 ≤ C f < 6), <strong>and</strong> very high ( C f ≥ 6). The<br />
contam<strong>in</strong>ation degree (Cd) is estimated based on the sum <strong>of</strong> all contam<strong>in</strong>ation factors. The<br />
contam<strong>in</strong>ation degree <strong>of</strong> sediment may be classified as: low (Cd < 8), moderate<br />
(8 ≤ Cd < 16), considerable (16 ≤ Cd < 32), <strong>and</strong> very high (Cd ≥ 32).<br />
Potential <strong>ecological</strong> <strong>risk</strong> <strong>in</strong>dex was def<strong>in</strong>ed for the bas<strong>in</strong> <strong>and</strong> given substance<br />
through the toxic response factor (Eq. (4)) [27, 28]. To evaluate the toxic response<br />
factor, sediment-logical toxic factor (St i value) <strong>and</strong> bio-production (BPI) should be<br />
estimated. Hakanson proposed a new concept about the toxic factor based on the<br />
abundance pr<strong>in</strong>ciple. He <strong>in</strong>dicated that the potential toxicological effect <strong>of</strong> an element<br />
is proportional to the abundance <strong>of</strong> this element <strong>in</strong> nature. Abundance numbers are<br />
estimated based on abundance <strong>of</strong> various elements which were provided at least <strong>in</strong><br />
4 different types <strong>of</strong> biological <strong>and</strong> geological media such as igneous rocks, soils, fresh
144<br />
S.B. TAVAKOLY SANY et al.<br />
or mar<strong>in</strong>e water, l<strong>and</strong> animals <strong>and</strong> l<strong>and</strong> plants [29]. The <strong>in</strong>formation provides beneficial<br />
revision <strong>of</strong> the results given <strong>in</strong> this background media. The relative abundance <strong>of</strong><br />
various elements is measured based on the equation:<br />
element with high mean concentration<br />
Relative abundance =<br />
mean concentration <strong>of</strong> other elements<br />
The abundance number have been obta<strong>in</strong>ed, the largest value <strong>of</strong> relative abundance<br />
should be omitted for every element <strong>in</strong> different media <strong>and</strong> the sum <strong>of</strong> these<br />
relative numbers has been estimated <strong>and</strong> divided <strong>in</strong>to the lowest mean value <strong>of</strong> relative<br />
abundance.<br />
The abundance number is not equivalent to the St i <strong>and</strong> s<strong>in</strong>k-effect factor <strong>and</strong> problem<br />
<strong>of</strong> dimension should be measured. The s<strong>in</strong>k-effect factor means the various elements<br />
make different “f<strong>in</strong>gerpr<strong>in</strong>ts” <strong>in</strong> sediment with different tendencies to be deposited<br />
<strong>in</strong> the sediment. S<strong>in</strong>k factors have been obta<strong>in</strong>ed by compar<strong>in</strong>g the natural<br />
background values for water with natural background values for sediments. St i values<br />
are obta<strong>in</strong>ed by multiply<strong>in</strong>g the s<strong>in</strong>k factors with the abundance numbers. To reduce<br />
dimension between <strong>and</strong> contam<strong>in</strong>ation factor is that, all corrected abundance should be<br />
divided to the lowest corrected abundance for mak<strong>in</strong>g normation between elements.<br />
Then to get reliable dimensions, the square root is taken from these figures <strong>and</strong> the<br />
values also rounded to emphasize the accuracy <strong>of</strong> the method. These values seem to be<br />
reliable sedimentological toxic factors for all elements [3, 4].<br />
Hakanson [23] described a specific method to measure the BPI values for aquatic<br />
system. He determ<strong>in</strong>ed the BPI by measur<strong>in</strong>g the ignition loss (the IG value) <strong>and</strong> the<br />
nitrogen content (the N value) <strong>of</strong> sediment. The BPI value was then described as the<br />
N content on the regression l<strong>in</strong>e for IG = 10%. The N content is given <strong>in</strong> mg/g ds, the<br />
IG content <strong>in</strong> % ds. Thus, the toxic response factor (Tr i ) was def<strong>in</strong>ed accord<strong>in</strong>g to the<br />
sediment logical toxic factor (St i <strong>and</strong> the sensitivity requirement (given by the BPl).<br />
Tr i was determ<strong>in</strong>ed by multiply<strong>in</strong>g the St i with BPl. Tr i is an analogue to the contam<strong>in</strong>ation<br />
factor [29]<br />
n<br />
i<br />
n<br />
i i<br />
f<br />
i= 1 i=<br />
1<br />
RI = Er = Tr C<br />
(3)<br />
∑ ∑ (4)<br />
where: Er i is the potential <strong>ecological</strong> <strong>risk</strong> <strong>in</strong>dex for the given substance, Tr i is the toxic<br />
i<br />
response factor for a given compound <strong>and</strong> C f is equal to the contam<strong>in</strong>ation factor, RI<br />
is the potential <strong>ecological</strong> <strong>risk</strong> <strong>in</strong>dex for the aquatic area.<br />
The follow<strong>in</strong>g ranges <strong>of</strong> RI values have been accepted: low <strong>ecological</strong> <strong>risk</strong><br />
– RI < 150, moderate <strong>ecological</strong> <strong>risk</strong> – 150 ≤ RI < 300, considerable <strong>ecological</strong> <strong>risk</strong><br />
– 150 ≤ RI < 300 <strong>and</strong> very high <strong>ecological</strong> <strong>risk</strong> – RI > 600). Er i value def<strong>in</strong>es the level
Ecological <strong>risk</strong> <strong>of</strong> <strong>heavy</strong> <strong>metals</strong> <strong>in</strong> surface sediments<br />
<strong>of</strong> potential <strong>risk</strong> for <strong>in</strong>vestigated toxic factor by the follow<strong>in</strong>g rank: Low potential<br />
<strong>ecological</strong> <strong>risk</strong> – Er i < 150, moderate – 40 ≤ Er i < 80, considerable – 80 ≤ Er i < 160,<br />
high – 160 ≤ Er i < 320, <strong>and</strong> very high – Er i > 320 [3, 30, 31].<br />
3. RESULTS AND DISCUSSION<br />
3.1. SPATIAL DISTRIBUTION<br />
The physical <strong>and</strong> chemical <strong>characteristics</strong> <strong>of</strong> surface sediments <strong>of</strong> the West Port<br />
are summarized <strong>in</strong> Table 1. Analysis <strong>of</strong> sediment gra<strong>in</strong> size <strong>in</strong>dicated that f<strong>in</strong>e-gra<strong>in</strong>ed<br />
sediment (
146<br />
S.B. TAVAKOLY SANY et al.<br />
is significant difference (α < 0.05) between this station <strong>and</strong> others stations. The content<br />
<strong>of</strong> Cd <strong>and</strong> Hg decreased from mangrove forest to coastl<strong>in</strong>e <strong>and</strong> concentration <strong>of</strong><br />
Hg peaked at two stations WL1000 <strong>and</strong> WL500.<br />
Fig. 2. Spatial distribution <strong>of</strong> <strong>heavy</strong> <strong>metals</strong> <strong>in</strong> surface sediments [μg·g –1 ]<br />
Studies elsewhere <strong>in</strong>dicate that several factors such as erosion, sedimentation,<br />
sediment type, water dynamics, urbanisation, <strong>in</strong>dustrialisation, river discharge, <strong>and</strong><br />
geochemical reactions affect the distribution <strong>and</strong> constitution <strong>of</strong> <strong>heavy</strong> <strong>metals</strong> <strong>in</strong><br />
coastal <strong>and</strong> estuar<strong>in</strong>e waters [39–45]. In West Port, most <strong>of</strong> the <strong>metals</strong> (Zn, Cr, As, Pb,<br />
Cu) showed the same pattern <strong>of</strong> distribution. High concentrations <strong>of</strong> these <strong>heavy</strong> <strong>metals</strong><br />
were found <strong>in</strong> stations located <strong>in</strong> the south <strong>of</strong> strait (WT100 <strong>and</strong> WT1000). This<br />
result may be due to the large conta<strong>in</strong>er term<strong>in</strong>al <strong>and</strong> the <strong>in</strong>flow <strong>of</strong> l<strong>and</strong> run<strong>of</strong>f <strong>in</strong> the<br />
south <strong>of</strong> West Port, which may have caused an <strong>in</strong>crease <strong>in</strong> metal concentration. More-
Ecological <strong>risk</strong> <strong>of</strong> <strong>heavy</strong> <strong>metals</strong> <strong>in</strong> surface sediments<br />
over, this distribution pattern may be related to particle size <strong>of</strong> sediment because high<br />
percentage <strong>of</strong> f<strong>in</strong>e particles (silt <strong>and</strong> clay) was observed <strong>in</strong> the south <strong>of</strong> the strait.<br />
Table 2<br />
Average <strong>and</strong> st<strong>and</strong>ard division (SD) <strong>of</strong> concentrations <strong>of</strong> <strong>heavy</strong> <strong>metals</strong><br />
<strong>in</strong> surface sediment dur<strong>in</strong>g sampl<strong>in</strong>g periods [μg·g –1 ]<br />
Station As Cu Cr Cd Pb Hg Zn<br />
1-WC100<br />
mean<br />
S D<br />
35.82<br />
7.92<br />
16.11<br />
4.72<br />
58.64<br />
6.95<br />
0.68<br />
0.33<br />
54.97<br />
7.83<br />
0.25<br />
0.08<br />
49.51<br />
13.33<br />
2-WC500<br />
mean<br />
SD<br />
51.62<br />
25.48<br />
11.35<br />
2.00<br />
47.06<br />
12.57<br />
0.81<br />
0.33<br />
52.55<br />
13.83<br />
0.20<br />
0.05<br />
36.47<br />
15.05<br />
3-WC1000<br />
mean<br />
SD<br />
68.13<br />
33.34<br />
14.72<br />
2.56<br />
48.91<br />
10.24<br />
0.89<br />
0.34<br />
51.31<br />
5.95<br />
0.20<br />
0.05<br />
37.19<br />
12.49<br />
4-WL100<br />
mean<br />
SD<br />
67.49<br />
32.28<br />
13.96<br />
1.59<br />
37.20<br />
7.16<br />
0.28<br />
0.07<br />
57.71<br />
7.88<br />
0.25<br />
0.09<br />
37.32<br />
12.31<br />
5-WL500<br />
mean<br />
SD<br />
47.64<br />
11.24<br />
13.00<br />
2.35<br />
36.08<br />
10.88<br />
0.28<br />
0.10<br />
54.07<br />
7.95<br />
0.30<br />
0.08<br />
32.82<br />
10.80<br />
mean<br />
6-WL1000<br />
SD<br />
50.31<br />
5.53<br />
15.69<br />
3.79<br />
47.05<br />
8.60<br />
0.62<br />
0.43<br />
58.23<br />
6.72<br />
0.31<br />
0.07<br />
35.11<br />
11.16<br />
7-WT100<br />
mean<br />
SD<br />
94.24<br />
37.13<br />
16.81<br />
2.64<br />
60.56<br />
4.21<br />
0.95<br />
0.49<br />
7.11<br />
19.89<br />
0.30<br />
0.09<br />
49.87<br />
20.35<br />
8-WT500<br />
mean<br />
SD<br />
59.07<br />
14.02<br />
12.13<br />
1.67<br />
42.79<br />
5.51<br />
0.73<br />
0.62<br />
53.46<br />
9.64<br />
0.21<br />
0.02<br />
33.00<br />
12.51<br />
mean<br />
9-WT1000<br />
SD<br />
78.31<br />
33.67<br />
17.60<br />
6.77<br />
45.98<br />
5.26<br />
1.26<br />
0.57<br />
71.55<br />
9.83<br />
0.28<br />
0.05<br />
40.02<br />
19.61<br />
10-CP<br />
mean<br />
SD<br />
27.57<br />
7.31<br />
8.87<br />
2.38<br />
18.69<br />
4.07<br />
0.05<br />
0.057<br />
31.11<br />
8.09<br />
0.14<br />
0.005<br />
29.52<br />
5.35<br />
Several researchers reported that sediment particle size is a significant parameter<br />
which is able to control <strong>heavy</strong> metal concentration because f<strong>in</strong>e particles have high<br />
ability to adsorb soluble <strong>heavy</strong> <strong>metals</strong> <strong>and</strong> deposit them at the bottom sediment<br />
[41, 46, 47]. Spatial maps show that Zn <strong>and</strong> Cr display high concentrations <strong>in</strong> stations<br />
located <strong>in</strong> the east side <strong>of</strong> strait (along coastl<strong>in</strong>e). These stations were probably affected<br />
by <strong>in</strong>dustrial waste which is loaded from the <strong>in</strong>dustrial outlets that were located<br />
along coastl<strong>in</strong>e. The content <strong>of</strong> Cd <strong>and</strong> Hg decreased from mangrove l<strong>in</strong>e to a coastl<strong>in</strong>e<br />
which was related to the higher concentration <strong>of</strong> TOC <strong>and</strong> f<strong>in</strong>e gra<strong>in</strong> size <strong>in</strong> mangrove<br />
sediment. Many studies show that mangrove sediments act as a trap for chemical<br />
contam<strong>in</strong>ants because such sediments conta<strong>in</strong> high percentage <strong>of</strong> silt <strong>and</strong> clay that<br />
cause an <strong>in</strong>crease <strong>in</strong> the <strong>metals</strong> adsorption <strong>in</strong> these stations [42, 48–50]. Furthermore,<br />
the concentration <strong>of</strong> Hg peaked at two stations WL1000 <strong>and</strong> WL500 because these<br />
stations were <strong>in</strong>fluenced by <strong>in</strong>dustrial waste flow<strong>in</strong>g from the l<strong>and</strong>.<br />
147
148<br />
S.B. TAVAKOLY SANY et al.<br />
3.2. DEGREE OF CONTAMINATION AND ADVERSE BIOLOGICAL EFFECTS<br />
Table 3 shows the concentrations <strong>of</strong> <strong>metals</strong> when compared with sediment quality<br />
guidel<strong>in</strong>es <strong>and</strong> background value to assess contam<strong>in</strong>ation degree <strong>and</strong> adverse biological<br />
effect. The New York Sediment Criteria <strong>and</strong> Prov<strong>in</strong>cial Sediment Quality Guidel<strong>in</strong>es<br />
for <strong>metals</strong> are divided <strong>in</strong>to low range effect (ISQG-Low) <strong>and</strong> high effect range<br />
(ISQG-High). ISQG-L level <strong>in</strong>dicates the sediment contam<strong>in</strong>ants do not have adverse<br />
effects on aquatic organisms <strong>in</strong> sediment. ISQG-H level <strong>in</strong>dicates that the sediment<br />
contam<strong>in</strong>ant certa<strong>in</strong>ly have adverse effects on organisms that live <strong>in</strong> the sediment.<br />
Also the level <strong>of</strong> sediment contam<strong>in</strong>ation that is between ISOG-L <strong>and</strong> ISQG-H shows<br />
that the contam<strong>in</strong>ants probably have adverse effects [51]. Accord<strong>in</strong>g to this comparison,<br />
the level <strong>of</strong> Zn, Cu, Ni <strong>and</strong> Cr are below sediment background values <strong>and</strong> ISQG-L<br />
level (except for Cr) <strong>and</strong> concentration <strong>of</strong> As, Cd, Hg <strong>and</strong> Pb exceeded ISQG-L levels<br />
<strong>and</strong> their sediment background value. In the control station, the concentrations <strong>of</strong> all<br />
<strong>metals</strong> were lower than the sediment background values <strong>and</strong> ISQG-L level except for<br />
As <strong>and</strong> Hg which exceeded the background value. This implies that the occasional<br />
toxic effects are expected for Hg, Pb <strong>and</strong> Cd <strong>and</strong> high adverse effect probably occur for<br />
As. Table 4 gives the better view <strong>of</strong> the sediment situation at all stations, which describe<br />
the rank<strong>in</strong>g order based on the contam<strong>in</strong>ation factor <strong>and</strong> contam<strong>in</strong>ation degree.<br />
Average concentrations <strong>of</strong> <strong>heavy</strong> <strong>metals</strong> obta<strong>in</strong>ed <strong>in</strong> this study<br />
with sediment quality guidel<strong>in</strong>es <strong>and</strong> background value [μg·g –1 ]<br />
Table 3<br />
Subject Zn Pb Cu Cd Ni As Hg Cr<br />
Present study 39.15 58.4 14.6 0.79 12.2 62.02 0.25 47.05<br />
Background value <strong>in</strong> this study<br />
New York sediment criteria [61]<br />
141.2<br />
2<br />
39.8 23.21 0.186 32.77 18.79 0.08 53.71<br />
lowest effects range<br />
120 32 16 0.6 16 6 0.15 26<br />
sever effects range<br />
Sediment quality criteria [62, 63]<br />
270 110 110 9 50 33 1.3 110<br />
lowest effects range (ISQG-low) 120 31 16 0.6 16 6 0.2 26<br />
high effects range (ISQG-high) 220 250 110 10 75 33 2 110<br />
The metal contam<strong>in</strong>ation factor (CF) was also applied to evaluate the anthropogenic<br />
contribution <strong>of</strong> <strong>heavy</strong> <strong>metals</strong> <strong>in</strong> surface sediments. The Cf values for Cu, Cr, <strong>and</strong><br />
Zn were lower than 1 <strong>and</strong> were found at an unpolluted level at all stations, suggest<strong>in</strong>g<br />
these <strong>metals</strong> may have entirely orig<strong>in</strong>ated from natural processes or crustal materials.<br />
The contam<strong>in</strong>ation factor for Pb reached moderate value <strong>in</strong> all stations (except for Cd),<br />
<strong>in</strong>dicat<strong>in</strong>g that the sediment at West Port had moderate anthropogenic <strong>in</strong>puts <strong>of</strong> these<br />
<strong>heavy</strong> <strong>metals</strong>. Contam<strong>in</strong>ation factor for Cd <strong>in</strong> all stations (except stations WL100,
Ecological <strong>risk</strong> <strong>of</strong> <strong>heavy</strong> <strong>metals</strong> <strong>in</strong> surface sediments<br />
WL500, CP) was found between high <strong>and</strong> very high values, com<strong>in</strong>g from anthropogenic<br />
sources. Hg <strong>and</strong> As were between moderately polluted to highly polluted <strong>and</strong> the<br />
sequence <strong>of</strong> Cf values for <strong>metals</strong> was Cd > As > Hg > Pb > Cr > Zn > Cu. Contam<strong>in</strong>ation<br />
degrees for stations WT100 <strong>and</strong> WT1000 were high, whereas they were moderate<br />
<strong>in</strong> other stations <strong>in</strong>side the West Port <strong>and</strong> low at the control po<strong>in</strong>t. The results <strong>of</strong> sediment<br />
quality assessment are good evidence to confirm that the surface sediment <strong>of</strong> the<br />
West Port is highly polluted by Cd, Hg <strong>and</strong> As <strong>and</strong> it is moderately contam<strong>in</strong>ated with<br />
Pb (Table 4); the concentrations <strong>of</strong> these <strong>metals</strong> are significantly higher than ISQG-L<br />
<strong>and</strong> their sediment background values.<br />
Contam<strong>in</strong>ation factor (Cf) <strong>and</strong> contam<strong>in</strong>ation degree (C d) at all stations<br />
Station<br />
Cu, Cr<br />
<strong>and</strong> Zn<br />
Pb As Cd Hg<br />
1-WC100<br />
2-WC500<br />
3-WC1000<br />
4-WL100<br />
i<br />
1≤ C f < 3<br />
moderate<br />
i<br />
3≤ C f < 6<br />
high<br />
i<br />
1≤ C f < 3<br />
i<br />
1≤ C f < 3<br />
moderate<br />
5-WL500<br />
moderate<br />
6-WL1000<br />
i<br />
1≤ C f < 3<br />
7-WT100<br />
8-WT500<br />
9-WT1000<br />
Average value<br />
<strong>in</strong>side West Port<br />
i<br />
C f < 1<br />
unpolluted<br />
moderate<br />
i<br />
3≤ C f < 6<br />
high<br />
i<br />
3≤ C f < 6<br />
high<br />
i<br />
3≤ C f < 6<br />
high<br />
10-CP<br />
i<br />
C f < 1<br />
unpolluted<br />
i<br />
1≤ C f < 3<br />
moderate<br />
i<br />
C f < 1<br />
unpolluted<br />
i<br />
1≤ C f < 3<br />
moderate<br />
Table 4<br />
n<br />
i<br />
d = ∑ f<br />
i=<br />
1<br />
C C<br />
8≤ Cd<br />
< 16<br />
moderate<br />
16 ≤ Cd<br />
< 32<br />
high<br />
8≤ Cd<br />
< 16<br />
moderate<br />
C d < 8<br />
low<br />
The results obta<strong>in</strong>ed <strong>in</strong> his study <strong>in</strong>dicate that <strong>heavy</strong> metal contam<strong>in</strong>ation <strong>in</strong> sediments<br />
<strong>of</strong> West Port was attributed to both natural processes or logical m<strong>in</strong>eralogy, <strong>and</strong><br />
human activities (anthropogenic). Furthermore, there was significant anthropogenic<br />
<strong>in</strong>put <strong>of</strong> Cd, Hg <strong>and</strong> As especially <strong>in</strong> stations close to berth l<strong>in</strong>e (Table 4). Anthropogenic<br />
source <strong>of</strong> <strong>metals</strong> can be due to disturbances, which changed the associated geochemical<br />
concentration ratios, <strong>and</strong> that the metal concentrations <strong>in</strong>creased from their<br />
st<strong>and</strong>ard range. The relative concentration ratio <strong>of</strong> <strong>metals</strong> exceeds st<strong>and</strong>ard variation<br />
levels <strong>in</strong> the sediment when geochemical metal concentrations experience disturbances<br />
due to environmental change [52, 53].<br />
These disturbances may be related to differential derivation <strong>of</strong> these contam<strong>in</strong>ations<br />
from lithogenic sources <strong>and</strong> multiple anthropogenic sources. Several studies<br />
149
150<br />
S.B. TAVAKOLY SANY et al.<br />
described Cd, Pb, Hg <strong>and</strong> As orig<strong>in</strong>ate ma<strong>in</strong>ly derived from <strong>in</strong>dustrial processes <strong>in</strong>clud<strong>in</strong>g<br />
m<strong>in</strong><strong>in</strong>g, burn<strong>in</strong>g <strong>of</strong> fossil fuels, waste recycl<strong>in</strong>g, cement manufactur<strong>in</strong>g, as<br />
well as paper <strong>and</strong> glass production [11, 54–59]. There are several <strong>in</strong>dustries <strong>in</strong> West<br />
Port <strong>in</strong>volved <strong>in</strong> cement manufactur<strong>in</strong>g, palm oil process<strong>in</strong>g <strong>and</strong> oil/electrical based<br />
power generation. Other sources <strong>of</strong> these <strong>metals</strong> might be due to atmospheric deposition,<br />
terrestrial run<strong>of</strong>fs, which are the ma<strong>in</strong> routes <strong>of</strong> metal release <strong>in</strong>to the mar<strong>in</strong>e<br />
environments. In addition, As, Cd <strong>and</strong> Hg are widely able to enrich sediment through<br />
recycl<strong>in</strong>g by plants because these <strong>metals</strong> are easily absorbed by plants <strong>and</strong> enter the<br />
biological cycle [60]. Moreover, the high concentration <strong>of</strong> Cd <strong>and</strong> As could have<br />
orig<strong>in</strong>ated from tsunami sediment deposition, ship waste, embarkation activities <strong>and</strong><br />
anticorrosive pa<strong>in</strong>ts used on mar<strong>in</strong>e vessels [7]. The highest contam<strong>in</strong>ation <strong>of</strong> all<br />
<strong>heavy</strong> <strong>metals</strong> around the term<strong>in</strong>al conta<strong>in</strong>er (WL100 <strong>and</strong> WL1000) is consistent with<br />
observations that this term<strong>in</strong>al is probably a ma<strong>in</strong> source <strong>of</strong> <strong>heavy</strong> metal release, especially<br />
for Cd <strong>and</strong> As because <strong>of</strong> high traffic <strong>of</strong> shipp<strong>in</strong>g <strong>in</strong> this area.<br />
3.3. ECOLOGICAL RISK ASSESSMENT<br />
Sediment-logical toxic factor (St i ), potential <strong>ecological</strong> <strong>risk</strong> factor (Er i ) <strong>and</strong> <strong>ecological</strong><br />
<strong>risk</strong> <strong>in</strong>dex (RI) for various <strong>heavy</strong> <strong>metals</strong> were estimated accord<strong>in</strong>g to various<br />
methodologies which are summarized <strong>in</strong> Tables 5 <strong>and</strong> 6.<br />
Metal Abundance<br />
number<br />
Determ<strong>in</strong>ation <strong>of</strong> the s<strong>in</strong>k-factor <strong>and</strong> sediment-logical toxic factors<br />
Background<br />
mar<strong>in</strong>e water<br />
[mg/dm 3 ]<br />
Sediment<br />
background<br />
[mg/kg]<br />
S<strong>in</strong>k<br />
factor a<br />
S<strong>in</strong>k factor<br />
× abundance<br />
number<br />
St i<br />
West<br />
Port b<br />
St i<br />
Hakanson<br />
1980 [23]<br />
Table 5<br />
Cd 252 0.0001 0.186 0.53 151.2 43 30 40(5/BPI)<br />
Cr 46.2 0.0005 53.7 0.0008 0.36 2 2 30(5/BPI) 1/2<br />
Cu 2.9 0.003 23.21 0.129 0.37 2 5 10(5/BPI) 1/2<br />
Hg 274 0.00003 0.08 0.375 112.7 38 40 5(5/BPI) 1/2<br />
As 17.7 0.003 18.79 0.16 2.82 6 10 5(5/BPI) 1/2<br />
Pb 9.8 0.0003 39.8 0.0075 0.073 1 5 2(5/BPI) 1/2<br />
Zn 1 0.01 141.22 0.07 0.07 1 1 (5/BPI) 1/2<br />
a S<strong>in</strong>k factor was calculated by divid<strong>in</strong>g natural background value for mar<strong>in</strong>e water <strong>in</strong>to background<br />
value for mar<strong>in</strong>e sediment <strong>in</strong> this study <strong>and</strong> multiplied by 1000.<br />
b St i value was calculated by divid<strong>in</strong>g the correct abundance number <strong>in</strong>to element with low correct<br />
abundance (Zn = 0.07), tak<strong>in</strong>g the square root was <strong>and</strong> round<strong>in</strong>g the values.<br />
The amount <strong>of</strong> BPI measured based on the l<strong>in</strong>ear regression between ignition loss<br />
(the IG value) <strong>and</strong> the nitrogen content was equal to 3.8. The potential <strong>ecological</strong> <strong>risk</strong><br />
factors for all <strong>metals</strong> except Hg <strong>and</strong> Cd were estimated <strong>in</strong> the low potential <strong>risk</strong> values<br />
Tr i<br />
[23]
Ecological <strong>risk</strong> <strong>of</strong> <strong>heavy</strong> <strong>metals</strong> <strong>in</strong> surface sediments<br />
(Er i < 40) for all stations (Table 6). Er i value for Hg <strong>and</strong> Cd were significantly higher<br />
than for other <strong>metals</strong> <strong>and</strong> this varied between the moderate <strong>and</strong> high levels <strong>of</strong> potential<br />
<strong>ecological</strong> <strong>risk</strong> <strong>in</strong> the West Port. In this study, potential <strong>risk</strong> value for all <strong>metals</strong> ranked<br />
<strong>in</strong> the follow<strong>in</strong>g sequence Cd > Hg >As > Cr, Pb > Cu > Zn. Moreover values <strong>of</strong> RI <strong>in</strong><br />
Table 6 show that all stations are <strong>in</strong> moderate <strong>ecological</strong> <strong>risk</strong> except station WC1000,<br />
WT100 <strong>and</strong> WT1000 which are <strong>in</strong> high <strong>ecological</strong> <strong>risk</strong>.<br />
Potential <strong>ecological</strong> <strong>risk</strong> (Er i values) <strong>and</strong> <strong>risk</strong> <strong>in</strong>dices (RI values)<br />
for <strong>heavy</strong> <strong>metals</strong> <strong>in</strong> the West Port (BPI = 3.8)<br />
Table 6<br />
Station As Cu Cr Cd Pb Hg Zn RI = ∑Er i RI value<br />
1-WC100 13 0.6 3 189.5 2 86.64 0.4 295.1 moderate<br />
2-WC500 19 0.5 2 189.2 2 72.2 0.3 285.2 moderate<br />
3-WC1000 25 0.5 2 227.04 1 72.2 0.3 328.04 high<br />
4-WL100 26 0.5 2 70.95 2 86.64 0.3 188.39 moderate<br />
5-WL500 17 0.6 1 70.95 2 109.74 0.3 201.59 moderate<br />
6-WL1000 18 0.4 2 141.9 2 112.63 0.3 277.23 moderate<br />
7-WT100 34 0.4 2 236.5 2 106.85 0.4 382.15 high<br />
8-WT500 21 0.4 2 189.2 2 75.08 0.3 289.9 moderate<br />
9-WT1000 28 0.4 2 316.91 2 98.19 0.3 447.80 high<br />
Average value<br />
<strong>in</strong>side West Port<br />
22.3 0.47 2 181.35 1.88 91 0.32 299 moderate<br />
10-CP 15.4 0.32 2 29.5 1 53.4 0.25 101.87 low<br />
Regard<strong>in</strong>g the Er i value, the potential problem might have been anticipated, rather<br />
with Cd <strong>and</strong> Hg <strong>and</strong> there is no concern about other <strong>metals</strong> because the rest <strong>of</strong> the<br />
<strong>metals</strong> <strong>in</strong>vestigated gave only low potential <strong>risk</strong> factors. It should be noted that Cd <strong>and</strong><br />
Hg have rather a sediment logical toxic factor, which only <strong>in</strong>dicates that these two<br />
<strong>metals</strong> can give strong f<strong>in</strong>gerpr<strong>in</strong>ts <strong>in</strong> coastal sediments, with a high potential <strong>risk</strong><br />
factor accord<strong>in</strong>g to the high abundance pr<strong>in</strong>ciple [29, 64]. Anyway, it does not <strong>in</strong>dicate<br />
that Cd <strong>and</strong> Hg <strong>in</strong> general terms are relatively harmful environment contam<strong>in</strong>ants.<br />
The sequence <strong>of</strong> Cd <strong>and</strong> Er i values revealed some differences <strong>in</strong> the contam<strong>in</strong>ation<br />
pr<strong>of</strong>iles <strong>of</strong> <strong>metals</strong> <strong>in</strong> West Port. The results <strong>of</strong> sediment contam<strong>in</strong>ation degree <strong>in</strong>di-<br />
i<br />
cated that surface sediment is highly polluted with As (3 ≤ C f < 6) but its <strong>risk</strong> factor is<br />
22.3, which is a low potential <strong>risk</strong>. The reason for this change is related to the low<br />
sediment logical toxic factor (St i ) <strong>of</strong> As <strong>in</strong> comparison with Cd <strong>and</strong> Hg.<br />
Hakanson [23] <strong>in</strong>dicated that the toxic factor gave complex <strong>in</strong>formation about the<br />
potential transport pathways <strong>of</strong> toxic <strong>metals</strong> to humans <strong>and</strong> to the aquatic <strong>ecological</strong><br />
system. The ma<strong>in</strong> pathway <strong>in</strong> this model “goes from contam<strong>in</strong>ation <strong>of</strong> water<br />
–sediment–biota–fish–man”. The <strong>risk</strong> factor gives a different picture <strong>of</strong> contam<strong>in</strong>ation<br />
<strong>in</strong> comparison with the contam<strong>in</strong>ation factor because <strong>in</strong> the <strong>risk</strong> model toxicity <strong>of</strong> ele-<br />
151
152<br />
S.B. TAVAKOLY SANY et al.<br />
ments, the s<strong>in</strong>k effect <strong>and</strong> coastal water sensitivity are considered while the contam<strong>in</strong>ation<br />
factor is estimated only based on the concentration <strong>of</strong> elements [65].<br />
The results <strong>of</strong> the present study imply large contam<strong>in</strong>ation factors for As, Cd, Hg<br />
<strong>and</strong> Pb which <strong>in</strong>dicates the source <strong>of</strong> contam<strong>in</strong>ates, but not necessarily the <strong>ecological</strong><br />
significance <strong>of</strong> pollution. The potential <strong>risk</strong> factor analysis has been applied to dist<strong>in</strong>guish<br />
which <strong>metals</strong> should be given more attention <strong>in</strong> West Port. Hg <strong>and</strong> Cd should be<br />
given high priority while other <strong>metals</strong> – low priority.<br />
Risk <strong>in</strong>dex (RI) analysis ranked stations based on the <strong>ecological</strong> <strong>risk</strong> on biological<br />
communities <strong>in</strong> West Port. Stations WL100 <strong>and</strong> WL1000 (close to conta<strong>in</strong>er term<strong>in</strong>al)<br />
are <strong>in</strong> high <strong>ecological</strong> <strong>risk</strong> <strong>and</strong> other stations <strong>in</strong> moderate <strong>ecological</strong> <strong>risk</strong> <strong>and</strong> control<br />
station faced rare adverse effect with normal response. The results <strong>of</strong> <strong>risk</strong> <strong>in</strong>dex were<br />
synchronous with results <strong>of</strong> the degree <strong>of</strong> contam<strong>in</strong>ation.<br />
The <strong>in</strong>itial study <strong>of</strong> pollution on the west coastal waters <strong>of</strong> Pen<strong>in</strong>sular Malaysia<br />
was carried out by several research organisations <strong>in</strong> 1981, <strong>in</strong>clud<strong>in</strong>g the ASEAN (Association<br />
<strong>of</strong> Southeast Asian Nations), DOE Selangor (Department <strong>of</strong> Environment),<br />
Law <strong>and</strong> S<strong>in</strong>gh [66] <strong>and</strong> Yasar et al. [67]. Ten specific pollutants (bacteria, phenol, oil<br />
<strong>and</strong> grease contam<strong>in</strong>ation <strong>and</strong> Cd, Hg, As, Pb, Cu, Cr <strong>and</strong> nutrient concentrations)<br />
were studied to assess environmental quality. The high concentration <strong>of</strong> chemical pollution<br />
such as <strong>heavy</strong> <strong>metals</strong> <strong>in</strong> water, sediment <strong>and</strong> organisms <strong>in</strong> this area, especially<br />
level <strong>of</strong> the iron <strong>and</strong> lead were higher than the st<strong>and</strong>ard for coastal water as a consequence<br />
<strong>of</strong> the navigation <strong>and</strong> transportation, l<strong>and</strong>-based pollutants <strong>and</strong> <strong>in</strong>dustrial activities.<br />
However, these studies were not sufficient to estimate the degree <strong>of</strong> contam<strong>in</strong>ation<br />
or toxicity levels <strong>in</strong> the sediment. There is no record on the distribution <strong>of</strong><br />
<strong>heavy</strong> <strong>metals</strong> <strong>in</strong> West Port, <strong>and</strong> therefore, <strong>ecological</strong> <strong>risk</strong> assessment cannot be predicted.<br />
The results <strong>of</strong> this study are <strong>in</strong> good agreement with the idea that the sediment<br />
quality <strong>of</strong> West Port <strong>in</strong> all stations recovered. Contam<strong>in</strong>ation levels <strong>of</strong> most <strong>metals</strong><br />
(except Hg, As <strong>and</strong> Cd) from unpolluted to slightly polluted except for stations<br />
WL100 <strong>and</strong> WL1000 which are close to conta<strong>in</strong>er term<strong>in</strong>al <strong>in</strong> West Port. This result<br />
was most likely due to wastewater management regulations that were ratified <strong>in</strong> 1990<br />
<strong>and</strong> 1997 to control petrogenic <strong>and</strong> chemical contam<strong>in</strong>ants <strong>in</strong> coastal waters <strong>of</strong> Malaysia.<br />
These regulations focused on strategies that were based on <strong>in</strong>ternational agreements<br />
to prevent <strong>and</strong> control pollution from ships, platform dra<strong>in</strong><strong>in</strong>g <strong>and</strong> <strong>in</strong>dustrial<br />
<strong>in</strong>puts (MARPOL 73/78 <strong>and</strong> OPRC 1990).To some extent these regulations controlled<br />
contam<strong>in</strong>ants but were not adequate to completely recover from some toxic <strong>metals</strong><br />
because contam<strong>in</strong>ation level <strong>of</strong> toxic elements such as Hg, As <strong>and</strong> Cd were categorized<br />
from moderately to highly polluted <strong>in</strong> most sediment samples. Thus, sediments<br />
from the most polluted stations are significant sources <strong>of</strong> toxic <strong>metals</strong>. These stations<br />
were <strong>in</strong>fluenced by shipp<strong>in</strong>g activities <strong>in</strong> term<strong>in</strong>al conta<strong>in</strong>ers <strong>and</strong> <strong>in</strong>dustrial outlets <strong>in</strong><br />
the West Port which may not be under protective regulations.
Ecological <strong>risk</strong> <strong>of</strong> <strong>heavy</strong> <strong>metals</strong> <strong>in</strong> surface sediments<br />
This research is an <strong>in</strong>itial step forward from earlier studies which only considered<br />
metal concentrations <strong>in</strong> sediments based on experimental analysis, scientific model<br />
<strong>and</strong> <strong>in</strong>dices. As a matter <strong>of</strong> fact, contam<strong>in</strong>ation factor <strong>and</strong> degree <strong>of</strong> contam<strong>in</strong>ation<br />
means that a first step towards a diagnostic tool to assess the level <strong>of</strong> anthropogenic<br />
sources, <strong>risk</strong> factors <strong>and</strong> <strong>risk</strong> <strong>in</strong>dices were used as a second step to establish <strong>ecological</strong><br />
adverse effects. Due to lack <strong>of</strong> consumption rate <strong>and</strong> body level measurements for<br />
<strong>metals</strong>, human <strong>risk</strong> assessment was not carried out <strong>in</strong> this study.<br />
4. CONCLUSION<br />
The differential distribution pattern showed that multiple sources contributed to<br />
<strong>in</strong>crease the content <strong>of</strong> <strong>heavy</strong> <strong>metals</strong> <strong>in</strong> sediments along the West Port. These sources<br />
<strong>in</strong>clude a large scale <strong>in</strong>puts from the <strong>in</strong>dustrial centres such as palm oil, cement <strong>and</strong><br />
food manufacturers that are located <strong>in</strong> the vic<strong>in</strong>ity <strong>of</strong> West Port, vessel-based discharges,<br />
l<strong>and</strong> run<strong>of</strong>f, sedimentation, <strong>and</strong> siltation. This study also showed that f<strong>in</strong>e<br />
gra<strong>in</strong> sized sediments <strong>and</strong> TOC have synergic effect on the distribution <strong>of</strong> <strong>heavy</strong> <strong>metals</strong>,<br />
especially Cd <strong>and</strong> Hg. In general terms, <strong>heavy</strong> metal pollution <strong>in</strong> West Port is<br />
moderate but large <strong>risk</strong> <strong>in</strong>dices were estimated for Hg <strong>and</strong> Cd. Thus these <strong>metals</strong> need<br />
more attention. Pollution from As, Pb <strong>and</strong> Cr may be given low priority. High level<br />
pollution <strong>of</strong> Hg <strong>and</strong> Cd is a serious threat <strong>in</strong> future because <strong>of</strong> their accumulation <strong>and</strong><br />
toxicity effects on mar<strong>in</strong>e organisms <strong>and</strong> the human population. Risk model clarified<br />
the vulnerable stations (WT100, WT1000 <strong>and</strong> WC100) hav<strong>in</strong>g data to manage <strong>and</strong><br />
protect West Port coastal waters. This will be <strong>of</strong> immense value to the Department <strong>of</strong><br />
Environment <strong>of</strong> Malaysia <strong>in</strong> its quest to take corrective measures. The present study<br />
emphasizes the importance <strong>of</strong> proactive measures to manage <strong>and</strong> control pollution <strong>in</strong><br />
the West Port coastal waters because there is no recent data on pollutants <strong>in</strong> this area.<br />
Thus the results <strong>of</strong> this study can be used as background data for future studies. In<br />
addition, the results imply that further management policies <strong>and</strong> mechanisms are<br />
needed to ensure the implementation <strong>of</strong> regulations. Mechanisms may <strong>in</strong>clude permit<br />
programs, bad actor laws, zon<strong>in</strong>g, enforceable general environmental laws <strong>and</strong> prohibitions<br />
<strong>and</strong> water quality st<strong>and</strong>ards.<br />
ACKNOWLEDGEMENT<br />
The authors express their gratitude for support <strong>of</strong> University Malaya Research Grunt (UMRG) with<br />
project No. RG174-12SUS <strong>and</strong> University Malaya Postgraduate Research Grant (PPP).<br />
REFERENCES<br />
[1] CHAPMAN P.M., Sci. Total. Environ., 2002, 288 (1-2), 131.<br />
[2] NENDZA M., Chemosphere, 2002, 48 (8), 865.<br />
153
154<br />
S.B. TAVAKOLY SANY et al.<br />
[3] MORALES-CASELLES C., KALMAN J., RIBA I., DELVALLS T., Environ. Pollut., 2007, 146 (1), 233.<br />
[4] PREUSS T.G., HOMMEN U., ALIX A., ASHAUER R., VAN DEN BRINK P., CHAPMAN P., DUCROT V.,<br />
FORBES V., GRIMM V., SCHÄFER D., Environ. Sci. Pollut. R., 2009, 16 (3), 250.<br />
[5] TARIQUE Q., An evaluation <strong>of</strong> clam amiantis umbonella (bivalve) as a bio-<strong>in</strong>dicator <strong>of</strong> <strong>heavy</strong> metal<br />
pollution <strong>in</strong> Kuwait mar<strong>in</strong>e coastal waters, Rutgers University, Graduate School, New Brunswick,<br />
2008.<br />
[6] SHULKIN V., PRESLEY B., Environ. Int., 2003, 29 (4), 493.<br />
[7] LIU C., LUO C., GAO Y., LI F., LIN L., WU C., LI X., Environ. Pollut., 2010, 158 (3), 820.<br />
[8] World Bank, Cost <strong>of</strong> pollution <strong>in</strong> Ch<strong>in</strong>a: economic estimates <strong>of</strong> physical damage, 2007, 2.<br />
[9] FANG J., WANG K., TANG J., WANG M., REN S., WU H.,WANG J., B. Environ. Contam. Toxicol., 2004,<br />
73 (3), 583.<br />
[10] WANG W.X., YAN Q.L., FAN W., XU Y., Mar. Ecol. Prog. Ser., 2002, 240, 27.<br />
[11] PAN K., WANG W.X., Sci. Total. Environ., 2011.<br />
[12] ISLAM M.S., TANAKA M., Mar<strong>in</strong>. Pollut. Bull., 2004, 48, 624.<br />
[13] BELLOS D., SAWIDIS T., J. Environ. Manage., 2005, 76 (4), 282.<br />
[14] KENNISH M., Rev. Environ. Contam. Toxicol., 1997, 253.<br />
[15] SKORBIŁOWICZ M., SKORBIŁOWICZ E., Env. Prot. Eng., 2009, 35 (3), 279.<br />
[16] LEHR J., KEELEY J., Oceanography, Meteorology, Physics <strong>and</strong> Chemistry, Water Law <strong>and</strong> Water<br />
History, Art <strong>and</strong> Culture, Wiley, 2005.<br />
[17] LING T.S., Civil Environ. Manage., 2007, 102.<br />
[18] U.S. EPA, Contam<strong>in</strong>ation sediment science priorities, Prepared for U.S. Environmental Protection<br />
Agency by Members <strong>of</strong> the Contam<strong>in</strong>ated Sediments Science Priorities Workgroup, 2004, 172.<br />
[19] SASEKUMAR A., CHONG V.C., Ecology <strong>of</strong> Klang Strait, Faculty <strong>of</strong> Science <strong>of</strong> University <strong>of</strong> Malaya,<br />
Kuala Lumpur, 2005.<br />
[20] FANG T.H., HONG E., Mar<strong>in</strong>. Pollut. Bull., 1999, 38 (11), 1026.<br />
[21] VAN VALINE S.P., MORSE B.J., Techniques <strong>in</strong> soil analysis, [<strong>in</strong>:] Procedures <strong>of</strong> Soil Analysis, Blackwell<br />
Scientific Publications, Oxford, 2003.<br />
[22] IDEM, Indiana waste water laboratories, 2002, 91, 20.<br />
[23] HAKANSON L., Water. Res., 1979, 975.<br />
[24] SUTHERS I.M., RISSIK D., Plankton. A guide to their ecology <strong>and</strong> monitor<strong>in</strong>g for water quality, Csiro,<br />
2009.<br />
[25] KRUPADAM R., SMITA P., WATE S., Geochem. J., 2006, 40 (5), 513.<br />
[26] ABRAHIM G.M.S., PARKER R., Environ. Monit. Assess., 2008, 136 (1), 227.<br />
[27] MA W.B., WANG F., ZHAI Q., YANG X., ZHOU Y., ZHOU W.B., Adv. Mater. R., 2012, 414, 262.<br />
[28] TAVAKOLY SANY S.B., SALLEH A., SULAIMAN A.B., MEHDINIA A., MONAZAMI G., Geochemical<br />
Assessment <strong>of</strong> Heavy Metals Concentration <strong>in</strong> Surface Sediment <strong>of</strong> West Port, Malaysia, World<br />
Academy <strong>of</strong> Science, Eng<strong>in</strong>eer<strong>in</strong>g <strong>and</strong> Technology, 2011, 83.<br />
[29] HÅKANSON L., JASSON M., Pr<strong>in</strong>ciples <strong>of</strong> Lake Sedimentology, Spr<strong>in</strong>ger, Berl<strong>in</strong>, 1983.<br />
[30] LUO W., LU Y., WANG T., HU W., JIAO W., NAILE J.E., KHIM J.S., GIESY J.P., J. Hum. Environ., 2010,<br />
39 (5), 367.<br />
[31] MENG Q.F., YANG J.S., YAO R.J., LI D.S., ZHANG C.Y., J. Agr. Environ. Sci., 2011, 30 (11), 2249.<br />
[32] TAVAKOLY SANY S.B., SULAIMAN A.B., MONAZAMI G., SALLEH A., Assessment <strong>of</strong> Sediment Quality<br />
Accord<strong>in</strong>g To Heavy Metal Status <strong>in</strong> the West Port <strong>of</strong> Malaysia, World Academy <strong>of</strong> Sciences, Eng<strong>in</strong>eer<strong>in</strong>g<br />
<strong>and</strong> Technology, 2011, 633.<br />
[33] WOODROFFE C., Tropical Mangrove Ecosystems, Amer. Geophysical Union, 1992, 7.<br />
[34] WOLANSKI E., MAZDA Y., RIDD P., Tropical Mangrove Ecosystems, Amer. Geophysical Union, 1992, 43.<br />
[35] FURUKAWA K., WOLANSKI E., MUELLER H., Estuar. Coast. Shelf. S., 1997, 44 (3), 301.<br />
[36] KATHIRESAN K., Rev. Biol. Trop., 2003, 51 (2), 355.
Ecological <strong>risk</strong> <strong>of</strong> <strong>heavy</strong> <strong>metals</strong> <strong>in</strong> surface sediments<br />
[37] CUNHA-LIGNON M., COELHO JR C., ALMEIDA R., MENGHINI R., CORREA F., SCHAEFFER-NOVELLI Y.,<br />
CINTRÓN-MOLERO G., J. Coast. Res. (Special Issue), 2009, 56.<br />
[38] TAM N.F.Y., YS W., Environ. Pollut., 2000 (110), 195.<br />
[39] OLUBUNMI F.E., OLORUNSOLA E.O., Europ. J. Sci. Res., 2010, 41 (3), 373.<br />
[40] KE PAN., WANG W.X., Sci. Total. Environ., 2011.<br />
[41] NOBI E., DILIPAN E., THANGARADJOU T., SIVAKUMAR K., KANNAN L., Estuar. Coast. Shelf. S., 2010,<br />
87 (2), 253.<br />
[42] VALLEJUELO S.F.-O.D., ARANA G., DIEGE A.D., MADARIAGA J.M., J. Hazard. Mater., 2010, (181), 565.<br />
[43] ZHANG W., FENG H., CHANG J., QU J., XIE H., YU L., Environ. Pollut., 2009, 157 (5), 1533.<br />
[44] SIDDIQUE A., MUMTAZ M., ZAIGHAM N.A., MALLICK K.A., SAIED S., ZAHIR E., KHWAJA H.A., Mar<strong>in</strong>.<br />
Pollut. Bull., 2009, 58 (9), 1406.<br />
[45] NAJI A., ISMAIL A., ISMAIL A.R., Microchem. J., 2010, 95 (2), 285.<br />
[46] LIJKLEMA L., KOELMANS A., PORTIELJE R., Water. Sci. Technol., 1993, 28 (8–9), 1.<br />
[47] ABRAHIM G.M.S., PARKER R., NICHOL S., Environ. Geol., 2007, 52 (7), 1315.<br />
[48] LACERDA L.D., ISME. Mangrov. Ecosys. Occasional Pap., 1998, 2, 1.<br />
[49] RANJAN R.K., RAMANATHAN A., SINGH G., CHIDAMBARAM S., Environ. Monit. Assess., 2008, 147<br />
(1), 389.<br />
[50] SHRIADAH M., Water, Air, Soil Poll., 1999, 116 (3), 523.<br />
[51] HÜBNER R., ASTIN K.B., HERBERT R.J.H., J. Environ. Monit., 2009, 11 (4), 713.<br />
[52] PRAVEENA S.M., RADOJEVIC M., ABDULLAH M.H., ARIS A.Z., Iranian J. Environ. Health Sci. Eng.,<br />
2008, 5 (1).<br />
[53] WANG X., QIN Y., Environ. Geol., 2006, 49 (6), 905.<br />
[54] FISHBEIN L., Environ. Health. Persp., 1981, 40, 43.<br />
[55] SRIKANTH R., RAO A.M., KUMAR C.H.S., KHANUM A., Rev. Environ. Contam. Toxicol., 1993, 50 (1), 138.<br />
[56] YASAR D., AKSU A., USLU O., Turk. J. Eng. Environ. Sci., 2001, 25, 299.<br />
[57] JENNINGS J., RAINBOW P., Mar. Biol., 1979, 50 (2), 131.<br />
[58] COSSA D., RADAKOVITCH O., BOULOUBASSI I., BANCON-MONTIGNY C., CADIOU J., CHARMASSON S.,<br />
DACHS J., ELBAZ-POULICHET F., FOWLER S., GONZALEZ J., Influence <strong>of</strong> chemical contam<strong>in</strong>ation, The<br />
MERMEX Group, 2010, 47.<br />
[59] DAVIS H.T., MARJORIE AELION C., MCDERMOTT S., LAWSON A.B., Environ. Pollut., 2009, 157 (8–9),<br />
2378.<br />
[60] ZHANG H., CUI B., XIAO R., ZHAO H., Proc. Environ. Sci., 2010, 2, 1344.<br />
[61] Technical guidance for screen<strong>in</strong>g contam<strong>in</strong>ated sediments, New York State Department <strong>of</strong> Environmental<br />
Conservation, Division <strong>of</strong> Fish <strong>and</strong> Wildlife <strong>and</strong> the Division <strong>of</strong> Mar<strong>in</strong>e Resources,<br />
New York, November 22, 1993<br />
[62] Compilation <strong>of</strong> Sediment Quality Guidel<strong>in</strong>es for EPA Region 5 Inventory <strong>of</strong> Contam<strong>in</strong>ated Sediment<br />
Sites, Science Applications International Corporation, United States. Environmental Protection<br />
Agency. Region V, Science Applications International Corporation, 1991.<br />
[63] Thail<strong>and</strong> Mar<strong>in</strong>e Water Quality St<strong>and</strong>ard, Mar<strong>in</strong>e Environment Division Water Quality Manage-<br />
ment Bureau Pollution Control Department M<strong>in</strong>istry <strong>of</strong> Natural Resources <strong>and</strong> Environment, Phahon<br />
Yoth<strong>in</strong> Rd. Phayathai, Bangkok 10400, Thail<strong>and</strong>, 2005.<br />
[64] WANG J., CHEN S., XIA T., Proc. Environ. Sci., 2010, 2, 1632.<br />
[65] HAKANSON L., BLENCKNER T., Ocean. Coast. Manage., 2008, 51 (1), 43.<br />
[66] LAW A.T., SINGH A., Malay. Nat. J., 1988, 41, 505.<br />
[67] YASAR D., AKSU A.,USLU, O., Turk. J. Eng<strong>in</strong>. Environ. Sci., 2001, 25, 299.<br />
155