Evaluation of nuisance of odour from food industry - Environment ...
Evaluation of nuisance of odour from food industry - Environment ...
Evaluation of nuisance of odour from food industry - Environment ...

You also want an ePaper? Increase the reach of your titles
YUMPU automatically turns print PDFs into web optimized ePapers that Google loves.
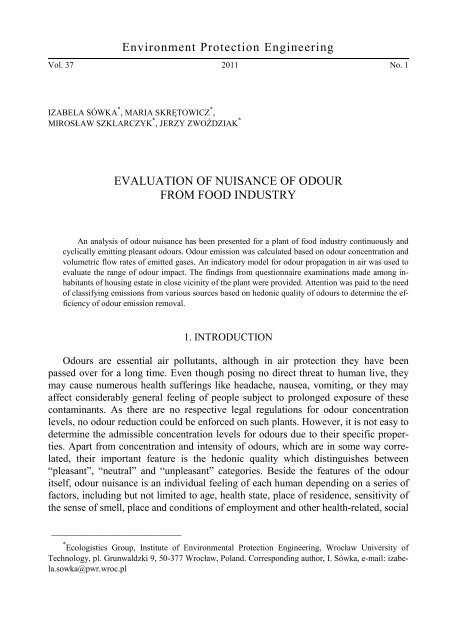
<strong>Environment</strong> Protection Engineering<br />
Vol. 37 2011 No. 1<br />
IZABELA SÓWKA * , MARIA SKRĘTOWICZ * ,<br />
MIROSŁAW SZKLARCZYK * , JERZY ZWOŹDZIAK *<br />
EVALUATION OF NUISANCE OF ODOUR<br />
FROM FOOD INDUSTRY<br />
An analysis <strong>of</strong> <strong>odour</strong> <strong>nuisance</strong> has been presented for a plant <strong>of</strong> <strong>food</strong> <strong>industry</strong> continuously and<br />
cyclically emitting pleasant <strong>odour</strong>s. Odour emission was calculated based on <strong>odour</strong> concentration and<br />
volumetric flow rates <strong>of</strong> emitted gases. An indicatory model for <strong>odour</strong> propagation in air was used to<br />
evaluate the range <strong>of</strong> <strong>odour</strong> impact. The findings <strong>from</strong> questionnaire examinations made among inhabitants<br />
<strong>of</strong> housing estate in close vicinity <strong>of</strong> the plant were provided. Attention was paid to the need<br />
<strong>of</strong> classifying emissions <strong>from</strong> various sources based on hedonic quality <strong>of</strong> <strong>odour</strong>s to determine the efficiency<br />
<strong>of</strong> <strong>odour</strong> emission removal.<br />
1. INTRODUCTION<br />
Odours are essential air pollutants, although in air protection they have been<br />
passed over for a long time. Even though posing no direct threat to human live, they<br />
may cause numerous health sufferings like headache, nausea, vomiting, or they may<br />
affect considerably general feeling <strong>of</strong> people subject to prolonged exposure <strong>of</strong> these<br />
contaminants. As there are no respective legal regulations for <strong>odour</strong> concentration<br />
levels, no <strong>odour</strong> reduction could be enforced on such plants. However, it is not easy to<br />
determine the admissible concentration levels for <strong>odour</strong>s due to their specific properties.<br />
Apart <strong>from</strong> concentration and intensity <strong>of</strong> <strong>odour</strong>s, which are in some way correlated,<br />
their important feature is the hedonic quality which distinguishes between<br />
“pleasant”, “neutral” and “unpleasant” categories. Beside the features <strong>of</strong> the <strong>odour</strong><br />
itself, <strong>odour</strong> <strong>nuisance</strong> is an individual feeling <strong>of</strong> each human depending on a series <strong>of</strong><br />
factors, including but not limited to age, health state, place <strong>of</strong> residence, sensitivity <strong>of</strong><br />
the sense <strong>of</strong> smell, place and conditions <strong>of</strong> employment and other health-related, social<br />
_________________________<br />
* Ecologistics Group, Institute <strong>of</strong> <strong>Environment</strong>al Protection Engineering, Wrocław University <strong>of</strong><br />
Technology, pl. Grunwaldzki 9, 50-377 Wrocław, Poland. Corresponding author, I. Sówka, e-mail: izabela.sowka@pwr.wroc.pl
6<br />
I. SÓWKA et al.<br />
and psychological aspects. Obviously, the time <strong>of</strong> exposure is also an important factor<br />
deciding on the <strong>odour</strong> <strong>nuisance</strong>.<br />
In popular opinion, <strong>odour</strong> <strong>nuisance</strong> is associated with emission <strong>of</strong> unpleasant<br />
<strong>odour</strong>s. As opposed to such circumstances, a plant was selected <strong>from</strong> <strong>food</strong>/biscuit<br />
<strong>industry</strong> due to its specific <strong>odour</strong>s generated. Three operating process lines have been<br />
installed in the plant. Continuous baking is run in two daytime shifts. Hence, <strong>odour</strong><br />
emission to atmosphere varies cyclically. The emission lasts about 12 hours and its<br />
intensity is virtually invariable. It should be emphasized that the <strong>odour</strong>s emitted are<br />
considered to be pleasant. On account <strong>of</strong> this, the question arises if the <strong>odour</strong>s generated<br />
<strong>from</strong> such a process could cause a significant <strong>nuisance</strong> and if such plants should<br />
be treated on a par with those generating unpleasant <strong>odour</strong>s.<br />
As a part <strong>of</strong> examining the plant’s influence on olfactory quality <strong>of</strong> air, <strong>odour</strong><br />
emissions were determined on the grounds <strong>of</strong> known <strong>odour</strong> concentrations and<br />
streams <strong>of</strong> gases. Odour concentrations were determined by the dynamic olfactometry<br />
method. Two methods were used to evaluate the influence <strong>of</strong> the plant on the surroundings:<br />
(i) by means <strong>of</strong> calculations using indicatory model and (ii) by questionnaire<br />
examinations among inhabitants <strong>of</strong> nearby housing estate. This allowed one to<br />
assess the range <strong>of</strong> pollutants generated by the plant and whether its activity causes<br />
considerable <strong>odour</strong> <strong>nuisance</strong> for local population.<br />
2. PROFILE OF THE PLANT INCLUDING MAIN ODOUR SOURCES<br />
The plant is situated in a ca. 50 thousand inhabitant town close to a large residential<br />
estate. The main products <strong>of</strong> the plant are biscuits and wafers. The plant is operated<br />
each day <strong>from</strong> Monday to Friday. There is no constant baking time schedule. The<br />
range <strong>of</strong> baked products is mainly dependent on the orders <strong>from</strong> customers. Only wafers<br />
are constantly baked each day. Baking <strong>of</strong> biscuits is a high-temperature process in<br />
the range <strong>of</strong> 150–220 °C and the main components are: wheat flour, sugar, eggs, vegetable<br />
fat, raising agents and essences which are to give proper flavour and smell to<br />
finished products [1, 2].<br />
Based on the analysis <strong>of</strong> the baking process, two main reasons <strong>of</strong> <strong>odour</strong> emission<br />
can be distinguished:<br />
• high temperature <strong>of</strong> processes used for components included in products,<br />
• addition <strong>of</strong> <strong>food</strong> essences.<br />
3. OLFACTOMETRIC EXAMINATIONS AND CALCULATION OF ODOUR<br />
Olfactometric determinations were made to assess the emission <strong>of</strong> the plant. After<br />
visiting the the plant, following arrangements made with its representative, six sam-
Odour <strong>nuisance</strong> <strong>from</strong> <strong>food</strong> <strong>industry</strong> 7<br />
pling points were selected (covered ro<strong>of</strong> emitters). Their locations are shown in Fig. 1<br />
while the specifications are summarized in Table 1.<br />
Fig. 1. Distribution <strong>of</strong> sampling points <strong>of</strong> <strong>odour</strong> gases:<br />
line A – Wyborowe biscuits with sugar, line B – Petit Beurre biscuits,<br />
line C – inactive line, line D – waffles<br />
Characteristics <strong>of</strong> the emitters<br />
Table 1<br />
Emitter Technological<br />
line<br />
Product<br />
Gas Inner Gas stream<br />
temperaturediameter<br />
φ at 293K<br />
[K] [mm] [m 3 ·s –1 ]<br />
1<br />
2<br />
B<br />
D<br />
Petit Beurre biscuits<br />
Waffles<br />
332<br />
398<br />
500<br />
3.0<br />
3.4<br />
3 B Petit Beurre biscuits 423<br />
2.2<br />
4 A Wyborowe biscuits with sugar 360 250 0.13<br />
5 A Wyborowe biscuits with sugar 384.5 0.13<br />
6 hall ventilation − 298 − 2,8<br />
Four emitters under investigation were provided with ventilators (points 1 and 3 on<br />
the technological line B in Fig. 1, point 2 on line D and point 6 at the hall ventilation<br />
outlet). The two remaining emitters (points 4 and 5 on line A) operated on the principle<br />
<strong>of</strong> natural ventilation. Three gas samples were taken <strong>from</strong> each emitter. In total,
8<br />
I. SÓWKA et al.<br />
18 samples were collected in the plant. Olfactometric analyses <strong>of</strong> the samples were<br />
carried out on the day <strong>of</strong> sampling following the method given in the Standard PN-EN<br />
13725 [3].<br />
The measured values <strong>of</strong> <strong>odour</strong> concentrations, expressed in European <strong>odour</strong> units<br />
per cubic meter, (ouE·m –3 ), are shown in Fig. 2. Determinations were made at the ambient<br />
temperature in the olfactometric laboratory (293 K).<br />
Fig. 2. Average <strong>odour</strong> concentrations and emission values<br />
The rate <strong>of</strong> the <strong>odour</strong> emission, given in European <strong>odour</strong> units per second (ouE·s –1 )<br />
was determined based on the values <strong>of</strong> <strong>odour</strong> concentration and volumetric flow rates<br />
<strong>of</strong> emitted gases, in a similar way as for standard atmosphere pollutants. Measurements<br />
<strong>of</strong> volumetric flow rates using an anemometer were impossible due to lack <strong>of</strong><br />
appropriate fixture branches to emitters, excessive temperature <strong>of</strong> gases and, in the<br />
case <strong>of</strong> emitters 4 and 5, due to natural ventilation applied. Hence, flow rates <strong>of</strong> gases<br />
discharged <strong>from</strong> emitters 1–3 and 6 were estimated using specifications <strong>of</strong> installed<br />
ro<strong>of</strong> ventilators; in the case <strong>of</strong> emitters 4 and 5, volumetric streams were estimated<br />
<strong>from</strong> differences <strong>of</strong> temperatures (and densities) <strong>of</strong> waste gases and ambient air. Gas<br />
streams determined for all emitters were given at 293 K, i.e. at the temperature at<br />
which the <strong>odour</strong> concentrations were found. The results <strong>of</strong> calculations for <strong>odour</strong><br />
emissions are shown in Fig. 2.<br />
Figure 2 indicates that the highest <strong>odour</strong> concentrations were measured at points 3 and<br />
4 (process lines B and A); quite large rates were also at point 2 on line D, i.e. on the wafer<br />
baking line, and in point 5 on line A. Calculations for emissions showed that the highest<br />
<strong>odour</strong> emission is observed for emitter 4, while emission <strong>of</strong> the emitter 5 is very low despite<br />
high concentration. It is due to natural ventilation applied; the gas stream is <strong>of</strong> one<br />
order <strong>of</strong> magnitude lower than that for mechanical ventilation. Significant emission was<br />
also noted <strong>from</strong> emitter 2 (wafer baking) caused by both high concentration <strong>of</strong> <strong>odour</strong>s and<br />
high nominal capacity <strong>of</strong> the ventilator at the emitter.
Odour <strong>nuisance</strong> <strong>from</strong> <strong>food</strong> <strong>industry</strong> 9<br />
4. EVALUATION OF ODOUR IMPACT RANGE AND ODOUR NUISANCE<br />
The influence range <strong>of</strong> <strong>odour</strong>s emitted <strong>from</strong> the plant was calculated based on the<br />
indicatory model <strong>of</strong> <strong>odour</strong> dispersion. Odour <strong>nuisance</strong> was estimated by means <strong>of</strong><br />
questionnaire examinations. Calculations could also be made using the Pasquille formula,<br />
however no such accurate calculations are necessary to assess only the range <strong>of</strong><br />
<strong>odour</strong>.<br />
Results <strong>of</strong> calculation for indicatory model are given as <strong>odour</strong> concentrations<br />
(Sr [ouE·m –3 ]) at a given distance x [m] <strong>from</strong> the source for various wind velocities<br />
u [m·s –1 ]) [4]:<br />
7E<br />
Sr<br />
= 2<br />
ux<br />
where E [ouE·s –1 ] denotes <strong>odour</strong> emissions. The results <strong>of</strong> calculations are summarized<br />
in Table 2.<br />
Table 2<br />
S r values [ou E] obtained <strong>from</strong> calculations<br />
with using the indicator model<br />
u<br />
[m·s –1 ]<br />
x [m]<br />
100 150 200 500 1000<br />
0.5 40.4 17.9 10.1 1.6 0.40<br />
1 20.2 9.0 5.0 0.8 0.20<br />
2 10.1 4.5 2.5 0.4 0.10<br />
3 6.7 3.0 1.7 0.3 0.07<br />
4 5.0 2.2 1.3 0.2 0.05<br />
5 4.0 1.8 1.0 0.2 0.04<br />
6 3.4 1.5 0.8 0.1 0.03<br />
7 2.9 1.3 0.7 0.1 0.03<br />
8 2.5 1.1 0.6 0.1 0.03<br />
9 2.2 1.0 0.6 0.1 0.02<br />
10 2.0 0.9 0.5 0.1 0.02<br />
Results <strong>of</strong> calculations given in Table 2 show that <strong>odour</strong>s can affect surroundings<br />
within as much radius as even 500 m (Sr > 1 ouE·m –3 ) [5]. Hence, conclusion may be<br />
drawn that emission should be reduced. However, an important fact is that these<br />
<strong>odour</strong>s are classified as pleasant ones. On account <strong>of</strong> that, can the plant be an essential<br />
source <strong>of</strong> <strong>odour</strong> <strong>nuisance</strong>? The answer to the question should be verified by the results<br />
<strong>of</strong> field inspections and/or surveys in accordance with the methods used in European<br />
countries and currently being developed in Poland [6–12].
10<br />
I. SÓWKA et al.<br />
In the presented work, questionnaire examinations <strong>of</strong> <strong>odour</strong> <strong>nuisance</strong> were used to determine<br />
the influence <strong>of</strong> <strong>odour</strong> emission <strong>from</strong> a plant on the <strong>odour</strong> quality <strong>of</strong> air in its surroundings.<br />
The area <strong>of</strong> examinations was delimited <strong>from</strong> calculations <strong>of</strong> the <strong>odour</strong> range,<br />
and also <strong>from</strong> spatial development and topography <strong>of</strong> the area around the plant. The<br />
method given in VDI 3883 [6] was used conduct a survey on <strong>odour</strong> <strong>nuisance</strong> among people<br />
living near the plant. Data were collected in interviews with residents by trained personnel.<br />
Attempts were made to contact with 164 people, however no more than 58 questionnaires<br />
were obtained, i.e. ca. 35% (Table 3).<br />
Zone<br />
Net sample<br />
size, n<br />
Sample size <strong>of</strong> conducted surveys<br />
Gross sample<br />
size, N<br />
No tenant<br />
Survey missed<br />
Table 3<br />
Refuse to<br />
answer<br />
1 + 2 58 164 75 31<br />
The questionnaire contained ten questions referring to reaction to the environmental<br />
state, arduousness <strong>of</strong> pollution and socio-demographic aspects. Respondents<br />
were also asked about their personal data, such as age, education level and distance<br />
between place <strong>of</strong> work and place <strong>of</strong> residence [6].<br />
Fig. 3. Odour <strong>nuisance</strong> indicated by the respondents on the thermometer scale<br />
In the questionnaire, the most important questions were those about evaluation <strong>of</strong> annoyance<br />
in thermometer and in verbal scales. Respondents were asked to identify the<br />
<strong>odour</strong> <strong>nuisance</strong> by the number on a scale <strong>of</strong> 1 to 10. The results are shown in Fig. 3.<br />
Based on questionnaire examinations, a conclusion might be drawn that the plant<br />
represents an essential <strong>odour</strong> <strong>nuisance</strong>. However, in further question respondents are<br />
asked to point out the source or the nature <strong>of</strong> the <strong>odour</strong>. This question allows one to
Odour <strong>nuisance</strong> <strong>from</strong> <strong>food</strong> <strong>industry</strong> 11<br />
determine whether the plant under examinations is in fact the source <strong>of</strong> <strong>nuisance</strong>, or<br />
there is another factor nearby which deteriorates the <strong>odour</strong> quality <strong>of</strong> air in the area<br />
(Fig. 4).<br />
Fig. 4. Odour sources indicated<br />
by the respondents<br />
As results <strong>from</strong> Figure 4, as a source <strong>of</strong> <strong>odour</strong> the plant is indicated by as low as<br />
24% <strong>of</strong> people polled, whereas 50% indications referred to municipal management<br />
and exhaust gases. It should be also stressed that there is municipal sewage treatment<br />
plant located about 1.3 km to the east, and a national road leading to motorway is running<br />
300 m <strong>from</strong> the plant.<br />
Additionally, the questionnaires were split into: (i) those made in two residential<br />
buildings situated at the shortest distance <strong>from</strong> the plant, and what is worth mentioning<br />
– being high multifamily apartments, and (ii) those made in buildings located at larger<br />
distances within the area covered by questionnaire. Such division allowed one to determine<br />
where<strong>from</strong> are the highest percentage <strong>of</strong> indications to the plant. The closest<br />
buildings shared 71% <strong>of</strong> all indications to the plant.<br />
The questionnaire examinations have also shown that <strong>odour</strong>s <strong>from</strong> the plant, however<br />
quite perceptible, are not bothersome for local people. The smells were generally<br />
described as sweet, vanilla, chocolate-like and were included into pleasant smells and,<br />
in quite large <strong>of</strong> cases, as those which do not deteriorate life quality among respondents.<br />
5. SUMMARY<br />
The main reasons for <strong>odour</strong> emission in cake-production <strong>industry</strong> are high baking<br />
temperature and flavours added to enhance taste and smell values <strong>of</strong> finished products.<br />
Odour emission <strong>from</strong> selected emitters, calculated <strong>from</strong> <strong>odour</strong> concentrations as<br />
measured by the dynamic olfactometry method and <strong>from</strong> estimations <strong>of</strong> gas volumetric<br />
streams, is quite large and can be significant in plant surroundings, as was confirmed<br />
by approximate calculations using an indicatory model.<br />
The results <strong>from</strong> questionnaire examinations were divided into those obtained <strong>from</strong><br />
successful questionnaires <strong>from</strong> respondents living in two high apartment blocks situated<br />
ca. 100 m to the north <strong>of</strong> the plant and those for the rest <strong>of</strong> polled area. Conse-
12<br />
I. SÓWKA et al.<br />
quently, a conclusion may be drawn that these blocks represented some kind <strong>of</strong><br />
screens greatly hindering dispersion <strong>of</strong> <strong>odour</strong>s into the housing estate. Only the occupants<br />
<strong>of</strong> these blocks were those who complained about arduousness <strong>of</strong> <strong>odour</strong>s <strong>from</strong><br />
the plant due to their intensity, <strong>of</strong>ten describing them as nauseous.<br />
Based on the evaluation made for <strong>odour</strong> impact <strong>of</strong> source emitting <strong>odour</strong>s perceived<br />
as pleasant ones, a proposal could be made to take into account, while preparing<br />
legal regulations on <strong>odour</strong> emission, the branch <strong>of</strong> <strong>industry</strong> to which belong the<br />
plant investigated, the kind <strong>of</strong> production and its parameters. This would permit to<br />
reduce serious <strong>odour</strong> <strong>nuisance</strong> effectively, while not exposing such plants, generating<br />
pleasant smells which cause no essential change in life quality <strong>of</strong> local people, to the<br />
risk <strong>of</strong> losses.<br />
ACKNOWLEDGEMENTS<br />
Presented work was done in the frame <strong>of</strong> the Project No. PBZ-MEiN-5/2/2006: New methods and<br />
technologies <strong>of</strong> deodorization in <strong>industry</strong>, agriculture and municipal management.<br />
REFERENCES<br />
[1] AMBROZIAK Z., Bakery-cake manufacturing, Part 2, WSiP, Warsaw, 1999 (in Polish).<br />
[2] DOJUTREK CZ., PIETRZYK A., Cake products, WNT, Warsaw, 1977 (in Polish).<br />
[3] PN-EN 13725. Air quality. Determination <strong>of</strong> <strong>odour</strong> concentration by the dynamic olfactometry method,<br />
2000 (in Polish)7.<br />
[4] KOŚMIDER J., MAZUR-CHRZANOWSKA B., WYSZYŃSKI B., Odours, PWN, Warsaw, 2002.<br />
[5] Draft <strong>of</strong> Law act against <strong>odour</strong> <strong>nuisance</strong>, 17.10.2008 (in Polish).<br />
[6] VDI 3883, Part I. Effects and assessment <strong>of</strong> <strong>odour</strong>s. Psychometric assessment <strong>of</strong> <strong>odour</strong> annoyance.<br />
Questionnaires, Verein Deutscher Ingenieure, Berlin, Beuth Verlag, 1997.<br />
[7] VDI 3940, B. 2, Measurement <strong>of</strong> <strong>odour</strong> impact by field inspection. Measurement <strong>of</strong> the impact frequency<br />
<strong>of</strong> recognizable <strong>odour</strong>s. Plume measurement, Verein Deutscher Ingenieure, Berlin, Beuth<br />
Verlag, 2006.<br />
[8] VDI 3940 B. 3 (Draft). Measurement <strong>of</strong> <strong>odour</strong> in ambient air by field inspections. Determination <strong>of</strong><br />
<strong>odour</strong> intensity and hedonic <strong>odour</strong> tone, Verein Deutscher Ingenieure, Berlin, Beuth Verlag, 2008.<br />
[9] VDI 3940 B. 4 (Draft): Determination <strong>of</strong> the hedonic <strong>odour</strong> tone. Polarity pr<strong>of</strong>iles, Verein Deutscher<br />
Ingenieure, Berlin, Beuth Verlag, 2008.<br />
[10] SÓWKA I., ZWOŹDZIAK J., NYCH A., SZKLARCZYK M., SKRĘTOWICZ M., ZWOŹDZIAK P., The use <strong>of</strong><br />
surveys to determine the <strong>odour</strong> <strong>nuisance</strong> in the areas adjacent to industrial sources <strong>of</strong> <strong>odour</strong> emissions,<br />
Przemysł Chemiczny, 2010, 89 (4), 546 (in Polish).<br />
[11] SÓWKA I., Environ. Prot. Eng., 2010, 36 (5),135.<br />
[12] KULIG A., LELICIŃSKA-SERAFIN K., PRZEDWORNA J., SINICYN G., HEIDRICH Z., CZYŻKOWSKI B.,<br />
Based on surveys characteristics and impact assessment <strong>of</strong> olfactory odorant sources <strong>of</strong> sewage and<br />
waste economy in Poland, Chemik, 2009, 11, 414 (in Polish).