Press release - BNP Paribas
Press release - BNP Paribas
Press release - BNP Paribas

You also want an ePaper? Increase the reach of your titles
YUMPU automatically turns print PDFs into web optimized ePapers that Google loves.
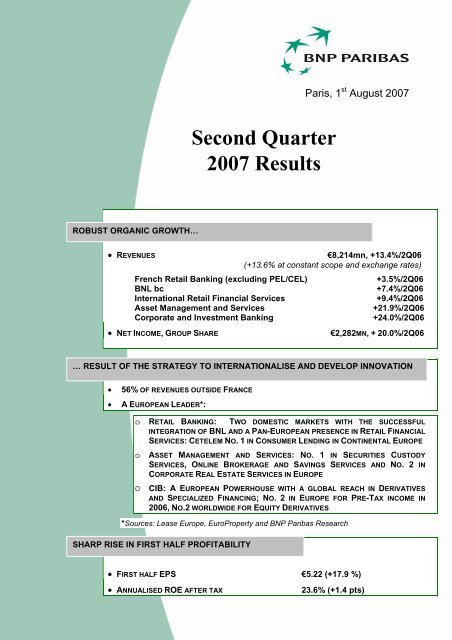
ROBUST ORGANIC GROWTH…<br />
Second Quarter<br />
2007 Results<br />
Paris, 1 st August 2007<br />
• REVENUES €8,214mn, +13.4%/2Q06<br />
(+13.6% at constant scope and exchange rates)<br />
French Retail Banking (excluding PEL/CEL) +3.5%/2Q06<br />
BNL bc +7.4%/2Q06<br />
International Retail Financial Services +9.4%/2Q06<br />
Asset Management and Services +21.9%/2Q06<br />
Corporate and Investment Banking +24.0%/2Q06<br />
• NET INCOME, GROUP SHARE €2,282MN, + 20.0%/2Q06<br />
… RESULT OF THE STRATEGY TO INTERNATIONALISE AND DEVELOP INNOVATION<br />
• 56% OF REVENUES OUTSIDE FRANCE<br />
• A EUROPEAN LEADER*:<br />
o RETAIL BANKING: TWO DOMESTIC MARKETS WITH THE SUCCESSFUL<br />
INTEGRATION OF BNL AND A PAN-EUROPEAN PRESENCE IN RETAIL FINANCIAL<br />
SERVICES: CETELEM NO. 1 IN CONSUMER LENDING IN CONTINENTAL EUROPE<br />
o ASSET MANAGEMENT AND SERVICES: NO. 1 IN SECURITIES CUSTODY<br />
SERVICES, ONLINE BROKERAGE AND SAVINGS SERVICES AND NO. 2 IN<br />
CORPORATE REAL ESTATE SERVICES IN EUROPE<br />
O CIB: A EUROPEAN POWERHOUSE WITH A GLOBAL REACH IN DERIVATIVES<br />
AND SPECIALIZED FINANCING; NO. 2 IN EUROPE FOR PRE-TAX INCOME IN<br />
2006, NO.2 WORLDWIDE FOR EQUITY DERIVATIVES<br />
*Sources: Lease Europe, EuroProperty and <strong>BNP</strong> <strong>Paribas</strong> Research<br />
SHARP RISE IN FIRST HALF PROFITABILITY<br />
• FIRST HALF EPS €5.22 (+17.9 %)<br />
• ANNUALISED ROE AFTER TAX 23.6% (+1.4 pts)
<strong>BNP</strong> PARIBAS – RESULTS AS AT 30 JUNE 2007<br />
The Board of Directors of <strong>BNP</strong> <strong>Paribas</strong> met on 31 July 2007. It was chaired by Michel<br />
Pébereau and it examined the group’s second quarter results and the first half financial<br />
statements.<br />
ROBUST ORGANIC GROWTH<br />
In the second quarter the revenues of <strong>BNP</strong> <strong>Paribas</strong> rose sharply (+13.4%) to €8,214mn.<br />
Operating expenses (€4,848mn) rose 13.1 %. At constant scope and exchange rates and<br />
excluding BNL’s restructuring costs, revenues grew 13.6% and operating expenses 10.5%,<br />
producing a high marked jaws effect of 3.1 points. Gross operating income increased 13.8%<br />
(+18.1% at constant scope and exchange rates).<br />
The cost of risk remained moderate at €258mn, or 0.21% of risk-weighted assets, compared<br />
to 0.11% in the second quarter 2006 and 0.23% in the first quarter 2007. The increase in the<br />
cost of risk compared to the second quarter 2006 is explained by €86mn less provision writebacks<br />
by CIB and the Corporate Centre, and by €15mn scope effects, notably the integration<br />
of UkrSibbank.<br />
Thanks to the good credit quality of its customer base and a prudent risk policy, <strong>BNP</strong> <strong>Paribas</strong><br />
is not directly impacted by the current US subprime mortgage crisis and the tensions in the<br />
LBO market. The rating agency Standard and Poor’s highlighted <strong>BNP</strong> <strong>Paribas</strong>’s sound risk<br />
management practices on 10 July when it announced that it was raising <strong>BNP</strong> <strong>Paribas</strong>’ rating<br />
to AA+. This rating puts <strong>BNP</strong> <strong>Paribas</strong> amongst the top 6 best rated big banks worldwide.<br />
<strong>BNP</strong> <strong>Paribas</strong>’ profitability in the second quarter was up sharply with net income, group share<br />
totalling €2,282mn (+20.0%).<br />
In the first half of the year, net income, group share amounted to €4,789mn (+22.4%), or a<br />
net half-year EPS of €5.22 (+17.9%). Annualised after-tax return on equity was 23.6%, up<br />
1.4 points from the first half of 2006.<br />
HIGH PERFORMANCE RETAIL BANKING<br />
In the second quarter 2007, the retail banking business lines (Banking Networks and Retail<br />
Financial Services) contributed 51% of the revenues of the Group’s core businesses.<br />
1. French Retail Banking (FRB): very sound business performance.<br />
The French network( 1 ), contributing 18% of the revenues of the Group’s core businesses,<br />
continued to roll out a robust sales and marketing drive against a backdrop of more difficult<br />
interest rates environment. The integration of the Dexia’s French Private Banking unit,<br />
renamed Banque Privée Anjou, further consolidated its position as no. 1 in Private Banking in<br />
France.<br />
Revenues( 2 ) (€1,496mn) were up 3.5% compared to the second quarter 2006, which<br />
constituted a high benchmark (+3.2% at constant scope). Fees increased 9.3%, thanks to<br />
substantial growth in fees from financial savings (15.4%) and sustained growth in banking<br />
services fees (5.6%), driven in particular by the expanding customer base. Net interest<br />
income edged down 0.9% compared to the second quarter 2007 (+1.4% compared to the<br />
first quarter 2007). <strong>Press</strong>ure on margins was due to the negative impact of regulated interest<br />
rates increase (+0.50% compared to the second quarter 2006), rising short-term interest<br />
rates as well as a delay in the upwards adjustment of customer rates.<br />
1<br />
) Including 100 % of private banking in France.<br />
2<br />
) Excluding the effect of PEL/CEL allowance<br />
2
<strong>BNP</strong> PARIBAS – RESULTS AS AT 30 JUNE 2007<br />
The write-back of the PEL/CEL (Home Savings Plans and Accounts) allowance, recently<br />
created under IFRS accounting standards, amounted this quarter to €20mn against €54mn in<br />
2Q06. Factoring in this effect, revenues rose 1.1% to €1,516mn.<br />
Operating expenses grew 3.5% (+2.9% at constant scope). Cost of risk was still very low at<br />
0.14% of risk-weighted assets, stable compared to the second quarter 2006 and the first<br />
quarter 2007, confirming the excellent credit quality of the customer base.<br />
Operating income( 2 ) grew 3.6% to €491mn compared to the second quarter 2006 (4.1% at<br />
constant scope). Following allocation of one third of French Private Banking to AMS,<br />
quarterly pre-tax income( 2 ) of French Retail Banking rose 2.7% to €456mn compared to the<br />
second quarter 2006 (2.7% at constant scope).<br />
FRB continued to affirm its sales performance:<br />
- The growth in the number of individual cheque and deposit accounts reached a record level:<br />
+140,000 in the first half of 2007, against +80,000 in the first half of 2006, in particular thanks<br />
to the successful marketing campaigns geared at young customers (Multiplacements Avenir,<br />
TA+K entrer).<br />
- Year-on-year, mortgage loans outstandings increased by 11.0% in a still buoyant market but<br />
in which <strong>BNP</strong> <strong>Paribas</strong> applied an increasingly selective lending policy. Outstanding consumer<br />
loans grew 5.9% compared to their second quarter 2006 level, outpacing the market (below<br />
3%)( 3).<br />
- Gross financial savings inflows remained particularly robust this quarter despite the high<br />
benchmark in the second quarter 2006, thereby bolstering significant growth in life insurance<br />
as well as medium and long-term mutual funds outstandings (+15.5 % and +15.4%<br />
respectively year-on-year). In a market where life insurance asset inflows fell 3%( 4 ) in the first<br />
half of 2007 compared to the exceptionally high level of the first half of 2006 (marked by<br />
strong PEL/CEL outflows), <strong>BNP</strong> <strong>Paribas</strong> confirmed its superior performance with stable life<br />
insurance asset inflows.<br />
- FRB’s Corporate Business continued to enjoy sustained growth, marked by a sharp rise in<br />
deposits and a doubling of structured investments distributed through regional dealing<br />
rooms, an excellent investment lending and factoring drive and a new rise in M&A activities<br />
thanks to deeper SME coverage. This positioning also helped grow cross-selling with Private<br />
Banking, as client referrals from the business centres grew 26% compared to the second<br />
quarter 2006.<br />
Over the first half of the year, revenues grew 3.8%( 2 ), operating expenses grew 3,2%, the<br />
cost/income ratio improved 0.4 points at 64.3%( 2 ) and pre-tax return on equity was stable at<br />
32%( 2 ).<br />
For 2007, in a more difficult interest rate environment marked by regulated rates that rise a<br />
further 25 bps on 1 st August 2007 and a surge in short-term interest rates, French Retail<br />
Banking continues to pursue the target of growing revenues by 4% and operating expenses<br />
by 3% at constant scope.<br />
2 ) Excluding the effect of PEL/CEL allowance<br />
3 ) Source: Banque de France<br />
4 ) Source: FFSA.<br />
3
2. BNL: ahead of schedule on the integration plan<br />
<strong>BNP</strong> PARIBAS – RESULTS AS AT 30 JUNE 2007<br />
One year after the acquisition of BNL, its powerful potential for value creation is confirmed<br />
with the first half 2007 results.<br />
For BNL as a whole, synergies are being implemented quicker than expected: in addition to<br />
the €38mn in synergies accounted for in the second half 2006, there was an additional<br />
€67mn in the first half 2007 accounts (€39mn of which was for BNL bc and €28mn for the<br />
CIB, AMS and IRFS core businesses), which amounted already to 83% of the additional<br />
synergies planned for 2007.<br />
In addition to this €105mn already posted, the full year effect of synergies implemented as at<br />
30 June, is €146mn which will be reflected in the accounts over the next few quarters. So,<br />
out of the target of €480mn in synergies planned by 2009, €251mn, i.e. 52%, are already<br />
implemented by 30 June 2007.<br />
Restructuring costs (booked at the corporate level) totalled €61mn in the second quarter of<br />
the year.<br />
An illustration this quarter of the successful integration is the continued overhaul of the retail<br />
banking product and service offering (Mutuo Revolution, Prestito Revolution), distribution<br />
agreements entered into between BNL bc and AMS to sell notably creditor insurance, and<br />
the popularity of CIB products with medium and large corporate customers.<br />
In the BNL banca commerciale core business (BLN bc)( 5 ), second quarter 2007 revenues<br />
came to €641mn (+7.4% compared to the second quarter 2006) while operating expenses<br />
edged up only 1.4% to €426mn.<br />
With a stable cost of risk (0.44% of risk-weighted assets compared to 0.46% in the second<br />
quarter 2006), BNL bc’s pre-tax income, reaching €163mn following allocation of one third of<br />
Italian Private Banking to AMS, grew 56.7% compared to the second quarter 2006.<br />
In the first half of 2007, the cost/income ratio improved appreciably, dropping from 69.6% to<br />
65.5% (-4.1 points) and pre-tax return on equity surged from 14% to 21% (+7 points).<br />
3. International Retail Banking and Financial Services (IRFS)<br />
This quarter, IRFS posted €1,996mn revenues, up 9.4% compared to the second quarter<br />
2006 and 8.7% at constant scope and exchange rates, due to the opposite effects of, on the<br />
one hand, the integration of UkrSibbank and, on the other hand, the decline in the dollar (-<br />
6.7% compared to the second quarter 2006). Operating expenses rose 13.1% (9.5% at<br />
constant scope and exchange rates). Pre-tax income, amounting to €636mn, edged down<br />
1.7% compared to the second quarter 2006 (up 4.4% at constant scope and exchange<br />
rates).<br />
BancWest improved its sales and marketing drive in an interest rate environment that<br />
continued to weigh on net interest margin. BancWest’s specialty franchises continued their<br />
expansion and have reached critical mass ranking no. 3 in the United States for agricultural<br />
lending and no. 1 for the financing of recreational vehicles. The net interest margin continued<br />
to be eroded at 3.11% compared to 3.35% in the second quarter 2006 and 3.21 of the first<br />
quarter 2007, such that revenues at constant scope fell 4.3% compared to the second<br />
quarter 2006. Operating expense growth was contained at 1.6%.<br />
BancWest’s exposure to the subprime market is very limited: less than 2% of the portfolio of<br />
mortgages granted to individuals. The cost of risk, €22mn, was up moderately compared to<br />
the very low level in the second quarter 2006 and stable compared to the first quarter 2007.<br />
5 ) Including 100 % of Private Banking in Italy.<br />
4
<strong>BNP</strong> PARIBAS – RESULTS AS AT 30 JUNE 2007<br />
In the first half 2007, BancWest pre-tax return on equity reached a high 35%.<br />
In the Emerging Retail Networks, revenues grew 54.3% to €341mn (35.9% at constant<br />
scope and exchange rates). The organic growth drive continued, especially in Turkey where<br />
the pace of branch openings accelerated and in Ukraine where revenues (€72mn) more than<br />
doubled compared to the second quarter 2006. At constant scope and exchanges rates, the<br />
jaws effect was over 8 points. The cost of risk rose from €10mn to €16mn, primarily due to<br />
the integration of UkrSibbank. Operating income, marking €104mn, grew 52.9% (+72.2% at<br />
constant scope and exchange rates).<br />
With a strong presence around the Mediterranean, <strong>BNP</strong> <strong>Paribas</strong> is continuing to roll out its<br />
integrated model across the region with the acquisition announced in July 2007 of a stake<br />
giving operational control over the Sahara Bank in Libya, an oil-producing country where<br />
banking penetration is still low and that has strong cultural and business ties with Italy.<br />
Cetelem continued its growth in France and outside France: its risk-weighted assets jumped<br />
17.6% and its revenues rose 11.3% (9.9% at constant scope and exchange rates) in a<br />
context of pressure on margins in the Euro zone. Growth in outstandings in France (including<br />
Laser Cofinoga and excluding industrial partnerships) was 9.1% in a market where growth<br />
was below 3%( 3 ). Emerging countries’ share in revenues grew to 15% in the first half 2007<br />
compared to 9% in 2005. International expansion continued with new operations beginning<br />
in Ukraine, China, Algeria and Mexico as well as the announcement in July 2007 of the<br />
acquisition of Banco BGN in Brazil that will bolster Cetelem’s already recognised position in<br />
this high-potential country. The rise in costs (13.1% or 9.5% at constant scope and exchange<br />
rates) reflects this business development strategy. The cost of risk remained stable at 2.22%<br />
of risk-weighted assets; the rise in the absolute value is explained by the rise in outstandings,<br />
notably in the emerging countries that have a structurally higher risk profile. As a result of the<br />
newly launched operations, operating income was stable (+0.6%) at €156mn. At constant<br />
scope and exchange rates, it rose 6.6% compared to the second quarter 2006. For the year<br />
2007, despite the rise in short-term interest rates, operating income growth at constant scope<br />
and exchange rates, is expected to reach high single digits.<br />
In the first half of 2007, IRFS posted a cost/income ratio up 1.3 points at 57.4% (+0.4 points<br />
at constant scope and exchange rates). Return on equity was 33% compared to 38% in the<br />
first half 2006.<br />
ASSET MANAGEMENT AND SERVICES (AMS): A STRONG DRIVE FOR GROWTH AND<br />
VALUE CREATION<br />
In the first half 2007, AMS again delivered excellent performances in all its business lines.<br />
During the first semester of the year, net inflows remained high (€24.3bn or 9% of assets<br />
under management). As at 30 June 2007, assets under management came to €596bn, up<br />
10.3% as compared to 31 December 2006, including a €4bn scope effect (due in particular to<br />
the integration of Dexia French Private Banking) and a €28bn performance and exchange<br />
rate effect.<br />
Quarterly revenues, €1,373mn, which contribute 18% of the revenues of the Group’s core<br />
businesses, rose 21.9% compared to second quarter 2006 (19.7% at constant scope and<br />
exchange rates). Each of the core business’s business lines enjoyed significant revenue<br />
growth: +27.5% for Wealth and Asset Management; +10.2% for Insurance compared to a<br />
very high base; +24.8% for Securities Services. The core business thereby confirmed its role<br />
as a growth driver for the Group.<br />
3 ) Source: Banque de France<br />
5
<strong>BNP</strong> PARIBAS – RESULTS AS AT 30 JUNE 2007<br />
With this robust growth dynamic, operating expenses grew at a fast pace (18.8%) but, at<br />
constant scope and exchange rates, yielded a positive 5.7 point jaws effect. Gross operating<br />
income, €559mn, was up 26.8% and pre-tax income 27.8% at €575mn.<br />
In the second quarter, Wealth and Asset Management saw exceptionally high new inflows<br />
in Private Banking (+13.1% annualized of assets under management) in particular from Asia<br />
and the Middle East. Real Estate Services also enjoyed significant 26.8% revenue growth<br />
this quarter. Growth in the Wealth and Asset Management business’ operating expenses<br />
was robust at 22.1% but lead to a more than 5 point jaws effect. Pre-tax income jumped<br />
39.7% compared to the second quarter 2006.<br />
Insurance continued its growth both in France, gaining market share, at 8.1%( 5 ), and<br />
continuing to sell a much higher proportion of unit-linked insurance products than the market<br />
(41% compared to 27%)( 6 ), and outside France, where gross inflows grew 30% in particular<br />
in the UK, Korea and Taiwan. Revenues grew 10.2% compared to a high base and operating<br />
expenses rose 9.5% to support organic growth and international business development. Pretax<br />
income rose 12.0% to €206mn.<br />
Securities Services continued to affirm its European leadership by winning lots of<br />
mandates. As at 30 June, assets under custody totalled €3,963bn (+21.9%). Assets under<br />
administration, a segment with greater added value, soared 61.1% year-on-year to €825bn.<br />
Thanks to a close to 5 point jaws effect, pre-tax income rose 35.8%. The business line will<br />
further expand its European coverage with the integration in the second half of the year of<br />
two acquisitions announced: RBSI Securities Services (Channel Islands) and ExelBank<br />
(Spain).<br />
Over the first half of the year, AMS’ pre-tax income totalled €1,067mn, up 25.4% compared<br />
to the very high base in the first half 2006. Pre-tax return on equity rose 3 points to 41%.<br />
CORPORATE AND INVESTMENT BANKING (CIB): A NEW RECORD THANKS TO<br />
POWERFUL FRANCHISES<br />
Corporate and Investment Banking confirmed, with its results in the second quarter, the<br />
organic growth drive unveiled during the Investors Day event held on 20 June 2007.<br />
CIB’s businesses set a new record this quarter, generating €2,479mn in revenues, 24.0%<br />
higher than the second quarter 2006 and 3.5% better than the last record in the first quarter<br />
2007. Customer revenues soared (18.6%). CIB’s contributed 31% of the revenues of the<br />
Group’s core businesses.<br />
Operating expenses grew 15.7%, incorporating the effects of bolstering the teams as well as<br />
the rise in variable compensation due to the excellent results of the capital market<br />
businesses. Gross operating income rose 36% to €1,114mn. Provision write-backs this<br />
quarter surpassed by €59mn (€125mn in the second quarter 2006) the limited amount of<br />
additions to provisions. CIB’s pre-tax income was up 27.7% to €1,244mn.<br />
Advisory and Capital Markets recorded a very sharp rise in revenues, €1,764mn, up 32.4%<br />
from the second quarter of 2006. The Equity and Advisory businesses grew 27.7% driven by<br />
sustained equity derivatives business, both in flow and in structured products, and by the<br />
rapid growth in the Equity Capital Markets businesses in Asia (Hong Kong, China, Korea).<br />
The revenues from the Fixed Income business line grew 36.9% this quarter, in particular the<br />
interest rate derivatives and structured credit businesses, reaping the benefit of an<br />
environment with high volatility and rising interest rates and spreads.<br />
6 ) Inflow market share. Source: FFSA.<br />
6
<strong>BNP</strong> PARIBAS – RESULTS AS AT 30 JUNE 2007<br />
The Financing Businesses continued the regular growth in their revenues (+7.2% at<br />
€715mn) thanks to buoyant level of business in the Energy and Commodities Finance and<br />
Acquisition Finance businesses.<br />
In the first half of 2007, the core business’ cost/income ratio, 54.1%, remains one of the best<br />
in the world for this type of business and pre-tax return on equity continued its rise at 44%,<br />
compared to 41% in the first half of 2006.<br />
In terms of risks, CIB has not been directly affected by the US subprime crisis and has not<br />
observed any deterioration of its leverage finance portfolio, as of today.<br />
In fact, CIB’s exposure to the subprime market is negligible.<br />
CIB’s indirect risk via its activity with hedge funds is moderate. Direct investments in hedge<br />
funds are negligible. Exposure to counterparty risk is collateralised. Hedge fund shares are<br />
held in the fund derivatives business, but only for the purpose of hedging structured products’<br />
positions.<br />
In the area of leverage finance, the portfolio of final takes is largely diversified, 69%<br />
European and virtually exclusively with senior tranches. The underwriting risk is limited and<br />
diversified.<br />
In a report dated 10 July, the rating agency Standard & Poor’s noted “<strong>BNP</strong> <strong>Paribas</strong>’ exposure<br />
to current areas of concern are either limited (US subprime) or well managed (leveraged<br />
finance).”<br />
<br />
<br />
In 2007, the <strong>BNP</strong> <strong>Paribas</strong> Group asserts itself more than ever as a fast-growing international<br />
financial services group. In the first half of the year, 56% of the Group’s revenues and 59% of<br />
its workforce are located outside France. With around three-quarters of its revenues<br />
generated in Europe, <strong>BNP</strong> <strong>Paribas</strong> has become a pan-European leader in all its business<br />
lines.<br />
Combining growing internationalisation, robust profitability and prudent and sophisticated risk<br />
management, <strong>BNP</strong> <strong>Paribas</strong> is deploying its integrated model to create value in high-potential<br />
businesses and has developed growth drivers enabling it to generate sustained organic<br />
growth (risk-weighted assets as at 30 June 2007 up 15.4% as compared to 30 June 2006).<br />
This value-creating growth dynamic is reflected in the growth in earnings per share, €5.22<br />
per share for the half year 2007, up 17.9% compared to the first half 2006.<br />
<br />
<br />
Commenting on the results, <strong>BNP</strong> <strong>Paribas</strong>’ Chief Executive Officer Baudouin Prot, stated:<br />
“Posting again robust revenue growth, the Group is reaping the benefits of the growth and<br />
internationalisation strategy conducted for the last few years. All the Group’s business lines<br />
are regularly improving their competitive positions thanks to a shared culture of innovation<br />
and excellence. The quality of our business model and our vigilance in terms of risks puts us<br />
in a good position to keep performing well in a less favorable environment.”<br />
7
<strong>BNP</strong> PARIBAS – RESULTS AS AT 30 JUNE 2007<br />
This press <strong>release</strong> includes forward-looking statements based on current beliefs and expectations about future events. Forwardlooking<br />
statements include financial projections and estimates and their underlying assumptions, statements regarding plans,<br />
objectives and expectations with respect to future events, operations, products and services, and statements regarding future<br />
performance and synergies. Forward-looking statements are not guarantees of future performance and are subject to inherent risks,<br />
uncertainties and assumptions about <strong>BNP</strong> <strong>Paribas</strong> and its subsidiaries and investments, developments of <strong>BNP</strong> <strong>Paribas</strong> and its<br />
subsidiaries, banking industry trends, future capital expenditures and acquisitions, changes in economic conditions globally or in<br />
<strong>BNP</strong> <strong>Paribas</strong>’ principal local markets, the competitive market and regulatory factors. Those events are uncertain; their outcome may<br />
differ from current expectations which may in turn significantly affect expected results. Actual results may differ materially from those<br />
projected or implied in these forward-looking statements. Any forward-looking statement contained in this press <strong>release</strong> speaks as<br />
of the date of this press <strong>release</strong>: <strong>BNP</strong> <strong>Paribas</strong> undertakes no obligation to publicly revise or update any forward-looking statements<br />
in light of new information or future events.<br />
The information contained in this press <strong>release</strong> as it relates to parties other than <strong>BNP</strong> <strong>Paribas</strong> or derived from external sources has<br />
not been independently verified and no representation or warranty expressed or implied is made as to, and no reliance should be<br />
placed on the fairness, accuracy, completeness or correctness of, the information or opinions contained herein. None of<br />
<strong>BNP</strong> <strong>Paribas</strong> or its representatives shall have any liability whatsoever in negligence or otherwise for any loss however arising from<br />
any use of this press <strong>release</strong> or its contents or otherwise arising in connection with this press <strong>release</strong> or any other information or<br />
material discussed.<br />
8
CONSOLIDATED PROFIT AND LOSS ACCOUNT<br />
<strong>BNP</strong> PARIBAS – RESULTS AS AT 30 JUNE 2007<br />
2Q07 2Q06 2Q07 / 1Q07 2Q07 / 1H07 1H06 1H07<br />
In millions of euros 2Q06 1Q07 1H0<br />
Revenues 8,214 7,245 +13.4% 8,213 +0.0% 16,427 14,062 +16.8%<br />
Operating Expenses and Dep. -4,848 -4,288 +13.1% -4,586 +5.7% -9,434 -8,150 +15.8%<br />
Gross Operating Income 3,366 2,957 +13.8% 3,627 -7.2% 6,993 5,912 +18.3%<br />
Provisions -258 -121 n.s. -260 -0.8% -518 -237 +118.6%<br />
Operating Income 3,108 2,836 +9.6% 3,367 x2,4 6,475 5,675 +14.1%<br />
Associated Companies 90 59 +52.5% 127 -29.1% 217 121 +79.3%<br />
Other Non Operating Items 59 -2 n.s. 1 n.s. 60 33 +81.8%<br />
Non Operating Items 149 57 +161.4% 128 +16.4% 277 154 +79.9%<br />
Pre-Tax Income 3,257 2,893 +12.6% 3,495 -6.8% 6,752 5,829 +15.8%<br />
Tax Expense -874 -837 +4.4% -854 +2.3% -1,728 -1,643 +5.2%<br />
Minority Interests -101 -155 -34.8% -134 -24.6% -235 -272 -13.6%<br />
Net Income, Group Share 2,282 1,901 +20.0% 2,507 -9.0% 4,789 3,914 +22.4%<br />
Cost / Income 59.0% 59.2% -0.2 pt 55.8% +3.2 pt 57.4% 58.0% -0.6 p<br />
At constant scope and exchange rates/2Q06 and excluding BNL restructuring<br />
costs: high marked jaws effect<br />
• Revenues: +13.6% (core businesses: +15.4%)<br />
• Operating expenses: +10.5% (core businesses: +10.3%)<br />
Cost of risk limited to 21 bp of risk weighted assets, or + €137mn compared to an<br />
exceptionally low 2Q06 (11 bp)<br />
• Provision write-backs at CIB and in “Other Businesses” lower by €86mn/2Q06<br />
• Growth in emerging markets (Emerging Retail Banking,<br />
Cetelem)<br />
Revenues 2Q07/1Q07: + 3.4% for core businesses<br />
9
1Q07 - RESULTS BY CORE BUSINESSES<br />
In millions of euros<br />
<strong>BNP</strong> PARIBAS – RESULTS AS AT 30 JUNE 2007<br />
FRB BNL bc IRFS AMS CIB Core<br />
businesses<br />
Other<br />
activities<br />
Revenues 1,450 636 1,996 1,373 2,479 7,934 280 8,214<br />
%Change/2Q06 +0.4% +7.8% +9.4% +21.9% +24.0% +13.6% +7.3% +13.4%<br />
%Change/1Q07 -0.6% +0.8% +4.0% +8.4% +3.5% +3.4% n.s. +0.0%<br />
Operating Expenses and Dep. -943 -422 -1,150 -814 -1,365 -4,694 -154 -4,848<br />
%Change/2Q06 +3.1% +1.7% +13.1% +18.8% +15.7% +11.4% +102.6% +13.1%<br />
%Change/1Q07 +1.7% +3.7% +4.7% +4.4% +7.4% +4.7% +49.5% +5.7%<br />
Gross Operating Income 507 214 846 559 1,114 3,240 126 3,366<br />
%Change/2Q06 -4.2% +22.3% +4.7% +26.8% +36.0% +16.9% -31.9% +13.8%<br />
%Change/1Q07 -4.7% -4.5% +3.0% +14.8% -1.0% +1.6% -71.2% -7.2%<br />
Provisions -31 -50 -240 0 59 -262 4 -258<br />
%Change/2Q06 +0.0% -7.4% +29.7% n.s. -52.8% +80.7% -83.3% n.s.<br />
%Change/1Q07 -3.1% -38.3% +18.8% n.s. +5.4% +0.4% -70.4% -0.8%<br />
Operating Income 476 164 606 559 1,173 2,978 130 3,108<br />
%Change/2Q06 -4.4% +35.5% -2.7% +26.8% +24.3% +13.4% -37.8% +9.6%<br />
%Change/1Q07 -4.8% +14.7% -2.1% +15.3% -0.7% +1.7% -43.2% -7.7%<br />
Associated Companies 0 0 22 11 3 36 54 90<br />
Other Non Operating Items 0 -1 8 5 68 80 -21 59<br />
Pre-Tax Income 476 163 636 575 1,244 3,094 163 3,257<br />
%Change/2Q06 -4.4% +56.7% -1.7% +27.8% +27.7% +15.8% -25.9% +12.6%<br />
%Change/1Q07 -4.8% +14.0% -0.5% +16.9% +4.5% +4.4% n.s. -6.8%<br />
In millions of euros<br />
FRB BNL bc IRFS AMS CIB Core<br />
businesses<br />
Other<br />
activities*<br />
Revenues 1,450 636 1,996 1,373 2,479 7,934 280 8,214<br />
2Q06 1,444 590 1,825 1,126 1,999 6,984 261 7,245<br />
1Q07 1,459 631 1,919 1,267 2,396 7,672 541 8,213<br />
Operating Expenses and Dep. -943 -422 -1,150 -814 -1,365 -4,694 -154 -4,848<br />
2Q06 -915 -415 -1,017 -685 -1,180 -4,212 -76 -4,288<br />
1Q07 -927 -407 -1,098 -780 -1,271 -4,483 -103 -4,586<br />
Gross Operating Income 507 214 846 559 1,114 3,240 126 3,366<br />
2Q06 529 175 808 441 819 2,772 185 2,957<br />
1Q07 532 224 821 487 1,125 3,189 438 3,627<br />
Provisions -31 -50 -240 0 59 -262 4 -258<br />
2Q06 -31 -54 -185 0 125 -145 24 -121<br />
1Q07 -32 -81 -202 -2 56 -261 1 -260<br />
Operating Income 476 164 606 559 1,173 2,978 130 3,108<br />
2Q06 498 121 623 441 944 2,627 209 2,836<br />
1Q07 500 143 619 485 1,181 2,928 439 3,367<br />
Associated Companies 0 0 22 11 3 36 54 90<br />
2Q06 0 1 24 8 1 34 25 59<br />
1Q07 0 0 19 7 6 32 95 127<br />
Other Non Operating Items 0 -1 8 5 68 80 -21 59<br />
2Q06 0 -18 0 1 29 12 -14 -2<br />
1Q07 0 0 1 0 4 5 -4 1<br />
Pre-Tax Income 476 163 636 575 1,244 3,094 163 3,257<br />
2Q06 498 104 647 450 974 2,673 220 2,893<br />
1Q07 500 143 639 492 1,191 2,965 530 3,495<br />
Tax Expense -874<br />
Minority Interests -101<br />
Net Income, Group Share 2,282<br />
Group<br />
Group<br />
10
1H07 - RESULTS BY CORE BUSINESSES<br />
In millions of euros<br />
<strong>BNP</strong> PARIBAS – RESULTS AS AT 30 JUNE 2007<br />
FRB BNL bc IRFS AMS CIB Core<br />
businesses<br />
Other<br />
activities<br />
Revenues 2,909 1,267 3,915 2,640 4,875 15,606 821 16,427<br />
%Change 1H06 +0.7% +1.2% +9.0% +21.9% +13.9% +15.5% +50.1% +16.8%<br />
Operating Expenses and Dep. -1,870 -829 -2,248 -1,594 -2,636 -9,177 -257 -9,434<br />
%Change 1H06 +2.9% +1.2% +11.7% +20.1% +8.7% +14.8% +66.9% +15.8%<br />
Gross Operating Income 1,039 438 1,667 1,046 2,239 6,429 564 6,993<br />
%Change 1H06 -3.0% +22.7% +5.6% +24.8% +20.6% +16.5% -1.3% +18.3%<br />
Provisions -63 -131 -442 -2 115 -523 5 -518<br />
%Change 1H06 +1.6% -5.1% +30.8% n.s. -19.6% +72.0% -92.5% +118.6%<br />
Operating Income 976 307 1,225 1,044 2,354 5,906 569 6,475<br />
%Change 1H06 -3.3% +40.2% -1.2% +23.6% +17.7% +13.3% +23.7% +14.1%<br />
Associated Companies 0 0 41 18 9 68 149 217<br />
Other Non Operating Items 0 -1 9 5 72 85 -25 60<br />
Pre-Tax Income 976 306 1,275 1,067 2,435 6,059 693 6,752<br />
%Change 1H06 -3.3% +53.0% -3.6% +25.4% +19.5% +13.8% +37.2% +15.8%<br />
Minority Interests -1 #REF! 0 -235 0 -235<br />
Tax Expense -1,728<br />
Net Income, Group Share 4,789<br />
Annualised ROE after Tax 23.6%<br />
Group<br />
11
FRENCH RETAIL BANKING<br />
French Retail Banking excluding PEL/CEL effects<br />
<strong>BNP</strong> PARIBAS – RESULTS AS AT 30 JUNE 2007<br />
2Q07 2Q06 2Q07 / 1Q07 2Q07 / 1H07 1H06 1H07 /<br />
In millions of euros 2Q06 1Q07 1H06<br />
Revenues 1,496 1,445 +3.5% 1,499 -0.2% 2,995 2,885 +3.8%<br />
Incl. Interest Margin 815 822 -0.9% 802 +1.6% 1,617 1,624 -0.4%<br />
Incl. Commissions 681 623 +9.3% 697 -2.3% 1,378 1,261 +9.3%<br />
Operating Expenses and Dep. -973 -940 +3.5% -954 +2.0% -1,927 -1,867 +3.2%<br />
Gross Operating Income 523 505 +3.6% 545 -4.0% 1,068 1,018 +4.9%<br />
Provisions -32 -31 +3.2% -31 +3.2% -63 -62 +1.6%<br />
Operating Income 491 474 +3.6% 514 -4.5% 1,005 956 +5.1%<br />
Non Operating Items 1 0 n.s. 0 n.s. 1 0 n.s.<br />
Pre-Tax Income 492 474 +3.8% 514 -4.3% 1,006 956 +5.2%<br />
Income Attributable to AMS -36 -30 +20.0% -41 -12.2% -77 -65 +18.5%<br />
Pre-Tax Income of French Retail Bkg 456 444 +2.7% 473 -3.6% 929 891 +4.3%<br />
Cost / Income 65.0% 65.1% -0.1 pt 63.6% +1.4 pt 64.3% 64.7% -0.4 pt<br />
Allocated Equity (Ebn) 5.8 5.5 +5.1% 5.7 +1.4% 5.8 5.5 +5.2%<br />
Pre-Tax ROE 31% 32% -0 pt 33% -0 pt 32% 33% -1 pt<br />
Including 100% of French Private Banking for Revenues to Pre-Tax Income line items<br />
Revenues: +3.5%/2Q06 (+3.2% at constant scope)<br />
• Net interest margin up 1.6%/1Q07 and down 0.9%/2Q06 due to a high base,<br />
the negative impact of the rise in regulated and short-term interest rates as well<br />
as a delay in the upward adjustment of customer rates<br />
• Sharp rise in fees: +9.3 %/2Q06<br />
Operating expenses: +3.5%/2Q06 (+2.9% at constant scope)<br />
Cost of risk still very low: 14 bp vs. 15 bp in 2Q06 and 15 bp in 1Q07<br />
• Excellent customer base<br />
Operating Income: +3.6% (+4.1% at constant scope)<br />
French Retail Banking including PEL/CEL effects<br />
2Q07 2Q06 2Q07 / 1Q07 2Q07 / 1H07 1H06 1H07 /<br />
In millions of euros 2Q06 1Q07 1H06<br />
Revenues 1,516 1,499 +1.1% 1,526 -0.7% 3,042 3,003 +1.3%<br />
Incl. Interest Margin 835 876 -4.7% 829 +0.7% 1,664 1,742 -4.5%<br />
Incl. Commissions 681 623 +9.3% 697 -2.3% 1,378 1,261 +9.3%<br />
Operating Expenses and Dep. -973 -940 +3.5% -954 +2.0% -1,927 -1,867 +3.2%<br />
Gross Operating Income 543 559 -2.9% 572 -5.1% 1,115 1,136 -1.8%<br />
Provisions -32 -31 +3.2% -31 +3.2% -63 -62 +1.6%<br />
Operating Income 511 528 -3.2% 541 -5.5% 1,052 1,074 -2.0%<br />
Non Operating Items 1 0 n.s. 0 n.s. 1 0 n.s.<br />
Pre-Tax Income 512 528 -3.0% 541 -5.4% 1,053 1,074 -2.0%<br />
Income Attributable to AMS -36 -30 +20.0% -41 -12.2% -77 -65 +18.5%<br />
Pre-Tax Income of French Retail Bkg 476 498 -4.4% 500 -4.8% 976 1,009 -3.3%<br />
Cost / Income 64.2% 62.7% +1.5 pt 62.5% +1.7 pt 63.3% 62.2% +1.1 pt<br />
Allocated Equity (Ebn) 5.8 5.5 +5.1% 5.7 +1.4% 5.8 5.5 +5.3%<br />
Pre-Tax ROE 33% 36% -3 pt 35% -2 pt 34% 37% -3 pt<br />
Including 100% of French Private Banking for Revenues to Pre-Tax Income line items<br />
Net interest margin not representative of French Retail Banking’s<br />
business activity<br />
• Because it is impacted by variations in the PEL/CEL provision<br />
PEL/CEL effect: €20mn in 2Q07 compared to €54mn in 2Q06<br />
• Including the volume effect: €6mn vs €13mn in 2Q06<br />
12
<strong>BNP</strong> PARIBAS – RESULTS AS AT 30 JUNE 2007<br />
Individuals, Professionals, Entrepreneurs<br />
Continued to accelerate the pace of attracting new customers<br />
• Opened 60,000 new accounts in 2Q07 thanks, in particular, to new services tailor-made for young people (“TA+K<br />
entrer”, “Multiplacements Avenir” investment product)<br />
• Success of the Open House event for Entrepreneurs: close to 5,000 projects for 530 million euros in loan applications<br />
Success of the customer fidelity programme thanks to wide variety of products and services and CRM tools<br />
Corporate Customers<br />
Corporate Finance: fresh rise in business thanks to close relationship with SMEs (1H07 fees amount to 80% of total fees in<br />
2006)<br />
Financing: good sales & marketing drive<br />
• Investment loans: outstanding +7.8 %/1H06<br />
• Factoring: new loans +15%/1H06<br />
Structured placements done via regional dealing rooms: +103%/1H06<br />
Cross-selling with Private Banking in France: new customers +26%/1H06<br />
FEES<br />
Rise in fees’ contribution to revenues*<br />
• 46% in 1H07 vs. 43.7% in 1H06<br />
Fees on investment funds and transactions:<br />
+15.4%/2Q06<br />
• Success in placing two innovative<br />
structured investment funds: Conquistador<br />
and Mambo<br />
• Sharp growth in fees on life-insurance<br />
and mutual funds thanks to substantial<br />
volumes placed in 2006 and a large part of<br />
unit-linked insurance products<br />
Fees on other banking transactions: +5.6%/2Q06<br />
• More customers who are doing more<br />
business and are more faithful<br />
259 235 206 231<br />
LENDINGS, DEPOSITS AND SAVINGS, FUNDS UNDER MANAGEMENT<br />
in billions of euros<br />
Outstandings<br />
2Q07<br />
Fees<br />
In €mn<br />
638<br />
623<br />
592 617<br />
697 681<br />
288<br />
271<br />
379 388 387 386 409 410<br />
1Q06 2Q06 3Q06 4Q06 1Q07 2Q07<br />
* Incl. 100% of French Private Banking; excl. PEL/CEL effects<br />
% Change<br />
1 year<br />
2Q07/2Q06<br />
% Change<br />
1 quarter<br />
2Q07/1Q07<br />
Average<br />
Outstandings<br />
1H07<br />
Fees on investment<br />
funds and transactions<br />
Fees on other banking<br />
transactions<br />
%Change<br />
1 Year<br />
1H07/1H06<br />
LENDINGS (1)<br />
Total loans 103.1 +8.6% +2.0% 102.1 +8.8%<br />
Individual Customers 55.7 +10.3% +2.7% 54.9 +10.7%<br />
Incl. Mortgages 48.0 +11.0% +2.9% 47.4 +11.5%<br />
Incl. Consumer Lending 7.6 +5.9% +1.7% 7.6 +5.9%<br />
Corporates 44.3 +7.8% +1.5% 43.9 +7.8%<br />
DEPOSITS AND SAVINGS (1) 85.3 +6.6% +1.9% 84.5 +6.2%<br />
Cheque and Current Accounts 35.9 +6.8% +2.3% 35.5 +6.8%<br />
Saving Accounts 37.0 -1.7% -0.7% 37.2 -2.0%<br />
Market Rate Deposits 12.3 +41.8% +9.4% 11.8 +40.8%<br />
(1) Average cash outstandings<br />
in billions of euros<br />
30 June 07<br />
% Change<br />
30.06.07/<br />
30.06.06<br />
% Change<br />
31.03.07/<br />
31.12.06<br />
Funds under management<br />
Life insurance 56.5 +15.5% +3.7%<br />
Mutual fund (2) 81.9 +16.3% -0.4%<br />
(2) These statistics do not include funds assets registered in Luxembourg (PARVEST). Source: Europerformance.<br />
Powerful sales and marketing drive<br />
• Loans: sustained growth with greater selectiveness in mortgage lending<br />
• Deposits: new significant contribution from corporates<br />
• Life insurance asset inflow: markedly outperformed the market, sustained by renewed product and service offering (in line/1H06 vs –<br />
3%* for the market)<br />
*Source: FFSA<br />
13
BNL banca commerciale<br />
<strong>BNP</strong> PARIBAS – RESULTS AS AT 30 JUNE 2007<br />
2Q07 2Q06 2Q07 / 1Q07 2Q07 / 1H07 1H06 1H07 /<br />
In millions of euros 2Q06 1Q07 pro forma 1H06<br />
Revenues 641 597 +7.4% 638 +0.5% 1,279 1,189 +7.6%<br />
Operating Expenses and Dep. -426 -420 +1.4% -412 +3.4% -838 -828 +1.2%<br />
Gross Operating Income 215 177 +21.5% 226 -4.9% 441 361 +22.2%<br />
Provisions -50 -54 -7.4% -81 -38.3% -131 -138 -5.1%<br />
Operating Income 165 123 +34.1% 145 +13.8% 310 223 +39.0%<br />
Non Operating Items -1 -17 -94.1% 0 n.s. -1 -19 -94.7%<br />
Pre-Tax Income 164 106 +54.7% 145 +13.1% 309 204 +51.5%<br />
Income Attributable to AMS -1 -2 -50.0% -2 -50.0% -3 -4 -25.0%<br />
Pre-Tax Income of Italian Retail Bkg 163 104 +56.7% 143 +14.0% 306 200 +53.0%<br />
Cost / Income 66.5% 70.4% -3.9 pt 64.6% +1.9 pt 65.5% 69.6% -4.1 pt<br />
Allocated Equity (Ebn) 2.9 2.8 +0.7% 3.1 -6.3% 3.0 2.8 +4.1%<br />
Pre-Tax ROE 23% 15% +8 pt 19% +0 pt 21% 15% +6 pt<br />
Including 100% of Private Banking in Italy for the line items from Revenues to Pre-tax Income<br />
Net interest margin: + 9.6%/2Q06<br />
• Increase of margins on individual customers deposits<br />
Fees: + 4.4%/2Q06<br />
• Mostly in the corporate segment (banking fees and factoring)<br />
Moderate rise in operating expenses and depreciation: +1.4%/2Q06<br />
• Synergies effect: marginal costs -€4mn; cost synergies: €13mn<br />
Cost of risk: 44 bp vs 46 bp in 2Q06<br />
Pre-tax income: +56.7%/2Q06<br />
• Significant improvement of pre-tax ROE<br />
LENDINGS, DEPOSITS AND SAVINGS, FUNDS UNDER MANAGEMENT<br />
in billions of euros<br />
Outstandings<br />
2Q07<br />
% Change<br />
1 year<br />
2Q07/2Q06<br />
% Change<br />
1 quarter<br />
2Q07/1Q07<br />
Average<br />
Outstandings<br />
1H07<br />
%Change<br />
1 Year<br />
1H07/1H06<br />
LENDINGS (1)<br />
Total loans 51.7 +4.4% +1.6% 51.3 +4.1%<br />
Individual Customers 23.5 +6.1% +1.3% 23.3 +6.8%<br />
Incl. Mortgages 16.9 +7.4% +1.6% 16.8 +8.8%<br />
Corporates 28.2 +3.0% +1.8% 28.0 +1.8%<br />
DEPOSITS AND SAVINGS (1) 32.2 +3.6% +1.3% 32.0 +4.3%<br />
Individual Customers 20.6 +2.8% -0.2% 20.6 +4.1%<br />
Corporates 11.6 +4.9% +4.3% 11.3 +4.7%<br />
(1) Average volumes<br />
in billions of euros<br />
Funds under management<br />
30 June 07<br />
% Change<br />
30.06.07/<br />
30.06.06<br />
% Change<br />
30.06.07/<br />
31.03.07<br />
Mutual funds 11.5 -15.8% -5.0%<br />
Life insurance 10.1 +10.9% -1.9%<br />
Growth in individual customers lending driven by volume increase of mortgages<br />
Corporate lending: pick-up in business<br />
Deposits growth :<br />
• Individual customers: slow down due to switches into short-term Italian government bonds (BOT), following the rise in<br />
short-term interest rates<br />
• Corporate customers : confirmation of good sales and marketing drive<br />
Mutual funds (excluding Parvest and Life-Insurance): slow down in net asset outflows in 2Q07<br />
• General trend of households moving into Italian T-Bonds<br />
14
INDIVIDUALS<br />
Sustained sales and marketing drive<br />
• Accelerated product offering restyling (Mutuo Revolution, Prestito Revolution)<br />
Success of AMS products<br />
• Credit Protection Insurance: volume +82%/1Q07<br />
Revitalisation of the entrepreneur and professionals market segment<br />
• ML term lending: + 3%/1Q07<br />
• Deposits: +7%/1Q07<br />
Improved marketing effectiveness<br />
• New customer segmentation<br />
• Lowered threshold to access private banking<br />
CORPORATE<br />
Public bodies and local authorities:<br />
• Strengthening of the sales teams<br />
• Accelerated growth: short-term deposits +9.1%/1Q07<br />
Corporate customers: 97 structured finance mandates<br />
signed in 1H07 (of which 67 implemented)<br />
First commercial success with CIB<br />
• 15 structured finance mandates signed (of which 2<br />
implemented)<br />
5 trade centres opened<br />
• Rome, Milan, Florence, Bologna, Naples<br />
<strong>BNP</strong> PARIBAS – RESULTS AS AT 30 JUNE 2007<br />
Structured finance<br />
mandates signed<br />
39<br />
X 2.5<br />
97<br />
1S06 1S07<br />
15
<strong>BNP</strong> PARIBAS – RESULTS AS AT 30 JUNE 2007<br />
INTERNATIONAL RETAIL BANKING AND FINANCIAL SERVICES<br />
2Q07 2Q06 2Q07 / 1Q07 2Q07 / 1H07 1H06 1H07 /<br />
In millions of euros 2Q06 1Q07 1H06<br />
Revenues 1,996 1,825 +9.4% 1,919 +4.0% 3,915 3,591 +9.0%<br />
Operating Expenses and Dep. -1,150 -1,017 +13.1% -1,098 +4.7% -2,248 -2,013 +11.7%<br />
Gross Operating Income 846 808 +4.7% 821 +3.0% 1,667 1,578 +5.6%<br />
Provisions -240 -185 +29.7% -202 +18.8% -442 -338 +30.8%<br />
Operating Income 606 623 -2.7% 619 -2.1% 1,225 1,240 -1.2%<br />
Associated Companies 22 24 -8.3% 19 +15.8% 41 44 -6.8%<br />
Other Non Operating Items 8 0 n.s. 1 n.s. 9 38 -76.3%<br />
Pre-Tax Income 636 647 -1.7% 639 -0.5% 1,275 1,322 -3.6%<br />
Cost / Income 57.6% 55.7% +1.9 pt 57.2% +0.4 pt 57.4% 56.1% +1.3 pt<br />
Allocated Equity (Ebn) 7.9 7.1 +12.1% 0.0 n.s. 7.8 7.0 +11.4%<br />
Pre-Tax ROE 32% 37% -5 pt 0% +32 pt 33% 38% -5 pt<br />
BANCWEST<br />
Scope and exchange rate effects<br />
• Full integration of UkrSibbank<br />
• USD/EUR: -6.6% 2Q07/2Q06<br />
At constant scope and exchange rates/2Q06<br />
• Revenues: +8.7%<br />
• Operating expenses:<br />
+9.5%<br />
• GOI: +7.8%<br />
• Cost of risk: +20%<br />
• Pre-tax income: +4.4%<br />
2Q07 2Q06 2Q07 / 1Q07 2Q07 / 1H07 1H06 1H07 /<br />
In millions of euros 2Q06 1Q07 1H06<br />
Revenues 493 549 -10.2% 511 -3.5% 1,004 1,126 -10.8%<br />
Operating Expenses and Dep. -261 -274 -4.7% -268 -2.6% -529 -567 -6.7%<br />
Gross Operating Income 232 275 -15.6% 243 -4.5% 475 559 -15.0%<br />
Provisions -22 -12 n.s. -23 -4.3% -45 -21 n.s.<br />
Operating Income 210 263 -20.2% 220 -4.5% 430 538 -20.1%<br />
Associated Companies 0 0 n.s. 0 n.s. 0 0 n.s.<br />
Other Non Operating Items 6 0 n.s. 0 n.s. 6 0 n.s.<br />
Pre-Tax Income 216 263 -17.9% 220 -1.8% 436 538 -19.0%<br />
Cost / Income 52.9% 49.9% +3.0 pt 52.4% +0.5 pt 52.7% 50.4% +2.3 pt<br />
Allocated Equity (Ebn) 2.5 2.6 -3.5% 2.4 +2.2% 2.5 2.6 -6.3%<br />
Pre-Tax ROE 35% 41% -6 pt 36% -1 pt 35% 41% -6 pt<br />
At constant scope and exchange rates/2Q06<br />
• Revenues: -4.3%; negative effect of the inversion of the yield curves on net interest<br />
margins: -24 bp/2Q06 at 3.11%<br />
• Operating expenses: +1.6%<br />
Moderate<br />
cost of risk: 23 bp/risk weighted assets in 2Q07<br />
• Up compared to the very low level in<br />
2Q06 (13 bp)<br />
• Stable compared to 1Q07 (24bp)<br />
Good sales & marketing drive and increased cross-selling<br />
• Fees: +3.9%/2Q06<br />
16
<strong>BNP</strong> PARIBAS – RESULTS AS AT 30 JUNE 2007<br />
(US GAAP )<br />
2Q07 2Q06 2Q07 1Q07 2Q07<br />
(in billions of USD) /2Q06 /1Q07<br />
Total Assets 70.7 66.7 +5.9% 68.7 +2.9%<br />
Loans and Leases 46.8 44.4 +5.4% 46.1 +1.5%<br />
Deposits 43.1 43.6 -1.1% 43.7 -1.5%<br />
Non Performing Assets<br />
/Loans and foreclosed properties<br />
30.06.07 30.06.06 30.06.07 31.03.07 30.06.07<br />
/ 30.06.06 / 31.03.07<br />
Jan-00 Jan-00 Jan-00 Jan-00 Jan-00<br />
0.54% 0.46% +8 bp 0.57% -3 bp<br />
2Q07 2Q06 2Q07 1Q07 2Q07<br />
/2Q06 /1Q07<br />
Net Interest Margin 3.11% 3.35% -24 bp 3.21% -10 bp<br />
Good progress in loans outstandings<br />
Deposits down due to the switch to mutual funds as the rate rose<br />
GOOD QUALITY OF THE REAL ESTATE PORTFOLIO<br />
Exposure to the real estate market limited to 52%<br />
of the loan portfolio compared to 62% for the competition<br />
Loan portfolio as at 30/06/07<br />
Consumer<br />
Mortgage Lending<br />
Corporate Real Estate<br />
Commercial & Industrial<br />
25%<br />
Commercial real estate: 25% of the portfolio<br />
• Half comes from loans made to owner-occupiers<br />
• Less than 2% are rated substandard by the bank<br />
• Negligible contribution to BancWest’s cost of risk<br />
Mortgage lending to individual: 27% of the portfolio<br />
• Portfolio diversified over 20 states including California<br />
39% and Hawaii 15%<br />
• Marginal share of loans made to sub prime customers<br />
$155mn/ total mortgages granted to individuals $12.9bn<br />
as at 30.06.07<br />
• No prime portfolio deterioration reported<br />
Investment portfolio: comprising only 2% of subprime<br />
mortgages<br />
22% 26%<br />
27%<br />
52%<br />
Segmentation of mortgages granted to<br />
individuals<br />
99%<br />
49%<br />
50%<br />
1%<br />
FICO Scores<br />
Superprime<br />
Prime<br />
Subprime<br />
58%<br />
40%<br />
2%<br />
98%<br />
First Mortgage Home Equity<br />
Loans and Lines<br />
17
EMERGING RETAIL BANKING<br />
<strong>BNP</strong> PARIBAS – RESULTS AS AT 30 JUNE 2007<br />
2Q07 2Q06 2Q07 / 1Q07 2Q07 / 1H07 1H06 1H07 /<br />
In millions of euros 2Q06 1Q07 1H06<br />
Revenues 341 221 +54.3% 305 +11.8% 646 430 +50.2%<br />
Operating Expenses and Dep. -221 -143 +54.5% -205 +7.8% -426 -281 +51.6%<br />
Gross Operating Income 120 78 +53.8% 100 +20.0% 220 149 +47.7%<br />
Provisions -16 -10 +60.0% -11 +45.5% -27 -13 +107.7%<br />
Operating Income 104 68 +52.9% 89 +16.9% 193 136 +41.9%<br />
Non Operating Items 2 3 -33.3% 4 -50.0% 6 3 +100.0%<br />
Pre-Tax Income 106 71 +49.3% 93 +14.0% 199 139 +43.2%<br />
Cost / Income 64.8% 64.7% +0.1 pt 67.2% -2.4 pt 65.9% 65.3% +0.6 pt<br />
Allocated Equity (Ebn) 1.1 0.6 +62.1% 1.0 +10.5% 1.0 0.7 +53.1%<br />
Pre-Tax ROE 40% 44% -4 pt 0% +40 pt 40% 42% -2 pt<br />
CETELEM<br />
At constant scope and exchange rates/2Q06<br />
• Revenues: +35.9%<br />
• Operating expenses: +27.5%<br />
• GOI: +52.4%<br />
• Pre-tax income: +70.5%<br />
Very sharp rise in revenues: +54.3%/2Q06<br />
• Scope effect: full integration of UkrSibbank<br />
• Continued organic growth<br />
• 45 branches opened in 2Q07<br />
Cost of risk: -€16mn in 2Q07 compared to -€10mn in 2Q06<br />
• Scope effect related to the integration of UkrSibbank: -€8mn<br />
2Q07 2Q06 2Q07 / 1Q07 2Q07 / 1H07 1H06 1H07 /<br />
In millions of euros 2Q06 1Q07 1H06<br />
Revenues 757 680 +11.3% 714 +6.0% 1,471 1,319 +11.5%<br />
Operating Expenses and Dep. -424 -375 +13.1% -393 +7.9% -817 -728 +12.2%<br />
Gross Operating Income 333 305 +9.2% 321 +3.7% 654 591 +10.7%<br />
Provisions -177 -150 +18.0% -151 +17.2% -328 -281 +16.7%<br />
Operating Income 156 155 +0.6% 170 -8.2% 326 310 +5.2%<br />
Associated Companies 23 19 +21.1% 17 +35.3% 40 37 +8.1%<br />
Other Non Operating Items 0 -1 n.s. 0 n.s. 0 36 n.s.<br />
Pre-Tax Income 179 173 +3.5% 187 -4.3% 366 383 -4.4%<br />
Cost / Income 56.0% 55.1% +0.9 pt 55.0% +1.0 pt 55.5% 55.2% +0.3 pt<br />
Allocated Equity (Ebn) 2.2 1.9 +16.3% 0.0 n.s. 2.1 1.8 +15.4%<br />
Pre-Tax ROE 33% 37% -4 pt 0% +33 pt 35% 42% -7 pt<br />
At constant scope and exchange rates/2Q06: positive 0.4 pt jaws effect thanks to<br />
a continuous effort to control operating expenses<br />
• Revenues: +9.9% (+15.7% outside France)<br />
• Despite substantial pressure on margins in the Euro zone in a context of rising interest<br />
rates<br />
• Operating expenses: +9.5% ; GOI: +10.4% ; Pre-tax income: +5.5%<br />
Cost<br />
of risk at 222 bp of risk weighted assets vs 221 bp in 2Q06 and 197 bp in<br />
1Q07<br />
• France: stable cost of risk<br />
• Outside France: increase in cost of risk related to the growth in outstandings in<br />
emerging markets<br />
Continued<br />
business development investments in high-potential countries<br />
• A number of new operations got started including in Algeria, Mexico<br />
and China<br />
weighing on the operating income<br />
• Acquisition of Banco BGN in Brazil announced in July 2007<br />
18
EQUIPMENT SOLUTIONS, UCB<br />
<strong>BNP</strong> PARIBAS – RESULTS AS AT 30 JUNE 2007<br />
2Q07 2Q06 2Q07 / 1Q07 2Q07 / 1H07 1H06 1H07 /<br />
In millions of euros 2Q06 1Q07 1H06<br />
Revenues 405 375 +8.0% 389 +4.1% 794 716 +10.9%<br />
Operating Expenses and Dep. -244 -225 +8.4% -232 +5.2% -476 -437 +8.9%<br />
Gross Operating Income 161 150 +7.3% 157 +2.5% 318 279 +14.0%<br />
Provisions -25 -13 +92.3% -17 +47.1% -42 -23 +82.6%<br />
Operating Income 136 137 -0.7% 140 -2.9% 276 256 +7.8%<br />
Associated Companies -2 2 n.s. -2 +0.0% -4 4 n.s.<br />
Other Non Operating Items 1 1 +0.0% 1 +0.0% 2 2 +0.0%<br />
Pre-Tax Income 135 140 -3.6% 139 -2.9% 274 262 +4.6%<br />
Cost / Income 60.2% 60.0% +0.2 pt 59.6% +0.6 pt 59.9% 61.0% -1.1 pt<br />
Allocated Equity (Ebn) 2.2 2.0 +12.2% 2.2 +1.5% 2.2 1.9 +18%<br />
Pre-Tax ROE 24% 28% -4 pt 0% +24 pt 25% 28% -3 pt<br />
FINANCIAL SERVICES – MANAGED OUTSTANDINGS<br />
In billions of euros<br />
At constant scope and exchange rates/2Q06<br />
• Revenues: +6.6%<br />
• Operating expenses: +5.3%<br />
• GOI: + 8.5%<br />
• Pre-tax income: +1.3%<br />
Cost of risk up compared to a very low level in 2Q06<br />
UCB<br />
• Tie-up under way with Cetelem in a “Personal Finance” business line<br />
• Partnership agreement<br />
in Turkey with TEB and in India with Sundaram Finance<br />
Equipment Solutions<br />
• BPLG: equipment financing partnership agreement in India with SREI<br />
Jun-07 Jun-06<br />
%Change<br />
1 year<br />
/ June 06<br />
Mar-07<br />
%Change<br />
1 quarter<br />
/ March 07<br />
CETELEM 57.7 48.0 +20.3% 55.3 +4.4%<br />
France (1), incl. 33.2 27.9 +18.9% 31.8 +4.1%<br />
Cetelem France (2) 16.7 14.7 +13.4% 16.4 +1.4%<br />
Laser Cofinoga 8.8 7.8 +13.5% 8.5 +3.7%<br />
Partnerships and parent company's outstandings 7.6 5.4 +41.6% 6.9 +11.2%<br />
Outside France 24.6 20.1 +22.2% 23.4 +4.8%<br />
<strong>BNP</strong> <strong>Paribas</strong> Lease Group MT (3) 21.5 15.5 +38.3% 20.7 +3.6%<br />
France 10.6 10.7 -1.4% 10.5 +0.9%<br />
Europe (excluding France) 10.9 4.8 n.s. 10.2 +6.2%<br />
UCB 35.2 30.6 +15.0% 33.7 +4.4%<br />
France (1) 16.8 16.1 +4.5% 16.4 +2.4%<br />
Europe (excluding France) 18.4 14.6 +26.5% 17.3 +6.3%<br />
Long Term Leasing with Services 6.9 6.4 +6.9% 6.8 +1.5%<br />
France 2.2 2.1 +6.3% 2.2 -0.7%<br />
Europe (excluding France) 4.7 4.3 +7.2% 4.5 +2.6%<br />
ARVAL (in thousands)<br />
Financed vehicles 522 0 484 +7.9% 512 +1.9%<br />
included in total managed vehicles 615 0 603 +2.1% 615 +0.1%<br />
(1) Transfer from UCB France to Cetelem France (debt consolidation activity): €0.9bn as at 31.12.06<br />
(2) Cetelem France, excl. debt consolidation activity: +6.8%/June 06<br />
(3) Consolidation of Locafit outstandings (Leasing subsidiary of BNL): €5.0bn as at 31.12.06<br />
19
ASSET MANAGEMENT AND SERVICES<br />
<strong>BNP</strong> PARIBAS – RESULTS AS AT 30 JUNE 2007<br />
2Q07 2Q06 2Q07 / 1Q07 2Q07 / 1H07 1H06 1H07 /<br />
In millions of euros 2Q06 1Q07 1H06<br />
Revenues 1,373 1,126 +21.9% 1,267 +8.4% 2,640 2,165 +21.9%<br />
Operating Expenses and Dep. -814 -685 +18.8% -780 +4.4% -1,594 -1,327 +20.1%<br />
Gross Operating Income 559 441 +26.8% 487 +14.8% 1,046 838 +24.8%<br />
Provisions 0 0 n.s. -2 n.s. -2 7 n.s.<br />
Operating Income 559 441 +26.8% 485 +15.3% 1,044 845 +23.6%<br />
Associated Companies 11 8 +37.5% 7 +57.1% 18 7 n.s.<br />
Other Non Operating Items 5 1 n.s. 0 n.s. 5 -1 n.s.<br />
Pre-Tax Income 575 450 +27.8% 492 +16.9% 1,067 851 +25.4%<br />
Cost / Income 59.3% 60.8% -1.5 pt 61.6% -2.3 pt 60.4% 61.3% -0.9 pt<br />
Allocated Equity (Ebn) 5.4 4.7 +15.4% 5.0 +7.3% 5.2 4.5 +16.7%<br />
Pre-Tax ROE 43% 35% +8 pt 39% +4 pt 41% 38% +3 pt<br />
ACTIVITY<br />
At constant scope and exchange rates/2Q06<br />
• Revenues: + 19.7%<br />
• Operating expenses : +14.0%<br />
• Positive jaws effect of 5.7 pt<br />
High profitability, up sharply<br />
• Pre-tax income: +27.8%/2Q06<br />
• Pre-tax ROE: 41% in 1H07 (+3 pt/1H06)<br />
30 June 07<br />
30 June 06<br />
pro forma<br />
30 June 07 /<br />
30 June 06<br />
31 March 07<br />
30 June 07<br />
31 March 07<br />
Assets under management (in €bn) 596.1 504.5 18.2% 567.5 5.0%<br />
Asset management 289.7 235.5 23.0% 277.6 4.4%<br />
Private Banking and Cortal Consors 189.8 156.8 21.0% 175.5 8.1%<br />
Insurance 108.5 104.5 3.8% 106.4 2.0%<br />
Real Estate Services 8.1 7.7 5.5% 8.0 1.3%<br />
2Q07<br />
2Q06<br />
pro forma<br />
2Q07/2Q06 1Q07 2Q07/1Q07<br />
Net asset inflows (in €bn) 9.3 10.5 -11.2% 15.0 -37.7%<br />
Asset management 2.5 5.1 -51.7% 8.7 -71.5%<br />
Private Banking and Cortal Consors 5.5 3.9 40.5% 3.5 56.5%<br />
Insurance 1.3 1.4 -7.8% 2.8 -54.8%<br />
Real Estate Services 0.0 0.1 0.0% 0.0 0.0%<br />
30 June 07<br />
30 June 06<br />
pro forma<br />
30 June 07 /<br />
30 June 06<br />
31 March 07<br />
30 June 07/<br />
31 March 07<br />
Securities Services<br />
Assets under custody (in €bn) 3,963 3,250 +21.9% 3,660 +8.3%<br />
Assets under administration (in €bn) 825.3 512.1 +61.1% 706.2 +16.9%<br />
2Q07 2Q06 2Q07/2Q06 1Q07 2Q07/1Q07<br />
Number of transactions (in thousands) 10,910 8,371 +30.3% 10,032 +8.8%<br />
Strong sales and marketing drive, based on the comprehensive product and service offering of all the business lines<br />
20
ASSET MANAGEMENT – BREAKDOWN OF AUM<br />
52%<br />
Money Market<br />
23%<br />
Equity<br />
21%<br />
31/12/06<br />
Diversified<br />
16%<br />
Bonds<br />
25%<br />
Alternative,<br />
structured and<br />
Index-based<br />
15%<br />
Money Market<br />
24%<br />
Equity<br />
22%<br />
<strong>BNP</strong> PARIBAS – RESULTS AS AT 30 JUNE 2007<br />
30/06/07<br />
Diversified<br />
18%<br />
€251.4bn €289.7bn<br />
WEALTH AND ASSET MANAGEMENT<br />
Bonds<br />
20%<br />
56%<br />
Alternative,<br />
structured<br />
and Index-based<br />
16%<br />
2Q07 2Q06 2Q07 / 1Q07 2Q07 / 1H07 1H06 1H07 /<br />
In millions of euros 2Q06 1Q07 1H06<br />
Revenues 715 561 +27.5% 653 +9.5% 1,368 1,081 +26.5%<br />
Operating Expenses and Dep. -442 -362 +22.1% -429 +3.0% -871 -709 +22.8%<br />
Gross Operating Income 273 199 +37.2% 224 +21.9% 497 372 +33.6%<br />
Provisions 0 -1 n.s. -1 n.s. -1 1 n.s.<br />
Operating Income 273 198 +37.9% 223 +22.4% 496 373 +33.0%<br />
Associated Companies 0 0 n.s. 5 n.s. 5 -1 n.s.<br />
Other Non Operating Items 5 1 n.s. 0 n.s. 5 2 n.s.<br />
Pre-Tax Income 278 199 +39.7% 228 +21.9% 506 374 +35.3%<br />
Cost / Income 61.8% 64.5% -2.7 pt 65.7% -3.9 pt 63.7% 65.6% -1.9 pt<br />
Allocated Equity (Ebn) 1.7 1.4 +22.8% 1.5 +10.9% 1.6 1.3 +22.7%<br />
Pre-Tax ROE 66% 58% +8 pt 60% +6 pt 63% 57% +6 pt<br />
Remarkable new asset inflow drive in Private Banking: €4.8bn in 2Q06 (13.1% of<br />
annualised<br />
outstandings)<br />
• From the Middle East and Asia particularly<br />
Revenues continued fast-paced growth: + 27.5%/2Q06<br />
• Asset Management: +28.2%*/2Q06<br />
• Corporate Real Estate Services: +26.8%*/2Q06<br />
• Asia Private Banking: +46%/2Q06<br />
Very go od operating performance: jaws effect of 5.4 pt<br />
Very sharp rise in profitability<br />
• Pre-tax income: +39.7%/2Q06<br />
*At constant scope and exchange rates<br />
21
INSURANCE<br />
<strong>BNP</strong> PARIBAS – RESULTS AS AT 30 JUNE 2007<br />
2Q07 2Q06 2Q07 / 1Q07 2Q07 / 1H07 1H06 1H07 /<br />
In millions of euros 2Q06 1Q07 1H06<br />
Revenues 356 323 +10.2% 353 +0.8% 709 633 +12.0%<br />
Operating Expenses and Dep. -161 -147 +9.5% -159 +1.3% -320 -287 +11.5%<br />
Gross Operating Income 195 176 +10.8% 194 +0.5% 389 346 +12.4%<br />
Provisions 0 1 n.s. -1 n.s. -1 6 n.s.<br />
Operating Income 195 177 +10.2% 193 +1.0% 388 352 +10.2%<br />
Associated Companies 11 8 +37.5% 2 n.s. 13 8 +62.5%<br />
Other Non Operating Items 0 -1 n.s. 0 n.s. 0 -4 n.s.<br />
Pre-Tax Income 206 184 +12.0% 195 +5.6% 401 356 +12.6%<br />
Cost / Income 45.2% 45.5% -0.3 pt 45.0% +0.2 pt 45.1% 45.3% -0.2 pt<br />
Allocated Equity (Ebn) 3.0 2.7 +11.7% 3.0 +2.4% 3.0 2.6 +15.1%<br />
Pre-Tax ROE 27% 27% +0 pt 26% +1 pt 27% 27% +0 pt<br />
SECURITIES SERVICES<br />
France: maintained high gross asset inflows (€2.7bn) despite a high reference<br />
period in 2Q06<br />
• Over 1H07, gained 0.5 pt of market share to reach 8.1%* (vs.7.6% in<br />
2006)<br />
• Share of unit-linked insurance products in 1H07 at 44% of life-insurance<br />
sales vs 27%* for the market<br />
International: very sharp rise in gross asset inflows at €1.9bn (+30%/2Q06)<br />
• Including €1.3bn in savings (+47%/2Q06), in particular thanks to the UK<br />
(+224%), South Korea (+125%) and Taiwan (+56%)<br />
Operating expenses: +9.5% to support organic growth and international<br />
expansion<br />
Started up business in Croatia in July<br />
*Source FFSA<br />
2Q07 2Q06 2Q07 / 1Q07 2Q07 / 1H07 1H06 1H07 /<br />
In millions of euros 2Q06 1Q07 1H06<br />
Revenues 302 242 +24.8% 261 +15.7% 563 451 +24.8%<br />
Operating Expenses and Dep. -211 -176 +19.9% -192 +9.9% -403 -331 +21.8%<br />
Gross Operating Income 91 66 +37.9% 69 +31.9% 160 120 +33.3%<br />
Provisions 0 0 n.s. 0 n.s. 0 0 n.s.<br />
Operating Income 91 66 +37.9% 69 +31.9% 160 120 n.s.<br />
Non Operating Items 0 1 n.s. 0 n.s. 0 1 n.s.<br />
Pre-Tax Income 91 67 +35.8% 69 +31.9% 160 121 +32.2%<br />
Cost / Income 69.9% 72.7% -2.8 pt 73.6% -3.7 pt 71.6% 73.4% -1.8 pt<br />
Allocated Equity (Ebn) 0.7 0.6 +16.4% 0.5 +24.5% 0.6 0.5 +11.0%<br />
Pre-Tax ROE 54% 46% +8 pt 51% +3 pt 53% 44% +9 pt<br />
Continued the excellent sales and marketing drive winning many mandates from<br />
the institutional investor segment<br />
Very strong growth in volumes: particularly in assets under administration<br />
+61%/2Q06 and in transactions +30%/2Q06<br />
RBSI Securities Services and ExelBank acquisitions finalised with consolidation<br />
scheduled in 2H07<br />
Improved operating efficiency: 4.9 pt jaws effect<br />
Strong rise in profitability<br />
• Pre-tax income: +35.8%<br />
22
CORPORATE AND INVESTMENT BANKING<br />
<strong>BNP</strong> PARIBAS – RESULTS AS AT 30 JUNE 2007<br />
2Q07 2Q06 2Q07 / 1Q07 2Q07 / 1H07 1H06 1H07 /<br />
In millions of euros 2Q06 1Q07 1H06<br />
Revenues 2,479 1,999 +24.0% 2,396 +3.5% 4,875 4,281 +13.9%<br />
Operating Expenses and Dep. -1,365 -1,180 +15.7% -1,271 +7.4% -2,636 -2,424 +8.7%<br />
Gross Operating Income 1,114 819 +36.0% 1,125 -1.0% 2,239 1,857 +20.6%<br />
Provisions 59 125 -52.8% 56 +5.4% 115 143 -19.6%<br />
Operating Income 1,173 944 +24.3% 1,181 -0.7% 2,354 2,000 +17.7%<br />
Associated Companies 3 1 n.s. 6 -50.0% 9 2 n.s.<br />
Other Non Operating Items 68 29 n.s. 4 n.s. 72 36 +100.0%<br />
Pre-Tax Income 1,244 974 +27.7% 1,191 +4.5% 2,435 2,038 +19.5%<br />
Cost / Income 55.1% 59.0% -3.9 pt 53.0% +2.1 pt 54.1% 56.6% -2.5 pt<br />
Allocated Equity (Ebn) 11.4 10.3 +10.6% 10.9 +4.8% 11.1 9.9 +12.6%<br />
Pre-Tax ROE 0% 0% +0 pt 0% +0 pt 44% 41% +3 pt<br />
ADVISORY AND CAPITAL MARKETS<br />
Revenues: +24.0%/2Q06, +3.5% better than the previous record in 1Q07<br />
• Very robust customer business (customer revenues +18.6%)<br />
Operating expenses: +15.7%<br />
• Continued to strengthen the front office staff<br />
• Growth in variable compensation<br />
Cost/income ratio still low at 55.1%<br />
Continued to optimise the capital used<br />
• Fresh rise in the pre-tax ROE at 44% in 1H07<br />
2Q07 2Q06 2Q07 / 1Q07 2Q07 / 1H07 1H06 1H07 /<br />
In millions of euros 2Q06 1Q07 1H06<br />
Revenues 1,764 1,332 +32.4% 1,672 +5.5% 3,436 2,955 +16.3%<br />
Incl. Equity and Advisory 826 647 +27.7% 814 +1.5% 1,640 1,408 +16.5%<br />
Incl. Fixed Income 938 685 +36.9% 857 +9.5% 1,796 1,547 +16.1%<br />
Operating Expenses and Dep. -1,064 -898 +18.5% -981 +8.5% -2,045 -1,872 +9.2%<br />
Gross Operating Income 700 434 +61.3% 691 +1.3% 1,391 1,083 +28.4%<br />
Provisions 0 0 n.s. 0 n.s. 0 0 n.s.<br />
Operating Income 700 434 +61.3% 691 +1.3% 1,391 1,083 +28.4%<br />
Associated Companies 3 1 n.s. 6 -50.0% 9 2 n.s.<br />
Other Non Operating Items 19 29 -34.5% 4 n.s. 23 36 -36.1%<br />
Pre-Tax Income 722 464 +55.6% 701 +3.0% 1,423 1,121 +26.9%<br />
Cost / Income 60.3% 67.4% -7.1 pt 58.7% +1.6 pt 59.5% 63.4% -3.9 pt<br />
Allocated Equity (Ebn) 4.3 4.0 +6.4% 4.1 +4.3% 4.2 3.7 +14.1%<br />
Pre-Tax ROE 66% 46% +20 pt 70% -4 pt 68% 61% +7 pt<br />
Revenues: + 32.4%/2Q06<br />
• Sharp rise in customer revenues in all regions (+29%/2Q06)<br />
Operating expenses: +18.5%/2Q06<br />
• Front office staff +5%/31.12.06<br />
• Rise in variable compensation<br />
Pre-tax income: +55.6%/2Q06<br />
23
VAR (1 DAY − 99%) BY TYPE OF RISK<br />
Average<br />
quarterly<br />
VaR<br />
In €mn<br />
2<br />
3<br />
2<br />
2<br />
2<br />
1<br />
3<br />
2 3 2<br />
4<br />
12 3<br />
2<br />
18 2<br />
17<br />
13<br />
2 3<br />
3<br />
2<br />
14<br />
15 3 26<br />
17<br />
19<br />
11<br />
28<br />
26<br />
43 18 24 16<br />
18<br />
14<br />
14<br />
23<br />
13 14 12 15 11 14 17 12<br />
-21 -23<br />
-35<br />
-25<br />
-31<br />
-23 -22 -24<br />
-30 -27 -30 -28 -29<br />
Increased VaR<br />
• Rapid business growth, especially in equity derivatives<br />
• Enhanced method: added equity correlation risk factors<br />
Daily P&L very stable despite market turbulences<br />
• Only 4 loosing days in 1H07 (17 for all of 2006)<br />
• No loosing week in 1H07 (1 for all of 2006)<br />
4<br />
14<br />
15<br />
20<br />
<strong>BNP</strong> PARIBAS – RESULTS AS AT 30 JUNE 2007<br />
27 54 34 31 40 26 21 21 25 25 23 23 20 21 25 23 39<br />
5<br />
5<br />
4<br />
2<br />
14<br />
11<br />
13<br />
4<br />
4<br />
9<br />
15<br />
16<br />
4<br />
1<br />
22<br />
13<br />
18<br />
3<br />
21<br />
14<br />
22<br />
2<br />
29<br />
15<br />
15<br />
38 22 22 25 28 27 19 19 36 25 28 16 19 21 20 25 52<br />
30.06.03<br />
30.09.03<br />
31.12.03<br />
31.03.04<br />
FINANCING BUSINESSES<br />
30.06.04<br />
30.09.04<br />
31.12.04<br />
31.03.05<br />
30.06.05<br />
30.09.05<br />
31.12.05<br />
5<br />
31.03.06<br />
30.06.06<br />
30.09.06<br />
-37<br />
31.12.06<br />
-45<br />
31.03.07<br />
-41<br />
30.06.07<br />
6<br />
5<br />
55<br />
14<br />
21<br />
-48<br />
Commodities<br />
Change & others<br />
Equities<br />
Interest rate<br />
Crédit<br />
Netting<br />
Quarterly average<br />
VaR<br />
Bar chart: data from the<br />
last market trading day<br />
of the period<br />
2Q07 2Q06 2Q07/ 1Q07 2Q07/ 1H07 1H06 1H07/<br />
In millions of euros 2Q06 1Q07 1H06<br />
Revenues 715 667 +7.2% 724 -1.2% 1,439 1,326 +8.5%<br />
Operating Expenses and Dep. -301 -282 +6.7% -290 +3.8% -591 -552 +7.1%<br />
Gross Operating Income 414 385 +7.5% 434 -4.6% 848 774 +9.6%<br />
Provisions 59 125 -52.8% 56 +5.4% 115 143 -19.6%<br />
Operating Income 473 510 -7.3% 490 -3.5% 963 917 +5.0%<br />
Non Operating Items 49 0 n.s. 0 n.s. 49 0 n.s.<br />
Pre-Tax Income 522 510 +2.4% 490 +6.5% 1,012 917 +10.4%<br />
Cost / Income 42.1% 42.3% -0.2 pt 40.1% +2.0 pt 41.1% 41.6% -0.5 pt<br />
Allocated Equity (Ebn) 7.1 6.3 +13.3% 6.8 +5.1% 6.9 6.2 +11.8%<br />
Pre-Tax ROE 29% 33% -4 pt 29% +0 pt 29% 30% -1 pt<br />
Regular revenue growth (+7.2%)<br />
Operating expenses and depreciation: +6.7%<br />
• Trend towards specialised financing<br />
Further provision write-backs<br />
• Still very low level of new provision, including for LBOs<br />
• Less write-backs than in 2Q06<br />
One off non operating capital gains of €49mn<br />
Pre-tax income: +2.4% compared to a very high<br />
2Q06<br />
Pre-Tax Income*<br />
in €mn<br />
407<br />
510<br />
439<br />
460<br />
490<br />
522<br />
1Q06 2Q06 3Q06 4Q06 1Q07 2Q07<br />
* BNL business to CIB integrated from 2Q06<br />
24
<strong>BNP</strong> PARIBAS – RESULTS AS AT 30 JUNE 2007<br />
CIB: RANKINGS<br />
Advisory and Capital Markets<br />
• Equity Derivatives House of the Year 2007 (Risk Awards, Jan 07 and FOW, June 07)<br />
• Structured Products House of the Year 2007 (Euromoney, July 07) for the second consecutive year<br />
• Best Equity-linked MTN House and Best Fund-linked MTN House (Euroweek, May 07)<br />
• #3 Interest Rate and FX Derivatives Denominated in Euros,<br />
Dollars and Yen for local currency products (Asiamoney structured products poll, May 07)<br />
• #14 M&A Announced Deals worldwide (Dealogic, 1H07)<br />
Financing Businesses<br />
• Best Structured Commodity Bank (Trade Finance Magazine, June 07)<br />
• Best Trade Bank in Oil/Energy and Most Innovative Bank in Trade (Trade & Forfaiting Review, July 07)<br />
• #1 Global Mandated Lead Arranger - Project Finance (Thomson, by volume, 1H07)<br />
• #2 Bookrunner and MLA in EMEA - Structured Finance (Thomson, by volume, 1H07)<br />
CIB: RISK WEIGHTED ASSETS BY TYPE OF RISK<br />
Market Risk<br />
Risk Weighted Assets - CIB<br />
Counterparty Risk<br />
(beginning of period)<br />
Credit Risk - Specialised Financing<br />
Credit Risk - Plain Vanilla<br />
166.1<br />
12.3<br />
165.6<br />
12.4<br />
166.4<br />
10.9<br />
172.1<br />
10.8<br />
in €bn<br />
53.6 56.3 54.8<br />
66.4<br />
57.0<br />
180.9<br />
9.4<br />
60.8<br />
68.2 70.3 72.6 79.3<br />
33.8 28.7 30.4 31.7 31.4<br />
2Q06 3Q06 4Q06 1Q07 2Q07<br />
FINANCING BUSINESSES: AVERAGE RISK WEIGHTED ASSETS<br />
Sustained growth in gross risk weighted assets: +9.0%/1H06<br />
• Development of specialised finance<br />
Partly offset by protection bought in 2006<br />
• Not very sensitive to spreads because essentially done in<br />
the form of securitisation<br />
Average Risk Weighted Assets<br />
Financing Business Line<br />
in €bn<br />
120.1<br />
15.6<br />
104.5<br />
+13.4%/2Q06<br />
+19.4%/2Q06<br />
-7.1%/2Q06<br />
+9.0%<br />
+4.6%<br />
21.6<br />
109.3<br />
1H06* 1H07<br />
Impact of protection bought<br />
130.9<br />
Average net weighted assets<br />
*Pro forma including BNL’s business operations transferred to CIB<br />
25
A SOLID FINANCIAL STRUCTURE<br />
<strong>BNP</strong> PARIBAS – RESULTS AS AT 30 JUNE 2007<br />
CAPITAL STRUCTURE<br />
In billions of euros 30-Jun-07 31-Dec-06 30-Jun-06<br />
Shareholders' equity Group share, not re-evaluated (a) 39.4 37.1 36.5<br />
Valuation Reserve 4.5 5.0 3.7<br />
Including <strong>BNP</strong> <strong>Paribas</strong> Capital 2.1 2.2 1,7<br />
Total Capital ratio 10.2% 10.5% 10.7%<br />
Tier One Ratio (b) 7.2% 7.4% 7.6%<br />
(a) Excluding undated participating subordinated notes and after estimated distribution.<br />
(b) On estimated risk weighted assets, respectively of €513.6bn as at 30.06.07, €465.2bn as at 31.12.06 and €445.0bn as at 30.06.06<br />
NUMBER OF SHARES<br />
in millions 30 June 2007 30 June 2006<br />
Number of Shares (end of period) 932.9 924.6<br />
Number of Shares excluding Treasury Shares (end of period) 892.0 910.5<br />
Average Number of Shares Outstanding excluding Treasury Shares 901.3 871.7<br />
EARNINGS PER SHARE<br />
In euros 1H07 1H06<br />
Earnings Per Share (EPS) 5.22 4.43<br />
BOOK VALUE PER SHARE<br />
In euros 30/06/2007 30/06/2006<br />
Book Value Per Share excl. Treasury Shares 50.9 45.8<br />
of which shareholders' equity not re-evaluated 45.9 41.7<br />
COVERAGE RATIO<br />
In billions of euros 30-Jun-07 31-Mar-07<br />
Doubtful loans and commitments (1) 13.7 15.3<br />
Provisions 12.7 13.8<br />
Coverage ratio 93% 90%<br />
(1) Gross doubtful loans, balance sheet and off-balance sheet<br />
RATINGS<br />
S&P AA+ Stable Outlook Upgraded on 10 July 2007<br />
Fitch AA Stable Outlook Reaffirmed on 16 May 2007<br />
Moody's Aa1 Stable Outlook Upgraded on 23 May 2007<br />
26
<strong>BNP</strong> PARIBAS – RESULTS AS AT 30 JUNE 2007<br />
BREAK-DOWN OF COMMITMENTS BY INDUSTRY<br />
Gross outstandings + off balance sheet commitments, unweighted = €763bn as at 30.06.07<br />
Communication Services<br />
2%<br />
B2B<br />
2%<br />
Healthcare & Pharmaceuticals<br />
1%<br />
Private individuals and self-employed<br />
36%<br />
Utilities (Electricity, Gas, Water, etc)<br />
3%<br />
Transportation<br />
3%<br />
Wholesalers<br />
7%<br />
Insurance<br />
1%<br />
Chemicals<br />
1%<br />
Household appliances<br />
Automotive<br />
1%<br />
1%<br />
Construction<br />
2%<br />
Technology<br />
2%<br />
M edia & Cultural Services<br />
1%<br />
BREAK-DOWN OF COMMITMENTS BY REGION<br />
Gross outstandings + off balance sheet commitments, unweighted = 763 Md€ au 30.06.07<br />
Italy<br />
13%<br />
France<br />
35%<br />
Japan<br />
1%<br />
Food<br />
3%<br />
M ining<br />
3%<br />
Africa &Middle<br />
East<br />
3%<br />
Other European<br />
Union +<br />
Switzerland<br />
22%<br />
Retailers<br />
2%<br />
Energy<br />
4%<br />
Capital goods<br />
3%<br />
Finance, Sovereign, Local gvt<br />
18%<br />
Hotels, Tourism, Leisure<br />
1%<br />
Real Estate<br />
3%<br />
North America<br />
13%<br />
Bancwest<br />
6%<br />
Latin America<br />
3%<br />
Asia-Pacific<br />
(excl. Japan)<br />
4%<br />
27
Quarterly Series<br />
<strong>BNP</strong> PARIBAS – RESULTS AS AT 30 JUNE 2007<br />
In millions of euros 1Q06 2Q06 3Q06 4Q06 1Q07 2Q07<br />
GROUP<br />
Revenues 6,817 7,245 6,829 7,052 8,213 8,214<br />
Operating Expenses and Dep. -3,862 -4,288 -4,261 -4,654 -4,586 -4,848<br />
Gross Operating Income 2,955 2,957 2,568 2,398 3,627 3,366<br />
Provisions -116 -121 -264 -282 -260 -258<br />
Operating Income 2,839 2,836 2,304 2,116 3,367 3,108<br />
Associated Companies 62 59 118 54 127 90<br />
Other Non Operating Items 35 -2 4 145 1 59<br />
Pre-Tax Income 2,936 2,893 2,426 2,315 3,495 3,257<br />
Tax Expense -806 -837 -638 -481 -854 -874<br />
Minority Interests -117 -155 -113 -115 -134 -101<br />
Net Income, Group Share 2,013 1,901 1,675 1,719 2,507 2,282<br />
In millions of euros 1Q06 2Q06 3Q06 4Q06 1Q07 2Q07<br />
FRENCH RETAIL BANKING (including 100% of Private Banking in France)<br />
Revenues 1,504 1,499 1,439 1,408 1,526 1,516<br />
Incl. Interest Margin 866 876 847 791 829 835<br />
Incl. Commissions 638 623 592 617 697 681<br />
Operating Expenses and Dep. -927 -940 -972 -972 -954 -973<br />
Gross Operating Income 577 559 467 436 572 543<br />
Provisions -31 -31 -35 -56 -31 -32<br />
Operating Income 546 528 432 380 541 511<br />
Non Operating Items 0 0 0 1 0 1<br />
Pre-Tax Income 546 528 432 381 541 512<br />
Income Attributable to AMS -35 -30 -24 -28 -41 -36<br />
Pre-Tax Income of French Retail Bkg 511 498 408 353 500 476<br />
FRENCH RETAIL BANKING (including 100% of Private Banking in France) - Excl. PEL/CEL EFFECT<br />
Revenues 1,440 1,445 1,401 1,385 1,499 1,496<br />
Incl. Interest Margin 802 822 809 768 802 815<br />
Incl. Commissions 638 623 592 617 697 681<br />
Operating Expenses and Dep. -927 -940 -972 -972 -954 -973<br />
Gross Operating Income 513 505 429 413 545 523<br />
Provisions -31 -31 -35 -56 -31 -32<br />
Operating Income 482 474 394 357 514 491<br />
Non Operating Items 0 0 0 1 0 1<br />
Pre-Tax Income 482 474 394 358 514 492<br />
Income Attributable to AMS -35 -30 -24 -28 -41 -36<br />
Pre-Tax Income of French Retail Bkg 447 444 370 330 473 456<br />
FRENCH RETAIL BANKING (including 2/3 of Private Banking in France)<br />
Revenues 1,444 1,444 1,390 1,355 1,459 1,450<br />
Operating Expenses and Dep. -902 -915 -947 -947 -927 -943<br />
Gross Operating Income 542 529 443 408 532 507<br />
Provisions -31 -31 -35 -56 -32 -31<br />
Operating Income 511 498 408 352 500 476<br />
Non Operating Items 0 0 0 1 0 0<br />
Pre-Tax Income 511 498 408 353 500 476<br />
28
<strong>BNP</strong> PARIBAS – RESULTS AS AT 30 JUNE 2007<br />
In millions of euros<br />
BNL banca commerciale (BPIt at 100 %)<br />
1Q06 2Q06 3Q06 4Q06 1Q07 2Q07<br />
Revenues 597 633 651 638 641<br />
Operating Expenses and Dep. -420 -437 -481 -412 -426<br />
Gross Operating Income 177 196 170 226 215<br />
Provisions -54 -89 -91 -81 -50<br />
Operating Income 123 107 79 145 165<br />
Non Operating Items -17 1 6 0<br />
-1<br />
Pre-Tax Income 106 108 85 145 164<br />
Income Attributable to AMS -2 -1 -1 -2 -1<br />
Pre-Tax Income of Italian Reatil Banking 104 107 84 143 163<br />
BNL banca commerciale (PBIt at 2/3)<br />
Revenues 590 627 644 631 636<br />
Operating Expenses and Dep. -415 -432 -475 -407 -422<br />
Gross Operating Income 175 195 169 224 214<br />
Provisions -54 -89 -91 -81 -50<br />
Operating Income 121 106 78 143 164<br />
Non Operating Items -17 1 6 0<br />
-1<br />
Pre-Tax Income 104 107 84 143 163<br />
In millions of euros 1Q06 2Q06 3Q06 4Q06 1Q07 2Q07<br />
INTERNATIONAL RETAIL BANKING AND FINANCIAL SERVICES<br />
Revenues 1,766 1,825 1,879 1,904 1,919 1,996<br />
Operating Expenses and Dep. -996 -1,017 -1,057 -1,135 -1,098 -1,150<br />
Gross Operating Income 770 808 822 769 821 846<br />
Provisions -153 -185 -221 -163 -202 -240<br />
Operating Income 617 623 601 606 619 606<br />
Associated Companies 20 24 20 -9 19 22<br />
Other Non Operating Items 38 0 4 3 1 8<br />
Pre-Tax Income 675 647 625 600 639 636<br />
BANCWEST<br />
Revenues 577 549 531 534 511 493<br />
Operating Expenses and Dep. -293 -274 -270 -267 -268 -261<br />
Gross Operating Income 284 275 261 267 243 232<br />
Provisions -9 -12 -17 -20 -23 -22<br />
Operating Income 275 263 244 247 220 210<br />
Non Operating Items 0 0 0 1 0 6<br />
Pre-Tax Income 275 263 244 248 220 216<br />
CETELEM<br />
Revenues 639 680 675 690 714 757<br />
Operating Expenses and Dep. -353 -375 -360 -430 -393 -424<br />
Gross Operating Income 286 305 315 260 321 333<br />
Provisions -131 -150 -138 -101 -151 -177<br />
Operating Income 155 155 177 159 170 156<br />
Associated Companies 18 19 14 1 17 23<br />
Other Non Operating Items 37 -1 1 -1 0 0<br />
Pre-Tax Income 210 173 192 159 187 179<br />
29
<strong>BNP</strong> PARIBAS – RESULTS AS AT 30 JUNE 2007<br />
In millions of euros<br />
EMERGING RETAIL BANKING<br />
1Q06 2Q06 3Q06 4Q06 1Q07 2Q07<br />
Revenues 209 221 302 305 305 341<br />
Operating Expenses and Dep. -138 -143 -198 -204 -205 -221<br />
Gross Operating Income 71 78 104 101 100 120<br />
Provisions -3 -10 -51 -22 -11 -16<br />
Operating Income 68 68 53 79 89 104<br />
Associated Companies 0 3 5 -1 4 1<br />
Other Non Operating Items 0 0 2 2 0 1<br />
Pre-Tax Income 68 71 60 80 93 106<br />
EQUIPMENT SOLUTIONS, UCB<br />
Revenues 341 375 371 375 389 405<br />
Operating Expenses and Dep. -212 -225 -229 -234 -232 -244<br />
Gross Operating Income 129 150 142 141 157 161<br />
Provisions -10 -13 -15 -20 -17 -25<br />
Operating Income 119 137 127 121 140 136<br />
Associated Companies 2 2 1 -9 -2 -2<br />
Other Non Operating Items 1 1 1 1 1 1<br />
Pre-Tax Income 122 140 129 113 139 135<br />
In millions of euros 1Q06 2Q06 3Q06 4Q06 1Q07 2Q07<br />
Asset Management and Services<br />
Revenues 1,039 1,126 1,085 1,159 1,267 1,373<br />
Operating Expenses and Dep. -642 -685 -707 -770 -780 -814<br />
Gross Operating Income 397 441 378 389 487 559<br />
Provisions 7 0 -6 -5 -2 0<br />
Operating Income 404 441 372 384 485 559<br />
Associated Companies -1 8 -2 29 7 11<br />
Other Non Operating Items -2 1 0 -3 0 5<br />
Pre-Tax Income 401 450 370 410 492 575<br />
WEALTH AND ASSET MANAGEMENT<br />
Revenues 520 561 536 611 653 715<br />
Operating Expenses and Dep. -347 -362 -364 -427 -429 -442<br />
Gross Operating Income 173 199 172 184 224 273<br />
Provisions 2 -1 -1 -3 -1<br />
0<br />
Operating Income 175 198 171 181 223 273<br />
Associated Companies -1 0 -3 13 5 0<br />
Other Non Operating Items 1 1 0 -4 0 5<br />
Pre-Tax Income 175 199 168 190 228 278<br />
INSURANCE<br />
Revenues 310 323 317 326 353 356<br />
Operating Expenses and Dep. -140 -147 -156 -156 -159 -161<br />
Gross Operating Income 170 176 161 170 194 195<br />
Provisions 5 1 -5 -2 -1 0<br />
Operating Income 175 177 156 168 193 195<br />
Associated Companies 0 8 1 16 2 11<br />
Other Non Operating Items -3 -1 0 1 0 0<br />
Pre-Tax Income 172 184 157 185 195 206<br />
30
<strong>BNP</strong> PARIBAS – RESULTS AS AT 30 JUNE 2007<br />
In millions of euros 1Q06 2Q06 3Q06 4Q06 1Q07 2Q07<br />
SECURITIES SERVICES<br />
Revenues 209 242 232 222 261 302<br />
Operating Expenses and Dep. -155 -176 -187 -187 -192 -211<br />
Gross Operating Income 54 66 45 35 69 91<br />
Provisions 0 0 0 0 0 0<br />
Operating Income 54 66 45 35 69 91<br />
Non Operating Items 0 1 0 0 0 0<br />
Pre-Tax Income 54 67 45 35 69 91<br />
In millions of euros<br />
CORPORATE AND INVESTMENT BANKING<br />
1Q06 2Q06 3Q06 4Q06 1Q07 2Q07<br />
Revenues 2,282 1,999 1,821 1,988 2,396 2,479<br />
Operating Expenses and Dep. -1,244 -1,180 -1,018 -1,031 -1,271 -1,365<br />
Gross Operating Income 1,038 819 803 957 1,125 1,114<br />
Provisions 18 125 87 34 56 59<br />
Operating Income 1,056 944 890 991 1,181 1,173<br />
Associated Companies 1 1 1 7 6 3<br />
Other Non Operating Items 7 29 4 -8 4 68<br />
Pre-Tax Income 1,064 974 895 990 1,191 1,244<br />
ADVISORY AND CAPITAL MARKETS<br />
Revenues 1,623 1,332 1,181 1,260 1,672 1,764<br />
Incl. Equity and Advisory 761 647 503 491 814 826<br />
Incl. Fixed Income 862 685 677 770 858 938<br />
Operating Expenses and Dep. -974 -898 -729 -726 -981 -1,064<br />
Gross Operating Income 649 434 452 534 691 700<br />
Provisions 0 0 0 -16 0 0<br />
Operating Income 649 434 452 518 691 700<br />
Associated Companies 1 1 1 7 6 3<br />
Other Non Operating Items 7 29 3 5 4 19<br />
Pre-Tax Income 657 464 456 530 701 722<br />
FINANCING BUSINESSES<br />
Revenues 659 667 640 728 724 715<br />
Operating Expenses and Dep. -270 -282 -289 -305 -290 -301<br />
Gross Operating Income 389 385 351 423 434 414<br />
Provisions 18 125 87 50 56 59<br />
Operating Income 407 510 438 473 490 473<br />
Non Operating Items 0 0 1 -13 0 49<br />
Pre-Tax Income 407 510 439 460 490 522<br />
In millions of euros 1Q06 2Q06 3Q06 4Q06 1Q07 2Q07<br />
KLEPIERRE<br />
Revenues 75 76 67 125 117 85<br />
Operating Expenses and Dep. -23 -23 -21 -27 -25 -24<br />
Gross Operating Income 52 53 46 98 92 61<br />
Provisions 0 0 0 -3 0<br />
Operating Income 52 53 46 95 92 60<br />
Associated Companies 0 0 0 1 1 0<br />
Other Non Operating Items 0 0 0 0 0 0<br />
Pre-Tax Income 52 53 46 96 93 60<br />
AUTRES ACTIVITES (INCL. <strong>BNP</strong> PARIBAS CAPITAL AND KLEPIERRE)<br />
Revenues 286 261 27 2 541 280<br />
Incl. <strong>BNP</strong> <strong>Paribas</strong> Capital 98 83 53 53 423 208<br />
Operating Expenses and Dep. -78 -76 -100 -296 -103 -154<br />
Incl. BNL restructuring costs 0 0 -10 -141 -23 -61<br />
Gross Operating Income 208 185 -73 -294 438 126<br />
Provisions 43 24 0 -1 1 4<br />
Operating Income 251 209 -73 -295 439 130<br />
Associated Companies 42 25 100 26 95 54<br />
Other Non Operating Items -8 -14 -6 147 -4 -21<br />
Pre-Tax Income 285 220 21 -122 530 163<br />
-1<br />
31
CONTENTS<br />
<strong>BNP</strong> PARIBAS – RESULTS AS AT 30 JUNE 2007<br />
CONSOLIDATED PROFIT AND LOSS ACCOUNT 9<br />
1Q07 - RESULTS BY CORE BUSINESSES 10<br />
1H07 - RESULTS BY CORE BUSINESSES 11<br />
FRENCH RETAIL BANKING 12<br />
BNL banca commerciale 14<br />
INTERNATIONAL RETAIL BANKING AND FINANCIAL SERVICES 16<br />
BANCWEST 16<br />
EMERGING RETAIL BANKING 18<br />
CETELEM 18<br />
EQUIPMENT SOLUTIONS, UCB 19<br />
ASSET MANAGEMENT AND SERVICES 20<br />
WEALTH AND ASSET MANAGEMENT 21<br />
INSURANCE 22<br />
SECURITIES SERVICES 22<br />
CORPORATE AND INVESTMENT BANKING 23<br />
ADVISORY AND CAPITAL MARKETS 23<br />
FINANCING BUSINESSES 24<br />
A SOLID FINANCIAL STRUCTURE 26<br />
BREAK-DOWN OF COMMITMENTS BY INDUSTRY 27<br />
BREAK-DOWN OF COMMITMENTS BY REGION 27<br />
CONTENTS 32<br />
32