Testing for homogeneity of variance
Testing for homogeneity of variance
Testing for homogeneity of variance

Create successful ePaper yourself
Turn your PDF publications into a flip-book with our unique Google optimized e-Paper software.
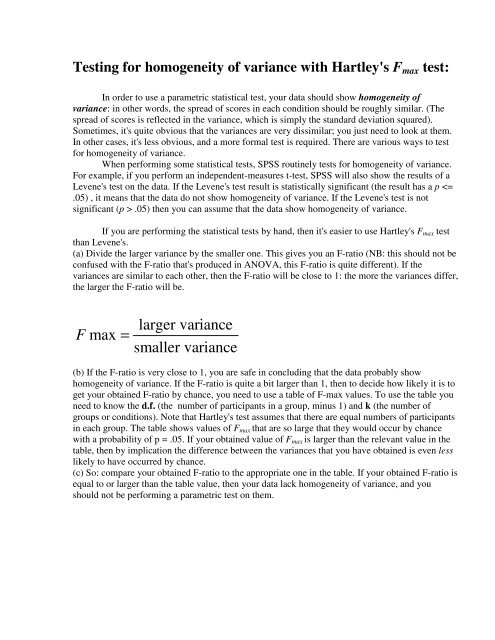
<strong>Testing</strong> <strong>for</strong> <strong>homogeneity</strong> <strong>of</strong> <strong>variance</strong> with Hartley's Fmax test:<br />
In order to use a parametric statistical test, your data should show <strong>homogeneity</strong> <strong>of</strong><br />
<strong>variance</strong>: in other words, the spread <strong>of</strong> scores in each condition should be roughly similar. (The<br />
spread <strong>of</strong> scores is reflected in the <strong>variance</strong>, which is simply the standard deviation squared).<br />
Sometimes, it's quite obvious that the <strong>variance</strong>s are very dissimilar; you just need to look at them.<br />
In other cases, it's less obvious, and a more <strong>for</strong>mal test is required. There are various ways to test<br />
<strong>for</strong> <strong>homogeneity</strong> <strong>of</strong> <strong>variance</strong>.<br />
When per<strong>for</strong>ming some statistical tests, SPSS routinely tests <strong>for</strong> <strong>homogeneity</strong> <strong>of</strong> <strong>variance</strong>.<br />
For example, if you per<strong>for</strong>m an independent-measures t-test, SPSS will also show the results <strong>of</strong> a<br />
Levene's test on the data. If the Levene's test result is statistically significant (the result has a p
k (number <strong>of</strong> groups)<br />
d.f. (number <strong>of</strong> participants<br />
per group - 1) 2 3 4 5 6 7<br />
2 39 87.5 142 202 266 333<br />
3 15.4 27.8 39.2 50.7 62 72.9<br />
4 9.6 15.5 20.6 25.2 29.5 33.6<br />
5 7.15 10.8 13.7 16.3 18.7 20.8<br />
6 5.82 8.38 10.4 12.1 13.7 15<br />
7 4.99 6.94 8.44 9.7 10.8 11.8<br />
8 4.43 6.00 7.18 8.12 9.03 9.8<br />
9 4.03 5.34 6.31 7.11 7.8 8.41<br />
10 3.72 4.85 5.67 6.34 6.92 7.42<br />
12 3.28 4.16 4.79 5.3 5.72 6.09<br />
15 2.86 3.54 4.01 4.37 4.68 4.95<br />
20 2.46 2.95 3.29 3.54 3.76 3.94<br />
30 2.07 2.4 2.61 2.78 2.91 3.02<br />
60 1.67 1.85 1.96 2.04 2.11 2.17<br />
A worked example:<br />
Suppose we do an experiment that has two conditions, A and B. Here are the data.<br />
score: condition:<br />
6 condition A<br />
7 condition A<br />
5 condition A<br />
6 condition A<br />
7 condition A<br />
8 condition A<br />
11 condition B<br />
12 condition B<br />
13 condition B<br />
11 condition B<br />
4 condition B<br />
16 condition B<br />
For condition A, the mean and s.d. are 6.50 and 1.05.<br />
For condition B, the mean and s.d. are 11.17 and 3.97.<br />
We want to run a t-test on these data, but be<strong>for</strong>e doing so, we want to check <strong>for</strong> <strong>homogeneity</strong> <strong>of</strong><br />
<strong>variance</strong>.
The <strong>variance</strong> <strong>for</strong> condition A is 1.05 2 , which is 1.1025.<br />
The <strong>variance</strong> <strong>for</strong> condition B is 3.97 2 , which is 15.7609.<br />
It looks like the <strong>variance</strong> <strong>for</strong> condition B is quite a bit bigger than the <strong>variance</strong> <strong>for</strong> condition A.<br />
Using the Fmax test:<br />
Fmax = 15.7609 / 1.1025 = 14.2956<br />
We have 6 participants per group, and 2 groups, so d.f. = 5 and k = 2. We compare 14.2956 to the<br />
relevant value in the table, which is 7.15. Our obtained F-ratio is larger than the value in the table, and<br />
so we would conclude that the <strong>variance</strong>s are significantly different from each other - i.e. that the data do<br />
not show <strong>homogeneity</strong> <strong>of</strong> <strong>variance</strong>, and there<strong>for</strong>e we should avoid using a parametric test like the t-test.<br />
number <strong>of</strong> groups<br />
number <strong>of</strong> participants per<br />
group - 1 2 3 4 5 6 7<br />
2 39 87.5 142 202 266 333<br />
3 15.4 27.8 39.2 50.7 62 72.9<br />
4 9.6 15.5 20.6 25.2 29.5 33.6<br />
5 7.15 10.8 13.7 16.3 18.7 20.8<br />
6 5.82 8.38 10.4 12.1 13.7 15<br />
7 4.99 6.94 8.44 9.7 10.8 11.8<br />
8 4.43 6 7.18 8.12 9.03 9.8<br />
9 4.03 5.34 6.31 7.11 7.8 8.41<br />
10 3.72 4.85 5.67 6.34 6.92 7.42<br />
12 3.28 4.16 4.79 5.3 5.72 6.09<br />
15 2.86 3.54 4.01 4.37 4.68 4.95<br />
20 2.46 2.95 3.29 3.54 3.76 3.94<br />
30 2.07 2.4 2.61 2.78 2.91 3.02<br />
60 1.67 1.85 1.96 2.04 2.11 2.17