Who benefits from the leverage in LBOs? - Said Business School ...
Who benefits from the leverage in LBOs? - Said Business School ...
Who benefits from the leverage in LBOs? - Said Business School ...

Create successful ePaper yourself
Turn your PDF publications into a flip-book with our unique Google optimized e-Paper software.
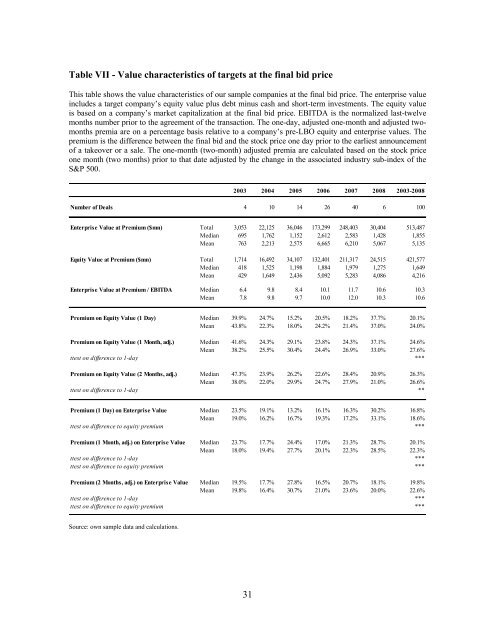
Table VII - Value characteristics of targets at <strong>the</strong> f<strong>in</strong>al bid price<br />
This table shows <strong>the</strong> value characteristics of our sample companies at <strong>the</strong> f<strong>in</strong>al bid price. The enterprise value<br />
<strong>in</strong>cludes a target company’s equity value plus debt m<strong>in</strong>us cash and short-term <strong>in</strong>vestments. The equity value<br />
is based on a company’s market capitalization at <strong>the</strong> f<strong>in</strong>al bid price. EBITDA is <strong>the</strong> normalized last-twelve<br />
months number prior to <strong>the</strong> agreement of <strong>the</strong> transaction. The one-day, adjusted one-month and adjusted twomonths<br />
premia are on a percentage basis relative to a company’s pre-LBO equity and enterprise values. The<br />
premium is <strong>the</strong> difference between <strong>the</strong> f<strong>in</strong>al bid and <strong>the</strong> stock price one day prior to <strong>the</strong> earliest announcement<br />
of a takeover or a sale. The one-month (two-month) adjusted premia are calculated based on <strong>the</strong> stock price<br />
one month (two months) prior to that date adjusted by <strong>the</strong> change <strong>in</strong> <strong>the</strong> associated <strong>in</strong>dustry sub-<strong>in</strong>dex of <strong>the</strong><br />
S&P 500.<br />
Source: own sample data and calculations.<br />
2003 2004 2005 2006 2007 2008 2003-2008<br />
Number of Deals 4 10 14 26 40 6 100<br />
Enterprise Value at Premium ($mn) Total 3,053 22,125 36,046 173,299 248,403 30,404 513,487<br />
Median 695 1,762 1,152 2,612 2,583 1,428 1,855<br />
Mean 763 2,213 2,575 6,665 6,210 5,067 5,135<br />
Equity Value at Premium ($mn) Total 1,714 16,492 34,107 132,401 211,317 24,515 421,577<br />
Median 418 1,525 1,198 1,884 1,979 1,275 1,649<br />
Mean 429 1,649 2,436 5,092 5,283 4,086 4,216<br />
Enterprise Value at Premium / EBITDA Median 6.4 9.8 8.4 10.1 11.7 10.6 10.3<br />
Mean 7.8 9.8 9.7 10.0 12.0 10.3 10.6<br />
Premium on Equity Value (1 Day) Median 39.9% 24.7% 15.2% 20.5% 18.2% 37.7% 20.1%<br />
Mean 43.8% 22.3% 18.0% 24.2% 21.4% 37.0% 24.0%<br />
Premium on Equity Value (1 Month, adj.) Median 41.6% 24.3% 29.1% 23.8% 24.3% 37.1% 24.6%<br />
Mean 38.2% 25.5% 30.4% 24.4% 26.9% 33.0% 27.6%<br />
ttest on difference to 1-day ***<br />
Premium on Equity Value (2 Months, adj.) Median 47.3% 23.9% 26.2% 22.6% 28.4% 20.9% 26.3%<br />
Mean 38.0% 22.0% 29.9% 24.7% 27.9% 21.0% 26.6%<br />
ttest on difference to 1-day **<br />
Premium (1 Day) on Enterprise Value Median 23.5% 19.1% 13.2% 16.1% 16.3% 30.2% 16.8%<br />
Mean 19.0% 16.2% 16.7% 19.3% 17.2% 33.1% 18.6%<br />
ttest on difference to equity premium ***<br />
Premium (1 Month, adj.) on Enterprise Value Median 23.7% 17.7% 24.4% 17.0% 21.3% 28.7% 20.1%<br />
Mean 18.0% 19.4% 27.7% 20.1% 22.3% 28.5% 22.3%<br />
ttest on difference to 1-day ***<br />
ttest on difference to equity premium ***<br />
Premium (2 Months, adj.) on Enterprise Value Median 19.5% 17.7% 27.8% 16.5% 20.7% 18.1% 19.8%<br />
Mean 19.8% 16.4% 30.7% 21.0% 23.6% 20.0% 22.6%<br />
ttest on difference to 1-day ***<br />
ttest on difference to equity premium ***<br />
31