Who benefits from the leverage in LBOs? - Said Business School ...
Who benefits from the leverage in LBOs? - Said Business School ...
Who benefits from the leverage in LBOs? - Said Business School ...

Create successful ePaper yourself
Turn your PDF publications into a flip-book with our unique Google optimized e-Paper software.
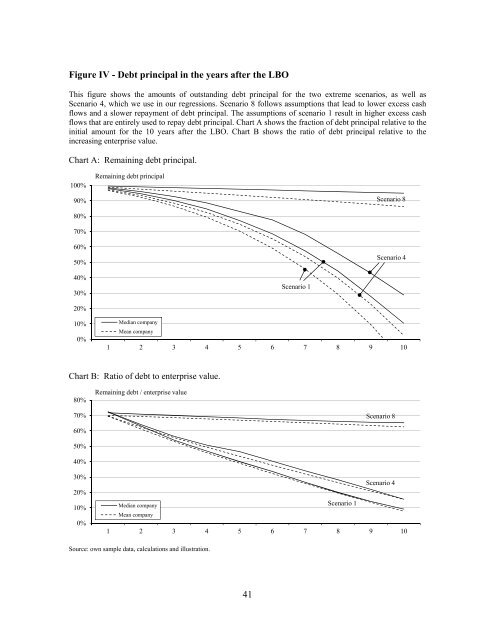
Figure IV - Debt pr<strong>in</strong>cipal <strong>in</strong> <strong>the</strong> years after <strong>the</strong> LBO<br />
This figure shows <strong>the</strong> amounts of outstand<strong>in</strong>g debt pr<strong>in</strong>cipal for <strong>the</strong> two extreme scenarios, as well as<br />
Scenario 4, which we use <strong>in</strong> our regressions. Scenario 8 follows assumptions that lead to lower excess cash<br />
flows and a slower repayment of debt pr<strong>in</strong>cipal. The assumptions of scenario 1 result <strong>in</strong> higher excess cash<br />
flows that are entirely used to repay debt pr<strong>in</strong>cipal. Chart A shows <strong>the</strong> fraction of debt pr<strong>in</strong>cipal relative to <strong>the</strong><br />
<strong>in</strong>itial amount for <strong>the</strong> 10 years after <strong>the</strong> LBO. Chart B shows <strong>the</strong> ratio of debt pr<strong>in</strong>cipal relative to <strong>the</strong><br />
<strong>in</strong>creas<strong>in</strong>g enterprise value.<br />
Chart A: Rema<strong>in</strong><strong>in</strong>g debt pr<strong>in</strong>cipal.<br />
100%<br />
90%<br />
80%<br />
70%<br />
60%<br />
50%<br />
40%<br />
30%<br />
20%<br />
10%<br />
0%<br />
Chart B: Ratio of debt to enterprise value.<br />
80%<br />
70%<br />
60%<br />
50%<br />
40%<br />
30%<br />
20%<br />
10%<br />
0%<br />
Rema<strong>in</strong><strong>in</strong>g debt pr<strong>in</strong>cipal<br />
Median company<br />
Mean company<br />
1 2 3 4 5 6 7 8 9 10<br />
Rema<strong>in</strong><strong>in</strong>g debt / enterprise value<br />
Median company<br />
Mean company<br />
Source: own sample data, calculations and illustration.<br />
41<br />
Scenario 1<br />
Scenario 1<br />
Scenario 8<br />
Scenario 4<br />
Scenario 8<br />
Scenario 4<br />
1 2 3 4 5 6 7 8 9 10