Practical Leadership Tools for Equitable and Excellent Schools
Practical Leadership Tools for Equitable and Excellent Schools
Practical Leadership Tools for Equitable and Excellent Schools

You also want an ePaper? Increase the reach of your titles
YUMPU automatically turns print PDFs into web optimized ePapers that Google loves.
Educational Equity Profiles:<br />
<strong>Practical</strong> <strong>Leadership</strong> <strong>Tools</strong> <strong>for</strong> <strong>Equitable</strong> <strong>and</strong> <strong>Excellent</strong> <strong>Schools</strong><br />
(DRAFT <strong>for</strong> COMMENT, August 2002)<br />
Linda Skrla<br />
Educational Administration <strong>and</strong> Human Resource Development Department<br />
Texas A&M University<br />
Juanita Garcia<br />
Department of Educational Administration<br />
The University of Texas at Austin<br />
James Joseph Scheurich<br />
Department of Educational Administration<br />
The University of Texas at Austin<br />
Glenn Nolly<br />
Austin Independent School District<br />
Austin, Texas<br />
Paper presented at the convention of the National Council of Professors of Educational Administration, Burlington,<br />
VT. Comments should be addressed to the first author at: EAHR Department, 4226 TAMU, Texas A&M<br />
University, College Station, TX 77843-4226. Email: lskrla@tamu.edu<br />
1
Educational Equity Profiles:<br />
<strong>Practical</strong> <strong>Leadership</strong> <strong>Tools</strong> <strong>for</strong> <strong>Equitable</strong> <strong>and</strong> <strong>Excellent</strong> <strong>Schools</strong><br />
For a long time, schools assumed that whether or not their students learned, business as usual would<br />
continue <strong>for</strong>ever. If that assumption has not yet changed, it will soon. (U.S. Department of Education,<br />
2002a, p. 8)<br />
Introduction<br />
The No Child Left Behind Act of 2001(NCLB) was signed into law on January 8, 2002, putting into motion<br />
what has been described as the most sweeping re<strong>for</strong>m of U.S. federal education policy since the 1960s. At the<br />
center of this legislation is a potentially revolutionary premise—the explicit, direct commitment of the federal<br />
government that the achievement gaps that have long existed between the school per<strong>for</strong>mance white <strong>and</strong> middle-<br />
<strong>and</strong> upper-income children <strong>and</strong> that of children of color <strong>and</strong> children from low income homes are unacceptable <strong>and</strong><br />
must be eliminated. Given the terrible racial history of this country <strong>and</strong> the deeply-rooted inequality <strong>and</strong> injustice in<br />
its educational system, there is, of course, strong suspicion among many—scholars, policymakers, community<br />
activists, <strong>and</strong> practitioners alike—that this revolutionary potential may be symbolic at best or a sham at worst.<br />
Nonetheless, this legislation has become law, <strong>and</strong> its implementation provisions will hold schools, districts, <strong>and</strong><br />
states accountable <strong>for</strong> reducing the race <strong>and</strong> class differences in the academic success of their students.<br />
As we have learned from studies of implementation of earlier generations of accountability policy, equally<br />
strong potential exists <strong>for</strong> both positive <strong>and</strong> negative effects on educational equity (Keating, 2000). Furthermore, the<br />
key to positively appropriating the equity potential of such policy m<strong>and</strong>ates often lies in the specific responses of<br />
school leaders <strong>and</strong> the particular uses to which they put the data derived from accountability systems (Donmoyer &<br />
Garcia Wagstaff, 1990; Hall, 2002; Nolly, 1997; Skrla & Scheurich, 2001). The purpose of this paper is to increase<br />
the likelihood of such equity-positive leadership responses within the context of increasingly high stakes<br />
accountability by proposing a new tool <strong>for</strong> school leaders to use in their equity-focused work: an educational equity<br />
profile. 1 We begin with a brief discussion of the current accountability context in which this equity tool is designed<br />
to operate. This is followed by a history of the concept of equity auditing, from which the idea of educational equity<br />
profiles is derived. We then outline the components of our prototype profile, discuss the next steps <strong>for</strong> our project,<br />
<strong>and</strong> make some concluding comments.<br />
Equity <strong>and</strong> Accountability 2002<br />
The mechanisms by which the NCLB Act proposes to accomplish the closing of historic achievement gaps<br />
rely heavily on increased accountability:<br />
The NCLB Act will strengthen Title I accountability by requiring States to implement statewide<br />
accountability systems covering all public schools <strong>and</strong> students. These systems must be based on<br />
challenging State st<strong>and</strong>ards in reading <strong>and</strong> mathematics, annual testing <strong>for</strong> all students in grades 3-8, <strong>and</strong><br />
annual statewide progress objectives ensuring that all groups of students reach proficiency within 12 years.<br />
Assessment results <strong>and</strong> State progress objectives must be broken out by poverty, race, ethnicity, disability,<br />
<strong>and</strong> limited English proficiency to ensure that no group is left behind. School districts <strong>and</strong> schools that fail<br />
to make adequate yearly progress (AYP) toward statewide proficiency goals will, over time, be subject to<br />
2
improvement, corrective action, <strong>and</strong> restructuring measures aimed at getting them back on course to meet<br />
State st<strong>and</strong>ards. (U.S. Department of Education, 2002b, 4)<br />
As described in the NCLB Act executive summary quoted above, the required development of state st<strong>and</strong>ards, annual<br />
testing, disaggregation of data, <strong>and</strong> adequate yearly progress will <strong>for</strong>ce all states to follow the same path that states<br />
such as Texas, North Carolina, Virginia, <strong>and</strong> other states have been following <strong>for</strong> the past ten years. These are<br />
among the states most often cited as exemplars of progress in closing historic achievement gaps, though such<br />
progress has been strongly contested by some scholars <strong>and</strong> educators (e.g., Anderson, 2001; Haney, 2001; Klein,<br />
2001; Trueba, 2001; Valencia, Valenzuela, Sloan, & Foley, 2001). In spite of such contestation of the progress in<br />
these states, however, the U.S Department of Education’s goal in requiring all states to follow similar paths is clear:<br />
to use accountability policy that is directly based on race <strong>and</strong> class disaggregation <strong>and</strong> on a constant decrease in the<br />
related achievement gaps as a vehicle to increase educational equity.<br />
As we have argued in other places, the debate about the educational equity effects of such accountability<br />
policy has tended to be polarized between two camps with each claiming that the effects of accountability policy on<br />
education equity are either all good or all bad (Skrla, 2001a; Scheurich, Skrla, & Johnson, 2000). As we have also<br />
repeatedly argued, the relationships between accountability <strong>and</strong> equity are, in our view, extremely complex <strong>and</strong><br />
dynamic (changing each year due to annual changes in state policies), <strong>and</strong> the relationship has varied depending on<br />
each state’s particular accountability policy system. Consequently, this state-by-state dynamic complexity requires<br />
careful <strong>and</strong> respectful debate, including consideration of data indicating opposite effects, <strong>and</strong> an openness to<br />
different points of view (see, <strong>for</strong> example Scheurich & Skrla, 2001; Skrla, Scheurich, Johnson, & Koschoreck,<br />
2002a, 2002b).<br />
Over the past several years, we have participated in several of these accountability debates in person in<br />
settings such as the annual conventions of the University Council of Educational Administration <strong>and</strong> the American<br />
Educational Research Association <strong>and</strong> in print in journals such as Phi Delta Kappan, Education <strong>and</strong> Urban Society,<br />
International Journal of <strong>Leadership</strong> in Education, <strong>and</strong> Educational Researcher. In these venues, we’ve been very<br />
clear about our support <strong>for</strong> some aspects of accountability policy because of the positive effects of these aspects on<br />
educational equity in several areas, including:<br />
• Providing a common set of expectations <strong>for</strong> student achievement <strong>for</strong> all student groups that is not based on<br />
deficit assumptions;<br />
• Focusing attention on achievement gaps;<br />
• Providing publicly available data <strong>for</strong> use by civic <strong>and</strong> community activists;<br />
• Forcing district <strong>and</strong> school leaders to assume responsibility <strong>for</strong> educating equitably all students; <strong>and</strong><br />
• Initiating school improvement through adoption of productive practices such as curriculum alignment, high<br />
quality staff development, multicultural curricula, <strong>and</strong> culturally relevant pedagogy, among others.<br />
From numerous exchanges with our critics (see Anderson, 2001; Haney, 2001; Klein, 2001; Sclafani, 2001; Trueba,<br />
2001; Valencia et al., 2001) <strong>and</strong> from our own research, however, we’ve also gained a more nuanced underst<strong>and</strong>ing<br />
of <strong>and</strong> appreciation <strong>for</strong> the fact that accountability policy alone is not enough to support the broad-scale<br />
3
improvement of educational practices that will be required to close historic achievement gaps in every school in<br />
every district across the U.S.<br />
For example, as Walt Haney (2001) has compellingly argued, reducing school dropout rates is as critically<br />
important to achieving educational equity as is increasing student achievement. Additionally, as Valencia et al.<br />
(2001) pointed out, teacher quality is a highly significant factor that determines the equitability of schooling that<br />
children receive. Also, Larry Parker (2001) has argued that issues of overrepresentation of children of color in<br />
special education <strong>and</strong> differential educational progress between African American boys <strong>and</strong> girls are critical issues<br />
that influence the degree of equity in schooling.<br />
Our view of the relationship between accountability <strong>and</strong> educational equity, then, has evolved. While, to<br />
us, accountability remains an extremely powerful <strong>and</strong> important <strong>for</strong>ce in the struggle <strong>for</strong> education equity, it is but<br />
one part of a larger system of schooling practices characterized by equity <strong>and</strong> inequity that is expressed in multiple<br />
dimensions. Thus, in order to close achievement gaps <strong>and</strong> educate equitably all children, systemic equity will be<br />
required. Scott (2001) provided a useful definition of systemic equity:<br />
Systemic equity is defined as the trans<strong>for</strong>med ways in which systems <strong>and</strong> individuals habitually operate to<br />
ensure that every learner—in whatever learning environment that learner is found—has the greatest<br />
opportunity to learn enhanced by the resources <strong>and</strong> supports necessary to achieve competence, excellence,<br />
independence, responsibility, <strong>and</strong> self-sufficiency <strong>for</strong> school <strong>and</strong> <strong>for</strong> life. (6)<br />
The accomplishment of such systemic equity will require the development of new tools <strong>for</strong> educators to use to<br />
assess not only achievement gaps but resource <strong>and</strong> opportunity gaps as well.<br />
School leaders <strong>and</strong> others must have access to tools to use in developing more comprehensive<br />
underst<strong>and</strong>ing of equity <strong>and</strong> inequity relationships in their current systems to guide future planning, implementation,<br />
<strong>and</strong> evaluation. Consequently, we are proposing a model <strong>for</strong> such a tool—an educational equity profile—that has its<br />
roots in U.S. educational <strong>and</strong> civil rights history, but which has been designed <strong>and</strong> streamlined to be of maximum<br />
utility in the current climate of high stakes accountability <strong>and</strong> ready availability of data.<br />
Historical Background of Educational Equity Profiles<br />
The idea of using an educational equity profile as a leadership tool to guide schools in working toward<br />
equity <strong>and</strong> excellence is based on the concept of equity auditing, a more elaborate process that has history in at least<br />
three areas of research literature: civil rights, curriculum auditing, <strong>and</strong> state accountability. The terminology equity<br />
audit (also known as a representivity audit) has a deep history in civil rights en<strong>for</strong>cement in the U.S. <strong>and</strong> other<br />
nations (<strong>for</strong> example, Scotl<strong>and</strong>, Great Britain, <strong>and</strong> Australia) in a variety of arenas including, but not limited to,<br />
education. For example, corporations <strong>and</strong> governmental entities commonly conduct (or are subject to) employment<br />
equity audits, health equity audits, pay equity audits, gender equity audits, <strong>and</strong> technology equity audits, among<br />
others.<br />
In the U.S. educational arena, specifically, equity audits of school districts have been conducted by school<br />
districts (either voluntarily or under pressure by civic activists or ordered by the U.S. Department of Education<br />
Office of Civil Rights) as a way of determining the degree of compliance with a number of civil rights statutes that<br />
prohibit discrimination in educational programs <strong>and</strong> activities receiving federal funding. These statutes include:<br />
4
Title VI of the Civil Rights Act of 1964 (prohibiting race, color, <strong>and</strong> national origin discrimination); Title<br />
IX of the Education Amendments of 1972 (prohibiting sex discrimination); Section 504 of the<br />
Rehabilitation Act of 1973 (prohibiting disability discrimination); Title II of the Americans with<br />
Disabilities Act of 1990 (prohibiting disability discrimination by public entities); <strong>and</strong> the Age<br />
Discrimination Act of 1975 (prohibiting age discrimination). (U.S. Department of Education, 1999, 1)<br />
Equity audits of school districts focused on compliance with these federal civil rights acts have tended to be<br />
exhaustive <strong>and</strong> have typically produced voluminous reports. Civil rights-based equity audits have been conducted in<br />
recent years by educational consultants such as Harvard’s Robert Peterkin in school districts around the country<br />
including Urbana, Illinois; Ann Arbor, Michigan; Harrison, Colorado; <strong>and</strong> Albuquerque, New Mexico.<br />
In addition to their utility in the civil rights arena, equity audits have also been used in conjunction with<br />
curriculum audits. William Poston (1992) <strong>and</strong> Jacqueline Mitchell, in collaboration with Poston (1992), described a<br />
design <strong>for</strong> school equity audits that was an adaptation of one st<strong>and</strong>ard area in a design <strong>for</strong> more comprehensive<br />
school curriculum audits developed by Fenwick English (1988). Drawing from <strong>and</strong> exp<strong>and</strong>ing on curriculum audit<br />
St<strong>and</strong>ard 3: “A School System Demonstrates Internal Connectivity <strong>and</strong> Rational Equity in its Program Development<br />
<strong>and</strong> Implementation,” Poston proposed fifteen areas of analysis <strong>for</strong> use in equity audits. These areas included:<br />
administrative <strong>and</strong> supervisory practices; course offerings <strong>and</strong> access; financial <strong>and</strong> funding resources; individual<br />
difference considerations; materials <strong>and</strong> facilities; special program <strong>and</strong> services delivery; student management<br />
practices; class size practices; demographic distribution; grouping practices <strong>and</strong> instruction; instructional time<br />
utilization; promotion <strong>and</strong> retention practices; staff development <strong>and</strong> training; support services provision; <strong>and</strong><br />
teacher assignment <strong>and</strong> work load (p. 236). Poston <strong>and</strong> Mitchell published one report of the application of this<br />
equity audit to case studies in three school district in 1992, but there has been no further published research on this<br />
method since that time.<br />
A third place area in which equity audits have been used is as part of state school re<strong>for</strong>m <strong>and</strong> accountability<br />
ef<strong>for</strong>ts. Over the past decade, several state departments of education have developed instruments to evaluate equity<br />
levels in school districts in their state. These instruments have varied widely in design. Some, Kentucky’s <strong>for</strong><br />
example, have been based in part on the logic of curriculum audits (Kentucky Department of Education, 1999;<br />
Steffy, 1993). Washington State’s Equity Self-Evaluation <strong>and</strong> Planning Documentation instrument was developed<br />
in 1993 by a task <strong>for</strong>ce <strong>and</strong> is mainly data based (State of Washington, 1995). Since 1992, the State of Iowa has<br />
conducted on site equity reviews of 13 to 14 school districts per year. These reviews are extensive <strong>and</strong> include<br />
interviews as well as reviews of 15 categories of documents including such items as board policy books, master<br />
schedules <strong>for</strong> teachers <strong>and</strong> students, <strong>and</strong> school improvement plans.<br />
These three streams of history <strong>for</strong> the concept of equity audits converge to create a potentially useful site to<br />
leverage educational equity in the present climate of federally m<strong>and</strong>ated, high stakes educational re<strong>for</strong>m. As states,<br />
districts, <strong>and</strong> individual schools grapple with new requirements that they assess students, use disaggregated data, <strong>and</strong><br />
demonstrate progress in closing achievement gaps, there will be a great need <strong>for</strong> new tools <strong>for</strong> school leaders to use<br />
to underst<strong>and</strong> the results of the systems in place in their districts <strong>and</strong> campuses. Existing versions of equity audits<br />
(whether based on civil rights, curriculum auditing, or state accountability) produce enormous amounts of data.<br />
5
While such detailed examination of macro- <strong>and</strong> micro- practices of schools <strong>and</strong> districts is highly useful in certain<br />
circumstances, it also limits the utility of the results of such an audit. Few people in a district or school (<strong>and</strong> even<br />
fewer parents or community members) will have the time, expertise, or motivation to read through a document 200<br />
or 300 pages in length.<br />
What we propose—educational equity profiles—are alternate, more focused descendents of equity audits,<br />
that would supplement, rather than supplant, the longer, more detailed varieties currently in use. What is needed is a<br />
way <strong>for</strong> school leaders <strong>and</strong> others to have data <strong>for</strong> their district displayed in a clear <strong>and</strong> underst<strong>and</strong>able way that<br />
reveals the levels of equity <strong>and</strong> inequity produced by their system of schooling. With ever increasing amounts of<br />
data being generated by state accountability systems <strong>and</strong> local district research ef<strong>for</strong>ts, there is a large need <strong>for</strong> tools<br />
that will reduce some of the complexity of these results without stripping them of their utility <strong>for</strong> planning <strong>and</strong><br />
evaluation.<br />
Prototype of an Educational Equity Profile<br />
In our work as professors <strong>and</strong> practitioners of educational administration, we interact constantly with<br />
master’s <strong>and</strong> doctoral students, teachers, administrators, board members, community members, <strong>and</strong> policy makers.<br />
In our discussions with these individuals <strong>and</strong> groups about issues of educational equity <strong>and</strong> accountability, we<br />
commonly hear the comment that “everybody knows this”—meaning that the evidence of systemic inequity among<br />
student groups in opportunity <strong>and</strong> achievement are well understood by the people working in <strong>and</strong> connected with<br />
schools. Our experience is, in reality, just the opposite. Despite a decade or more of working within a context of<br />
increasingly high stakes accountability that produces growing amounts of data about their schools, administrators<br />
<strong>and</strong> teachers we work with, overwhelmingly, do not have an clear or accurate underst<strong>and</strong>ing of the degree of<br />
inequity present in their own schools <strong>and</strong> school districts. Other researchers have also found that, in typical school<br />
settings, teachers <strong>and</strong> administrators routinely avoid overt discussions of race as a factor in inequitable school<br />
outcomes (Pollock, 2001). Furthermore, it is typical that when these educators are queried about why children of<br />
color <strong>and</strong> children from low income homes do not do well in school, they cite factors external to schooling, blaming<br />
factors such as the children’s homes, their neighborhoods, <strong>and</strong> even their genetics (McKenzie, 2001; Valencia,<br />
1997).<br />
In order <strong>for</strong> teachers <strong>and</strong> administrators to work against such deficit assumptions about the educability of<br />
the children in their schools, they must come to recognize the magnitude, the extent, <strong>and</strong> the systemic nature of the<br />
inequities present in their current practices. We recognize the complexity of the task of getting mainly white<br />
teachers <strong>and</strong> administrators to incorporate new perspectives into predominately deficit assumptions, as Sleeter<br />
(1996) has pointed out in the context of teaching teachers about multicultural education:<br />
Many educators conceptualize this task as helping [teachers] "unlearn" negative attitudes about race,<br />
develop positive attitudes <strong>and</strong> a knowledge base about race <strong>and</strong> various racial groups, <strong>and</strong> learn<br />
multicultural teaching strategies. . . .This the task is more complex than that. . . .They integrate in<strong>for</strong>mation<br />
about race provided in multicultural teacher education programs into the knowledge they already have,<br />
much more than they reconstruct that knowledge. (p. 65)<br />
6
Because of the complexity <strong>and</strong> the difficulty of this type of task, practical <strong>and</strong> assessable tools can be highly useful.<br />
Thus our prototype educational equity profile is intended to be used to promote discussion of <strong>and</strong> substantive<br />
response to systemic patterns of inequity in schools <strong>and</strong> school districts. We suggest a manageable set of key<br />
indicators that, together, will <strong>for</strong>m a straight<strong>for</strong>ward initial profile of educational equity levels in schools. After<br />
considering the types of indicators available (from equity audits <strong>and</strong> from state accountability systems), we’ve come<br />
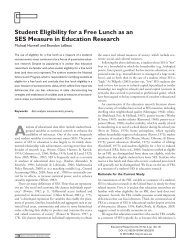
up with a set of 12 indicators grouped into three categories <strong>for</strong> our prototype educational equity profile. These three<br />
dimensions are teacher quality equity, programmatic equity, <strong>and</strong> achievement equity. These three areas of equity are<br />
inextricably linked in our schools. They can even be conceptualized as additive, or productive of one another, as<br />
illustrated in Figure 1 below.<br />
Teacher<br />
Quality Equity<br />
Figure 1<br />
+<br />
Programmatic<br />
Equity<br />
=<br />
Each of the three areas is described in more detail <strong>and</strong> examples are provided <strong>for</strong> each dimension in the following<br />
section.<br />
Teacher Quality Equity<br />
There is growing consensus among researchers <strong>and</strong> practitioners that high quality teachers are key<br />
determinants of students' opportunities to be academically successful (Ferguson, 1998; Darling-Hammond, 1999).<br />
Determining what teacher quality is <strong>and</strong> how to measure it, of course, is a complicated issue. Tennessee, <strong>for</strong><br />
example, has chosen to define it as “value added”—the contribution each teacher makes to students’ st<strong>and</strong>ardized<br />
test per<strong>for</strong>mance. This narrow definition has received considerable critique, <strong>and</strong> other states have not yet followed<br />
this path. Other indicators that serve as proxies <strong>for</strong> evidence of teacher quality, such as experience <strong>and</strong> training, are<br />
commonly used. There is ample evidence that access to quality teachers defined by such indicators is not typically<br />
distributed on an equitable basis to all schools within a district, nor to all students within individual schools.<br />
Students of color <strong>and</strong> students from low income homes, historically, have less experienced teachers, teachers with<br />
less <strong>for</strong>mal education <strong>and</strong> training, <strong>and</strong> more teachers teaching without certification <strong>and</strong>/or outside their area of<br />
expertise (Ingersoll, 1999)<br />
For a school district, then, evidence of teacher quality equity would result from an examination of the<br />
distribution throughout the schools in the district of teacher quality. Four indicators <strong>for</strong> which data should be<br />
available from state <strong>and</strong> local sources are:<br />
• Teacher education (bachelor’s, master’s, & doctoral degrees)<br />
• Teacher experience<br />
• Teacher mobility<br />
Achievement<br />
Equity<br />
7
• Teachers without certification or assigned outside area of expertise<br />
At the district level, then, the central question would be what is the degree to which these indicators are distributed<br />
equitably among the campuses within the district. In other words, do the schools serving primarily low income<br />
students have the same percentage of teachers holding master’s degrees or higher, the same percentage of<br />
experienced teachers, the same teacher mobility rate, <strong>and</strong> the same percent of uncertified teachers <strong>and</strong> teachers<br />
teaching outside their areas of expertise as do schools serving primarily children from middle- <strong>and</strong> upper-income<br />
homes? Different districts will have relatively greater or lesser degrees of all of the these factors due to geography,<br />
finances, <strong>and</strong> other factors—but this area of the educational equity profile asks to what extent are these resources<br />
passed out equitably among the district’s schools. Mitchell <strong>and</strong> Poston (1992) suggested in their proposal <strong>for</strong> more<br />
comprehensive equity audits that campuses that differed from district averages by more than 20% were indications<br />
of inequity. We would suggest, depending on the size of the school district, that a higher st<strong>and</strong>ard—perhaps 10%<br />
deviation from the district average—would be appropriate <strong>for</strong> this section of the educational equity profile.<br />
For example, let’s take a district of 50,000 students. A district this size will have numerous elementary<br />
schools. Suppose we look at three of the schools serving families with the lowest incomes <strong>and</strong> three serving<br />
families with the highest incomes. If we look, then, at the distribution of teachers by teacher education level, are the<br />
teachers at the high income schools significantly more educated than those at the low income schools? Is there more<br />
mobility of teachers in the low income schools? Are there more teachers teaching outside their area of expertise or<br />
without certification at the low income schools? Are the teachers at the high income schools generally more<br />
experienced than those at the low income schools? What we have found, especially in larger districts, is that there is<br />
considerable teacher quality inequity that is a taken <strong>for</strong> granted <strong>and</strong> thus never pointed out as a “cause” of the<br />
achievement gaps in a district.<br />
However, it is not enough to look at this just across districts. These same kind of patterns often exist within<br />
schools. Are the Advanced Placement <strong>and</strong> Gifted <strong>and</strong> Talented classes at the higher grades taught by the more<br />
educated, more experienced, more stable teachers, while the main classes or lower track classes or the lower grade<br />
classes taught be the least educated, least experienced, more mobile teachers? Again, we have frequently found,<br />
especially in larger schools, that there are these kind of taken <strong>for</strong> granted teacher assignments that no one points out<br />
as a possible cause of achievement gaps.<br />
Programmatic Equity<br />
Equally as important as teacher quality is the quality of the instructional programs in which students are<br />
placed (or removed from access to). Though educators would like to pretend otherwise, there are large variations of<br />
quality among different placements <strong>and</strong> programs within schools <strong>and</strong> school districts (see, <strong>for</strong> example, Schoenfeld,<br />
2002, <strong>for</strong> an excellent discussion of difference in quality of math programs). The potential indicators <strong>for</strong> the<br />
educational equity profile in this category are numerous, but we’ve identified four key areas that research has<br />
consistently shown to be significant sites of inequity. These four are:<br />
• special education<br />
• gifted <strong>and</strong> talented education<br />
• bilingual education<br />
8
• student discipline<br />
Over-assignment of students of color <strong>and</strong> students from low income homes to special education, especially the most<br />
severe categories of disability, has long been recognized as an area of gross inequity within our school systems<br />
(Artiles, 1998; MacMillan & Reschly, 1998). Additionally, high stakes accountability systems have placed more<br />
pressure on educators to identify students <strong>for</strong> special education in order to exempt them from testing. This makes<br />
special education an essential indicator in the programmatic equity category.<br />
The problem of over-representation in special education is mirrored in reverse in programs <strong>for</strong> the<br />
education of gifted <strong>and</strong> talented students (Ford & Harmon, 2001). Students of color <strong>and</strong> students from low-income<br />
homes are grossly under-represented in the ranks of the students identified as gifted <strong>and</strong> talented. Rates of G/T<br />
identification vary greatly among school districts, with some serving less than 5% of children in this category <strong>and</strong><br />
others serving upwards of 12%. Regardless of the rate, however, the indicator <strong>for</strong> the equity profile is whether all<br />
student groups are represented in proportionate numbers.<br />
Here is a typical example illustrated by Figure 2 below. These data are taken from an urban district with<br />
which are familiar. The district has about 50,000 students with 4,650 in G/T courses districtwide or 9.3% of their<br />
student population. About 73.0% of these students or 36,500 come from low-income families. However, there are<br />
only 734 students from these low-income families in G/T courses in this district. This means that though 73% of the<br />
districts students come from low income families, only 15.8% of G/T students come from low-income homes . As a<br />
result, students from low-income families are considerably under-represented (about one-fifth of what would be<br />
proportional) in G/T classes. This is an inequity pattern in this district.<br />
All Students Students Not from Low-<br />
Income Homes<br />
Students in District 50,000 13,500 36,500<br />
G/T Students 4,650 3,916 734<br />
Figure 2<br />
Students from Low-<br />
Income Homes<br />
A third indicator <strong>for</strong> the programmatic equity category is progress of students served through bilingual<br />
education. As growing numbers of culturally <strong>and</strong> linguistically diverse students enroll in our schools, it becomes<br />
ever more important to assess the quality of bilingual instruction they receive. Un<strong>for</strong>tunately, in the past bilingual<br />
programs have all to often been language ghettos where students were segregated <strong>and</strong> neither became proficient in<br />
English nor progressed academically in their first language (Moll, 1992). Texas has recently begun including on its<br />
Academic Excellence Indicator System reports <strong>for</strong> each district the progress of English language learners on the<br />
state test of reading proficiency in English. This indicator (or other, similar indicators in other states) would help<br />
monitor whether on not students in bilingual students are being served appropriately as opposed to simply<br />
warehoused.<br />
9
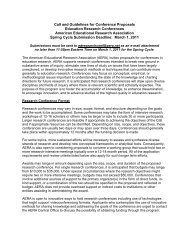
Though discipline may seem an odd fit with the other three categories, it seems clear that students who are<br />
routinely <strong>and</strong> consistently caught up in the discipline system are removed from their regular classes <strong>and</strong> denied<br />
access to the curriculum. For some students (particularly African American <strong>and</strong> Latino boys), the disciplinary<br />
system in their school becomes their de facto instructional program since that is where they spend the majority of<br />
their time.<br />
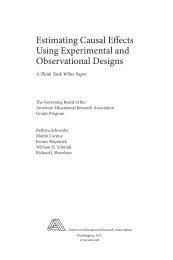
Figure 3<br />
Above is an example based on real data <strong>for</strong> the 2001-2002 school year from a 1,300 student high school.<br />
African American males received discipline (all categories of from minor to severe have been combined) at a rate<br />
40<br />
35<br />
30<br />
25<br />
20<br />
15<br />
10<br />
5<br />
0<br />
that is nearly three times their proportional representation in the student population. For Hispanic males the rate is<br />
more than four times their proportional representation. Clearly, this high school has an inequitable situation with<br />
respect to discipline.<br />
Achievement Equity<br />
35<br />
Achievement is perhaps the category that has received the most recent attention from researchers, policy<br />
analysts, <strong>and</strong> the public, with discussions of test score gaps becoming commonplace <strong>and</strong> debates about causes <strong>and</strong><br />
solutions occurring in a wide variety of venues. The purpose of including achievement equity as a category in the<br />
educational equity profile, thus, is to keep this focus on equity outcomes centered <strong>and</strong> to exp<strong>and</strong> the traditional<br />
attention on state achievement test results to include other evidence of student achievement including high school<br />
completion, completion of college prep curriculum, <strong>and</strong> higher level assessments such as the SAT, ACT, <strong>and</strong><br />
Advanced Placement exams. As we’ve learned from our research with school districts that have made significant<br />
progress toward equity, equitable achievement on relatively low level state assessments does not indicate true<br />
achievement equity when large gaps remain on other, more challenging indicators of student per<strong>for</strong>mance. Thus, the<br />
four indicators we propose <strong>for</strong> this category include:<br />
• State achievement tests<br />
• Dropout rate<br />
14<br />
12 12<br />
Afr. Am. Male Afr. Am.<br />
Female<br />
• High school graduation tracks<br />
• SAT/ACT/Advanced Placement<br />
Example Small Town High School<br />
Student Discipline<br />
21<br />
5 5<br />
6<br />
33 33<br />
Hisp. Male Hisp. Female White Male White Female<br />
% of Population % of Discipline Cases<br />
17<br />
7<br />
10
All 50 states now have some <strong>for</strong>m of state achievement tests <strong>and</strong> soon will be required to publicly disseminate<br />
per<strong>for</strong>mance results disaggregated by student race <strong>and</strong> income levels. Per<strong>for</strong>mance on these tests should be a basic<br />
indicator included in the educational equity profile.<br />
Beyond per<strong>for</strong>mance on state tests, however, lie other areas that need significant scrutiny <strong>for</strong> evidence of<br />
levels of equity with school districts. Dropout rates (or, alternatively, school completion rates) are an indicator that<br />
increasing is coming to the <strong>for</strong>efront of discussions of educational equity <strong>and</strong> accountability (see Haney, 2001).<br />
Students of color (particularly males) <strong>and</strong> students from low income homes drop out of school be<strong>for</strong>e graduating in<br />
grossly disproportionate numbers.<br />
A third area <strong>for</strong> consideration in this category of the educational equity audit is high school graduation<br />
tracks. All students who graduate do typically do not pursue equally rigorous curricula, with most states having<br />
some <strong>for</strong>m of a tiered system that offers basic, advanced, <strong>and</strong>/or college preparatory curricula. Again, the<br />
percentage of students completing high school under each plan may vary widely from district to district, but the<br />
central question addressed by this indicator is whether there is proportional representation of student groups in each<br />
graduation track within each district.<br />
The fourth indicator in the achievement equity group is per<strong>for</strong>mance on college admissions tests <strong>and</strong>/or<br />
Advanced Placement Examinations. As with other indicators we’ve discussed, students of color <strong>and</strong> students from<br />
low income homes typically score much lower on these advanced measures than do white students <strong>and</strong> students<br />
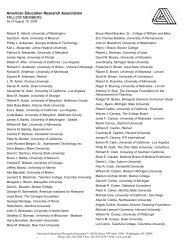
from middle- <strong>and</strong> upper-income homes. Below are example data from a 78,000 student urban district <strong>for</strong> student<br />
per<strong>for</strong>mance on Advanced Placement exams. The demographics of this district’s students are 16% African<br />
American, 48% Hispanic, <strong>and</strong> 34% white. It is clear that many few students of color are taking these examinations<br />
<strong>and</strong> that they are scoring at or above the criterion <strong>for</strong> college credit at lower rates than are white students.<br />
100<br />
90<br />
80<br />
70<br />
60<br />
50<br />
40<br />
30<br />
20<br />
10<br />
0<br />
Figure 4<br />
6<br />
36<br />
Example Urban District<br />
Advanced Placement Exams<br />
14<br />
African American Hispanic White<br />
% Students Tested % Scoring Equal or Above Criteria<br />
Next Steps<br />
We are in still in the preliminary stages of developing a workable model of this educational equity profile.<br />
Over the course of the year, we will be putting these indicators together in an instrument that will have a user-<br />
37<br />
39<br />
51<br />
11
friendly <strong>for</strong>mat along with suggestions <strong>for</strong> data sources, benchmarks from the literature <strong>for</strong> levels of equity, <strong>and</strong><br />
recommendations <strong>for</strong> sources of best practices to work <strong>for</strong> improvement in each area. We will also be piloting the<br />
instrument with two school districts.<br />
Conclusion<br />
In this paper, we’ve proposed a prototype model <strong>for</strong> an educational equity profile, a tool <strong>for</strong> school leaders<br />
<strong>and</strong> other educators to help them underst<strong>and</strong> <strong>and</strong> address the systemic inequities in their organizations <strong>and</strong> practices<br />
that lead to differential levels of student achievement that is distributed along race <strong>and</strong> social class lines. We see this<br />
tool as a descendent of an important history of school equity audits <strong>and</strong> as a focused instrument that has the potential<br />
to be highly useful in the U.S. educational climate of high stakes accountability. We’ve identified a dozen key<br />
indicators grouped into three categories—teacher quality equity, programmatic equity, <strong>and</strong> achievement<br />
equity—that, together, can portray an initial profile of the state of systemic equity (or inequity) within a school or<br />
district.<br />
This educational equity profile, of course, is only one tool, with potential <strong>for</strong> applicability in a particular<br />
way in a much larger, long-term struggle. The fight <strong>for</strong> educational excellence <strong>and</strong> equity <strong>for</strong> literally all children<br />
has been underway in U.S. schools <strong>for</strong> many years <strong>and</strong> will continue <strong>for</strong> many years yet to come. There are,<br />
however, individual schools, districts, <strong>and</strong> states in which substantial progress has been made, <strong>and</strong> we have learned<br />
much as researchers from our work in some of these schools <strong>and</strong> districts (Garcia Wagstaff, J.G., 2000; Nolly, 1997;<br />
Skrla & Scheurich, 2001). It is on this successful practice that our proposal <strong>for</strong> educational equity profiles is based,<br />
<strong>and</strong> we hope to contribute it as a tool <strong>for</strong> leaders <strong>and</strong> educators in other schools <strong>and</strong> other districts <strong>and</strong> other states to<br />
pick up <strong>and</strong> use to advance the cause of equity in the public school system.<br />
12
References<br />
Anderson, G.L. (2001). Promoting educational equity in a period of growing social inequity: The silent<br />
contradictions of the Texas re<strong>for</strong>m discourse. Education <strong>and</strong> Urban Society, 33(3), 321-332.<br />
Artiles, A.J. (1998). The dilemma of difference: Enriching the disproportionality discourse with theory<br />
<strong>and</strong> context. Journal of Special Education, 32(1), 32-36.<br />
Darling-Hammond, L. (1999). Teacher quality <strong>and</strong> student achievement: A review of state policy evidence.<br />
Seattle: Center <strong>for</strong> the Study of Teaching <strong>and</strong> Learning.<br />
Donmoyer, R., & Garcia Wagstaff, J.G. (1990). Can principals be effective managers <strong>and</strong> instructional<br />
leaders, too? The Journal of Middle School <strong>and</strong> High School Administration.<br />
English, F.W. (1988). Curriculum auditing. Lancaster, PA: Technomic.<br />
Ferguson, R.F. (1998). Teachers’ perceptions <strong>and</strong> expectations <strong>and</strong> the black-white test score gap. In C.<br />
Jencks & M. Phillips (Eds.), The black-white test score gap. Washington, DC: Brookings Institution Press.<br />
Ford, D.Y., & Harmon, D.A. (2001). Equity <strong>and</strong> excellence: Providing access to gifted<br />
education <strong>for</strong> culturally diverse students. Journal of Secondary Gifted Education, 11(3), 141-148.<br />
Garcia Wagstaff, J.G. (2000). Basking Elementary School, hope <strong>for</strong> urban education: A study of nine<br />
high-per<strong>for</strong>ming, high poverty urban elementary schools. Washington, DC: U.S. Department of Education.<br />
Hall, V. (2002). Reinterpreting entrepeneuralism. In C. Reynolds (Ed.), Women <strong>and</strong> school leadership:<br />
International perspectives. Albany, NY: SUNY Press.<br />
Haney, W. (2001). Response to Skrla et al. The illusion of educational equity in Texas: A commentary on<br />
“accountability <strong>for</strong> equity.” International Journal of <strong>Leadership</strong> in Education, 4(3), 267-275.<br />
Ingersoll, R. M. (1999). The problem of underqualified teachers in American secondary schools.<br />
Educational Researcher, 28(2), 26-37.<br />
Author.<br />
Iowa Department of Education. (2001). The Iowa educational equity review process. Des Moines, IA:<br />
Keating, P. (2000). Underst<strong>and</strong>ing st<strong>and</strong>ards. Paper presented at the annual meeting of the American<br />
Educational Research Association, New Orleans, LA.<br />
Kentucky Department of Education. (1999). Equity analysis <strong>and</strong> data gathering instrument. Accessed<br />
online at http://www.kde.state.ky.us/osle/equity/documents/inst99.asp<br />
Klein, S. (2001). Response to Skrla et al.: Is there a connection between educational equity <strong>and</strong><br />
accountability? International Journal of <strong>Leadership</strong> in Education, 4(3), 261-266.<br />
MacMillan, D.L, & Reschy, D.J. (1998). Overrepresentation of minority students: The case <strong>for</strong> greater<br />
specificity or reconsideration of the variables examined. Journal of Special Education, 32(1), 15-24.<br />
McKenzie, K.B. (2001). White teachers' perceptions about their students of color <strong>and</strong> themselves as white<br />
educators. Doctoral dissertation, University of Texas at Austin.<br />
Mitchell, J.K., & Poston, W.K. (1992). The equity audit in school re<strong>for</strong>m: Three case studies of<br />
educational disparity <strong>and</strong> incongruity. International Journal of Educational Re<strong>for</strong>m, 1(3), 242-247.<br />
13
Moll, L. C. (1992). Bilingual classroom studies <strong>and</strong> community analysis: Some recent trends. Educational<br />
Researcher, 20(2), 20-24.<br />
Nolly, G.L. (1997). Effective instructional strategies <strong>for</strong> teaching mathematics to African American<br />
children. Doctoral dissertation, University of Texas at Austin<br />
Parker, L. (2001). Statewide assessment triggers urban school re<strong>for</strong>m: But how high the stakes <strong>for</strong> urban<br />
minorities? Education <strong>and</strong> Urban Society, 33(3), 313-320.<br />
Pollock, M. (2001). How the questions we ask most about race in education is the very question we most<br />
suppress. Educational Researcher, 30(9), 2-12.<br />
Poston, W.K. (1992). The equity audit in school re<strong>for</strong>m: Building a theory <strong>for</strong> educational research.<br />
International Journal of Educational Re<strong>for</strong>m, 1(3), 235-241.<br />
Scheurich, J.J., & Skrla, L. (2001) Continuing the conversation on equity <strong>and</strong> accountability. Phi Delta<br />
Kappan, 83(4), 322-326.<br />
Scheurich, J.J., Skrla, L., & Johnson, J. F. (2000). Thinking carefully about equity <strong>and</strong> accountability. Phi<br />
Delta Kappan, 82(4), 293-299.<br />
Schoenfeld, A.H. (2002). Making mathematics work <strong>for</strong> all children: Issues of st<strong>and</strong>ards, testing, <strong>and</strong><br />
equity. Educational Researcher,3(1), 13-25.<br />
Sclafani, S. (2001). Using an aligned system to make real progress <strong>for</strong> Texas students. Education <strong>and</strong><br />
Urban Society, 33(3), 305-312.<br />
Scott, B. (2001, March). Coming of age. IDRA Newsletter [on-line]. Available:<br />
http://www.idra.org/Newslttr/2001/Mar/Bradley.htm<br />
Skrla, L. (2001a). Accountability, equity, <strong>and</strong> complexity. Educational Researcher, 30(4), 15-21.<br />
Skrla, L. (2001b). The influence of state accountability on teacher expectations <strong>and</strong> student per<strong>for</strong>mance.<br />
UCEA Review, XLII(2), 1-4.<br />
Skrla, L., & Scheurich, J.J. (2001). Displacing deficit thinking in school district leadership. Education <strong>and</strong><br />
Urban Society, 33(3), 235-259.<br />
Skrla, L., Scheurich, J.J., & Johnson, J.F. (2001). Toward a new consensus on high academic achievement<br />
<strong>for</strong> all children. Education <strong>and</strong> Urban Society, 33(3), 227-234.<br />
Skrla, L., Scheurich, J.J., Johnson, J.F., & Koschoreck, J.W. (2001a). Accountability <strong>for</strong> equity: Can state<br />
policy leverage social justice?. International Journal of <strong>Leadership</strong> in Education,4(3), 237-260.<br />
Skrla, L., Scheurich, J.J., Johnson, J.F., & Koschoreck, J.W. (2001b). Complex <strong>and</strong> contested<br />
constructions of accountability <strong>and</strong> educational equity. International Journal of <strong>Leadership</strong> in Education,4(3), 277-<br />
283.<br />
York Press.<br />
Sleeter, C.E. (1996). Multicultural education as social activism. Albany, NY: State University of New<br />
Steffy, B. (1993). The Kentucky education re<strong>for</strong>m. Lanham, MD: Scarecrow Press.<br />
Trueba, H. (2001). Polar positions on the Texas Assessment of Academic Skills (TAAS): Pragmatism<br />
<strong>and</strong> the politics of neglect. Education <strong>and</strong> Urban Society, 33(3), 333-344.<br />
14
U.S. Department of Education. (2002a). Draft strategic plan 2002-2007. Washington, DC: Author.<br />
Accessed online at http://www.ed.gov/pubs/stratplan2002-07/index.html<br />
U.S. Department of Education. (2002b). No child left behind act of 2001: Executive summary.<br />
Washington, DC: Author. Accessed online at http://www.ed.gov/offices/OESE/esea/exec-summ.html<br />
U.S. Department of Education Office of Civil Rights. (1999). Impact of civil rights laws. Washington,<br />
DC: Author. Accessed online at http://www.ed.gov/offices/OCR/impact.html<br />
Valencia, R.R., Valenzuela, A., Sloan, K., & Foley, D.E. (2001). Let’s treat the cause, not the symptoms:<br />
Equity <strong>and</strong> accountability in Texas revisited. Phi Delta Kappan 83(4).<br />
Washington State Office of the Superintendent of Public Instruction. (1995). Washington State equity self-<br />
evaluation <strong>and</strong> planning documentation. Eisenhower National Clearinghouse. Accessed online at:<br />
http://www.enc.org/topics/equity/articles/document.shtm?input=ACQ-111584-1584<br />
1 This project is one of several, related projects funded by a grant by the Ford Foundation to Leaders <strong>for</strong> Social<br />
Justice, a group of educational administration professors committed to advancing educational equity <strong>and</strong> social<br />
justice within our field <strong>and</strong> within U.S. public schools. Catherine Marshall, Professor of Educational <strong>Leadership</strong> at<br />
the University of North Carolina, is principal investigator.<br />
15