Five-Year Monitoring & Evaluation Report - USDA Forest Service
Five-Year Monitoring & Evaluation Report - USDA Forest Service
Five-Year Monitoring & Evaluation Report - USDA Forest Service

Create successful ePaper yourself
Turn your PDF publications into a flip-book with our unique Google optimized e-Paper software.
United States<br />
Department of<br />
Agriculture<br />
<strong>Forest</strong><br />
<strong>Service</strong><br />
Alaska Region<br />
Chugach<br />
National<br />
<strong>Forest</strong><br />
September 2008<br />
CHUGACH<br />
NATIONAL FOREST<br />
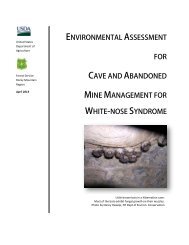
<strong>Monitoring</strong> off-highway vehicle use, goats, air quality, and dusky Canada geese<br />
on the Chugach National <strong>Forest</strong> (clockwise from top left).<br />
<strong>Five</strong>-year <strong>Forest</strong> Plan <strong>Monitoring</strong> and<br />
<strong>Evaluation</strong> <strong>Report</strong>
Table of Contents<br />
EXECUTIVE SUMMARY ...................................................................................... 1<br />
DETERMINATION ................................................................................................ 1<br />
INTRODUCTION .................................................................................................. 2<br />
MONITORING QUESTIONS AND EVALUATION ............................................... 3<br />
Compliance with Revised <strong>Forest</strong> Plan .......................................................... 3<br />
Integrated Effectiveness/Validation <strong>Monitoring</strong> ........................................... 4<br />
Soil Resources ................................................................................................ 5<br />
Water Resources ............................................................................................. 5<br />
Sensitive and Exotic Plant Species ............................................................... 6<br />
Management Indicator Species ..................................................................... 8<br />
Species of Special Interest .......................................................................... 25<br />
Threatened, Endangered and Sensitive Animal Species .......................... 28<br />
<strong>Forest</strong> Products ............................................................................................ 30<br />
Minerals ......................................................................................................... 31<br />
Heritage Resources ...................................................................................... 31<br />
Recreation Opportunities, Tourism, Access, and Facilities ...................... 32<br />
Scenic Quality ............................................................................................... 34<br />
Fire Protection and Fuels Management ...................................................... 35<br />
Wilderness ..................................................................................................... 36<br />
Research Natural Areas ............................................................................... 36<br />
Community Effects ....................................................................................... 37<br />
Additional Questions .................................................................................... 38<br />
STATUS OF FOREST PLAN MONITORING BY FISCAL YEAR ...................... 45<br />
LITERATURE CITED ......................................................................................... 52<br />
APPENDIX ......................................................................................................... 55<br />
FIVE -YEAR MONITORING AND EVALUATION REPORT
EXECUTIVE SUMMARY<br />
The <strong>Forest</strong> Plan and subsequent documents established 43 general monitoring<br />
questions for the Chugach National <strong>Forest</strong>. This includes three questions added<br />
after the Plan was published, including one left out inadvertently and two added as a<br />
result of appeal decisions. A summary of the cumulative results for 5 years of<br />
monitoring and evaluation of the <strong>Forest</strong> Plan are displayed in this report for each<br />
question. Some of the questions have not been monitored as scheduled because<br />
monitoring protocols were not yet complete or approved, or due to a lack of funding.<br />
The purpose of the <strong>Five</strong>-year <strong>Monitoring</strong> and <strong>Evaluation</strong> report is to: (1) determine if<br />
there is a need to change the <strong>Forest</strong> Plan or the implementation of the <strong>Forest</strong> Plan<br />
as a consequence of the evaluation of the monitoring results; (2) determine if there is<br />
a need to change the monitoring questions or protocols to insure that we are getting<br />
the results we need to address the issues raised in the monitoring questions and (3)<br />
determine the adequacy of the annual reports in meeting their intended purpose and<br />
identify modifications to improve their usefulness.<br />
The purpose of this review is to provide a summary of the cumulative results for the<br />
five years of monitoring and evaluation of the <strong>Forest</strong> Plan. This report covers the<br />
first five years of <strong>Forest</strong> Plan implementation and monitoring, beginning with the<br />
signing of the Record of Decision on May 31, 2002 and ending in September 30,<br />
2007.<br />
DETERMINATION<br />
I have reviewed this <strong>Five</strong>-year <strong>Forest</strong> Plan <strong>Monitoring</strong> and <strong>Evaluation</strong> <strong>Report</strong> for the<br />
Chugach National <strong>Forest</strong>. Under laws and regulations in effect at the time the <strong>Forest</strong><br />
Plan was revised (May 31, 2002), a forest plan is generally revised every 10 to 15<br />
years, or whenever the <strong>Forest</strong> Supervisor determines that conditions or demands<br />
have changed. There is evidence some of the monitoring questions may need to be<br />
revised, and in some instances dropped. The <strong>Forest</strong> Plan monitoring strategy will<br />
require finalization of the remaining monitoring protocols and due diligence regarding<br />
execution of the forest plan monitoring program. However, based on the evaluation<br />
of the monitoring results described in this document, I am satisfied that the revised<br />
<strong>Forest</strong> Plan is sufficient to guide management of the <strong>Forest</strong> and have determined<br />
that there is no need to change the Plan at this time. Furthermore, I am satisfied<br />
that the monitoring questions and protocols are being adequately reviewed and<br />
revised to address the critical issues raised during the development of the <strong>Forest</strong><br />
Plan; and, that the annual monitoring and evaluation reports are designed to meet<br />
their intended purpose. This report is approved.<br />
/s/ Nancy Peak 05-11-10<br />
NANCY PEAK Date<br />
Acting <strong>Forest</strong> Supervisor<br />
FIVE-YEAR MONITORING AND EVALUATION REPORT 1
INTRODUCTION<br />
This is the five-year monitoring and evaluation report for the Chugach National<br />
<strong>Forest</strong> Revised Land and Resource Management Plan (<strong>Forest</strong> Plan). The <strong>Forest</strong><br />
Plan provides guidance for all resource management activities on the Chugach<br />
National <strong>Forest</strong>. It does this in part by establishing <strong>Forest</strong>-wide goals, objectives,<br />
and management direction. The monitoring and evaluation process is used to<br />
ensure that <strong>Forest</strong> Plan direction is being implemented, is effective, and is not<br />
causing effects that were not predicted in the <strong>Forest</strong> Plan’s Final Environmental<br />
Impact Statement (FEIS). The evaluation process is also used to assess<br />
progress in achieving the desired conditions, goals, and objectives, and to verify<br />
that assumptions made in the <strong>Forest</strong> Plan and FEIS are valid.<br />
The <strong>Forest</strong>’s monitoring and evaluation strategy is located in Chapter 5 of the<br />
<strong>Forest</strong> Plan. The strategy outlines the basic elements of the monitoring program,<br />
establishes a <strong>Monitoring</strong> and <strong>Evaluation</strong> Interdisciplinary Team (MEIT), and<br />
defines 40 key monitoring questions. Three questions were added after the<br />
<strong>Forest</strong> Plan was published, resulting in 43 items to be monitored. The three<br />
additional questions included one left out inadvertently (monitoring of mountain<br />
goat, a management indicator species), and two added as a result of appeal<br />
decisions (air quality and summer off-highway vehicle (OHV) use). All <strong>Forest</strong><br />
Plan monitoring is directed toward answering these 43 general monitoring<br />
questions.<br />
The MEIT developed protocols with specific monitoring details for many of the<br />
general questions. Some protocols are currently being revised. Until this effort is<br />
complete, monitoring efforts may be minimal or non-existent for many items.<br />
Protocols are documented in the <strong>Monitoring</strong> Guide and their revision occurs<br />
outside of the forest planning process in order to be responsive to the best<br />
available science. A copy of the most current <strong>Monitoring</strong> Guide can be obtained<br />
from the Supervisor’s Office.<br />
The Record of Decision (ROD) for the <strong>Forest</strong> Plan acknowledged a need for<br />
obtaining information about the effects of winter snow machine use on ungulates<br />
and bears. The <strong>Forest</strong> regards this as a study to address specific informational<br />
needs, not as <strong>Forest</strong> Plan monitoring; therefore, no information is presented in<br />
this document on this subject.<br />
The purpose of this review is to provide a summary of the cumulative results for<br />
five years of monitoring and evaluation of the <strong>Forest</strong> Plan. The results are<br />
displayed in this report for each question. Using these results, the objective is to:<br />
(1) determine if there is a need to change the <strong>Forest</strong> Plan or the implementation<br />
of the <strong>Forest</strong> Plan as a consequence of the evaluation of the monitoring results;<br />
(2) determine if there is a need to change the monitoring questions or protocols<br />
to insure that we are getting the results we need to address the issues raised in<br />
the monitoring questions and (3) determine the adequacy of the reports in<br />
meeting their intended purpose and identify modifications to improve their<br />
usefulness.<br />
2 FIVE-YEAR MONITORING AND EVALUATION REPORT
MONITORING QUESTIONS AND EVALUATION<br />
A summary and evaluation of the monitoring results for the first five years of<br />
<strong>Forest</strong> Plan implementation for all monitoring questions are included in this<br />
report. Some questions have not been monitored according to the schedule in<br />
the <strong>Forest</strong> Plan. Reasons precluding monitoring were: (1) monitoring question<br />
under review; (2) monitoring protocol under development; and (3) lack of funding.<br />
The Chugach <strong>Forest</strong> Plan <strong>Monitoring</strong> and <strong>Evaluation</strong> Strategy describes the<br />
ranking criteria and process used. A copy of the table that summarizes the<br />
results is included as Appendix A.<br />
The general monitoring questions are grouped by monitoring purpose or<br />
applicable resource category (e.g., soil resources), and are in the same order as<br />
presented in Chapter 5 of the <strong>Forest</strong> Plan. The ranking of the top 30 questions is<br />
shown (1 being the most important). The three items that were added after the<br />
Plan was published are listed under the “Additional Questions” category.<br />
For each general monitoring question, the frequency (i.e., schedule) of data<br />
collection and evaluation are displayed as presented in Chapter 5 of the <strong>Forest</strong><br />
Plan. The schedules represent expectations under maximum funding levels. In<br />
some cases, the collection and evaluation frequencies in the <strong>Forest</strong> Plan are<br />
different than what is shown in the draft <strong>Monitoring</strong> Guide. Although the<br />
schedules in the <strong>Monitoring</strong> Guide are more appropriate, they have not yet<br />
formally replaced the schedules established in the <strong>Forest</strong> Plan.<br />
A <strong>Forest</strong> Plan <strong>Monitoring</strong> and <strong>Evaluation</strong> Status Table located on page 46<br />
displays the planned and actual monitoring and evaluation by fiscal year from<br />
2003 to 2007 (FY03-FY07).<br />
Compliance with Revised <strong>Forest</strong> Plan<br />
Are projects being implemented consistent with the <strong>Forest</strong> Plan<br />
direction?<br />
• Frequency of collection and evaluation: Once every 5 years / 5 th<br />
year<br />
• MEIT Ranking: 4<br />
• Status as of FY07: No monitoring or evaluation occurred while<br />
protocol was being developed. <strong>Monitoring</strong> is scheduled to take place<br />
during the summer of 2008.<br />
• Any need to change <strong>Forest</strong> Plan or implementation of Plan? No<br />
information available to make determination.<br />
• Any need to change monitoring protocols or question to be<br />
sure we are getting information we want? Protocol was completed<br />
and approved by the <strong>Forest</strong> Leadership Team (FLT) in FY07.<br />
• Are the reports adequate or are any modifications needed?<br />
None to review.<br />
FIVE-YEAR MONITORING AND EVALUATION REPORT 3
Integrated Effectiveness/Validation <strong>Monitoring</strong><br />
Are management activities achieving their intended outcomes?<br />
• Frequency of collection and evaluation: Annual / 5 th year<br />
• MEIT Ranking: 10<br />
• Status as of FY07: Not monitored (monitoring question being<br />
reviewed).<br />
• Any need to change <strong>Forest</strong> Plan or implementation of Plan? No<br />
information available to make determination.<br />
• Any need to change monitoring protocols or question to be<br />
sure we are getting information we want? <strong>Monitoring</strong> question is<br />
being reviewed. At this time no protocol is being developed.<br />
• Are the reports adequate or are any modifications needed?<br />
None to review.<br />
To what extent is ecosystem composition and structure changing and<br />
has forest management influenced these changes? How do these<br />
changes compare to the expected range?<br />
• Frequency of collection and evaluation: Annual / 5 th year<br />
• MEIT Ranking: 15<br />
• Status as of FY07: The protocol is being finalized and includes two<br />
methodologies:<br />
1) <strong>Forest</strong> Inventory and Analysis (FIA) grid inventory for <strong>Forest</strong>wide<br />
and by geographic area interpretations. A subset of the grid<br />
is sampled annually by PNW Research. Interpretations of the<br />
initial repeat measurement data by the Chugach is projected to<br />
occur by the end of FY08.<br />
2) Analysis of multi-temporal, multi-spectral, satellite imagery for<br />
<strong>Forest</strong>-wide, geographic area, and management prescription<br />
category interpretations. Currently an initial pilot application of the<br />
methods on the Chugach is under way with assistance from the<br />
Remote Sensing Application Center.<br />
• Any need to change <strong>Forest</strong> Plan or implementation of Plan?<br />
Initial summary interpretations of the monitoring data will not be<br />
available until late 2008. So the information is not presently available<br />
to make determination.<br />
• Any need to change monitoring protocols or question to be<br />
sure we are getting information we want? The <strong>Monitoring</strong> and<br />
<strong>Evaluation</strong> Interdisciplinary Team (MEIT) interpreted the monitoring<br />
question to be “Is <strong>Forest</strong> Management influencing changes in<br />
ecosystem composition and structure outside the expected range of<br />
variability?” Refinement and pilot testing of the proposed protocol is<br />
ongoing. Anticipated completion is late in calendar year 2008. When<br />
the protocol is approved, the monitoring question will be revised in<br />
the <strong>Forest</strong> Plan to reflect MEIT recommendations. Reevaluation of<br />
the protocol will occur every 5 years beginning in FY12.<br />
4 FIVE-YEAR MONITORING AND EVALUATION REPORT
• Are the reports adequate or are any modifications needed?<br />
None to review.<br />
Soil Resources<br />
What is the level of ground disturbing activity?<br />
• Frequency of collection and evaluation: Annual / 5 th year<br />
• MEIT Ranking: 21<br />
• Status in FY07: No monitoring or evaluation has occurred, protocols<br />
are being developed. Anticipated completion date is FY08. The<br />
protocols will include both implementation and effectiveness<br />
monitoring and will address ground disturbing activities including offhighway<br />
vehicle use.<br />
• Any need to change <strong>Forest</strong> Plan or implementation of <strong>Forest</strong><br />
Plan? Summary interpretations are not yet available to make a<br />
determination. Initial interpretations are expected in FY09.<br />
• Any need to change monitoring protocols or question to be<br />
sure we are getting information we want? <strong>Monitoring</strong> protocols<br />
are expected to be approved in FY08. The need to make any<br />
changes will be assessed after interpreting the monitoring data using<br />
the approved protocols.<br />
• Are the reports adequate or are any modifications needed? The<br />
existing reports are adequate for the legacy data.<br />
Water Resources<br />
What is the existing water quantity?<br />
• MEIT Ranking: 30<br />
• Status as of FY07: This question was determined to be a research<br />
question and not a <strong>Forest</strong> Plan monitoring question. As a result of<br />
this determination, it was dropped from the monitoring strategy.<br />
• Any need to change <strong>Forest</strong> Plan or implementation of <strong>Forest</strong><br />
Plan? An amendment of the <strong>Forest</strong> Plan monitoring strategy is<br />
needed to reflect this decision.<br />
• Any need to change monitoring protocols or question to be<br />
sure we are getting information we want?<br />
• Are the reports adequate or are any modifications needed?<br />
Are Best Management Practices (including wetland management)<br />
effective in meeting water quality standards?<br />
• Frequency of collection and evaluation: As scheduled/ 5 th year<br />
• MEIT Ranking: 26<br />
• Status as of FY07: No monitoring or evaluation has occurred, pilot<br />
protocol completed and approved by FLT in November 2007.<br />
• Any need to change <strong>Forest</strong> Plan or implementation of Plan? No<br />
information available to make determination.<br />
FIVE-YEAR MONITORING AND EVALUATION REPORT 5
• Any need to change monitoring protocols or question to be<br />
sure we are getting information we want? Pilot protocol approved<br />
by FLT in November 2007. Protocol may need to be modified in the<br />
future in order to conform to the new national <strong>Forest</strong> <strong>Service</strong> Best<br />
Management Practice monitoring protocol (national protocol is in<br />
development, scheduled to be completed in 2009).<br />
• Are the reports adequate or are any modifications needed?<br />
None to review.<br />
Sensitive and Exotic Plant Species<br />
What is the abundance and distribution of sensitive plants in areas<br />
affected by management activities?<br />
• Frequency of collection and evaluation: Annual / 5 th year<br />
• MEIT Ranking: 28<br />
• Status as of FY07: Sensitive plant species have been inventoried in<br />
project areas, but not monitored or evaluated. The protocol is being<br />
developed and includes two methodologies:<br />
1) Review and verification that biological evaluations (BE) were<br />
completed for all projects with potential effects on sensitive<br />
plants. If the BEs are completed and proper mitigation measures<br />
are followed, then, by inference, there will be a low probability<br />
that <strong>Forest</strong> management activities will contribute to a trend<br />
towards federal listing or cause the loss of viability of populations<br />
or species. Under this protocol, the proponents of any project<br />
listed in the <strong>Forest</strong> <strong>Service</strong> corporate Planning, Litigation, and<br />
Appeals System (PALS) that has potential effects on sensitive<br />
plants but that has not undergone biological evaluation would be<br />
notified of the requirement to complete a BE. If the BE is not<br />
completed in a timely manner then management action may be<br />
invoked.<br />
2) Sensitive plant population monitoring that included three<br />
components: a) sampling known populations of sensitive plants<br />
in areas of active management activity, b) collecting species data<br />
from the sampled populations following the <strong>Forest</strong> <strong>Service</strong><br />
corporate Threatened, Endangered, and Sensitive Plant (TESP)<br />
Survey and Element Occurrence methodology, and c) analyzing<br />
the data collected using methods documented in Elzinga et al.<br />
(1988). Results having the greatest concern to management are<br />
those where the calculated P value from the significance test<br />
used is less than 0.20. However, the sample size for the sensitive<br />
plant population monitoring dataset is presently insufficient for<br />
significance testing.<br />
• Any need to change <strong>Forest</strong> Plan or implementation of Plan? The<br />
monitoring protocol has not yet been implemented, so no information<br />
available to make determination.<br />
6 FIVE-YEAR MONITORING AND EVALUATION REPORT
1<br />
• Any need to change monitoring protocols or question to be<br />
sure we are getting information we want? The MEIT interpreted<br />
the monitoring question to be “Are <strong>Forest</strong> management activities<br />
contributing to changes in the abundance and distribution of<br />
sensitive plant populations?” Protocol has been through final review<br />
and has an anticipated completion date of September 2008. When<br />
the protocol is approved, the monitoring question will be revised in<br />
the <strong>Forest</strong> Plan. Reevaluation of the protocol will occur every 5<br />
years beginning in FY12.<br />
• Are the reports adequate or are any modifications needed?<br />
None to review.<br />
What is the distribution and abundance of exotic plants, particularly in<br />
areas affected by management activities?<br />
• Frequency of collection and evaluation: Annual / 5 th year<br />
• MEIT Ranking: 27<br />
• Status as of FY07: Exotic (i.e., non-native) plants have been<br />
inventoried in many areas across the <strong>Forest</strong> (Arhangelsky 2007;<br />
DeVelice et al. 1999; DeVelice 2003; Duffy 2003) and monitoring of a<br />
subset of inventory and treatment sites has occurred (R.L. DeVelice,<br />
unpublished data). Summary evaluation of these data shows that<br />
most areas of exotic plant occurrence on the <strong>Forest</strong> are in areas of<br />
intensive human-caused disturbance and that the abundance and<br />
distribution of exotic plants is increasing. The exotic plant protocol is<br />
being finalized and includes six methodologies (in all cases, results<br />
having the greatest concern to management are those where the<br />
calculated P value from the significance test used is less than 0.20):<br />
1) <strong>Forest</strong> Inventory and Analysis (FIA) grid inventory. A subset of<br />
the grid is sampled annually by Pacific Northwest (PNW)<br />
Research and will provide an overall estimate of invasive plant<br />
occurrence in forested areas across the entire <strong>Forest</strong> (which is<br />
about 99% roadless with relatively rare occurrences of invasive<br />
plants in the roadless portions to date).<br />
2) Quarter-mile road surveys (Arhangelsky 2007) every five years<br />
will provide repeatable measures of invasive plant occurrences<br />
across a portion of the <strong>Forest</strong> that has been found to have the<br />
greatest diversity and concentrations of invasive plants.<br />
3) Trail surveys (DeVelice 2003) every five years will provide<br />
repeatable measures of invasive plant occurrences across a<br />
portion of the <strong>Forest</strong> that has been found to have high diversity<br />
and concentrations of invasive plants.<br />
4) Developed site monitoring (following NRIS Invasives<br />
).<br />
protocol 1<br />
http://www.fs.fed.us/emc/nris/products/invasives/index.shtml<br />
FIVE-YEAR MONITORING AND EVALUATION REPORT 7
5) Exotic plant control project monitoring (following NRIS<br />
Invasives protocol).<br />
6) Implementation monitoring using the protocol for the<br />
monitoring question which asks “Are projects being implemented<br />
consistent with the <strong>Forest</strong> Plan?”<br />
• Any need to change <strong>Forest</strong> Plan or implementation of Plan? The<br />
<strong>Forest</strong> Plan goal to “reduce areas of current infestation” of exotic<br />
plants is not being fully met with using the currently employed<br />
manual treatments. Effectiveness of manual treatments in reducing<br />
exotic plant populations in 2007 ranged from 15 to 100% with a<br />
mean of 72.8±25.1 (n=95). An environmental analysis for use of an<br />
integrated pest management approach (including chemical and<br />
perhaps thermal methods) for a project on the Glacier Ranger<br />
District (RD) is underway to increase treatment effectiveness.<br />
• Any need to change monitoring protocols or question to be<br />
sure we are getting information we want? The MEIT interpreted<br />
the monitoring question to be “Are <strong>Forest</strong> management activities<br />
contributing to changes in the abundance and distribution of invasive<br />
plant populations?” The protocol’s anticipated completion date is by<br />
the end of FY08. When the protocol is approved, the monitoring<br />
question will be revised in the <strong>Forest</strong> Plan. Reevaluation of the<br />
protocol will occur every 5 years beginning in FY12.<br />
• Are the reports adequate or are any modifications needed?<br />
None to review.<br />
Management Indicator Species<br />
What are the population trends for Management Indicator Species (MIS)<br />
and their relationship to habitat? Are MIS truly reflective of all fish and<br />
wildlife species on the <strong>Forest</strong>?<br />
• MEIT Ranking: not in top 30<br />
• Status as of FY07: The MEIT assigned low priority to this item<br />
because: (1) the first component is redundant with the general<br />
monitoring questions for specific MIS, and (2) the second component<br />
is more appropriate as a research item than a monitoring question. In<br />
2007, the <strong>Forest</strong> Leadership Team agreed and recommended<br />
dropping the question from the monitoring strategy.<br />
• Any need to change <strong>Forest</strong> Plan or implementation of <strong>Forest</strong><br />
Plan? An amendment of the <strong>Forest</strong> Plan monitoring strategy is<br />
needed to reflect this decision.<br />
• Any need to change monitoring protocols or question to be<br />
sure we are getting information we want?<br />
• Are the reports adequate or are any modifications needed?<br />
Has the Revised <strong>Forest</strong> Plan direction prevented adverse interactions<br />
between bears and humans?<br />
• Frequency of collection and evaluation: Annual / 5 th year<br />
8 FIVE-YEAR MONITORING AND EVALUATION REPORT
• MEIT Ranking: 6<br />
• Status as of FY07: No monitoring or evaluation has occurred,<br />
protocol was being developed.<br />
• Any need to change <strong>Forest</strong> Plan or implementation of <strong>Forest</strong><br />
Plan? No information available to make determination.<br />
• Any need to change monitoring protocols or question to be<br />
sure we are getting information we want? Protocol was approved<br />
by the FLT in January 2008.<br />
• Are the reports adequate or are any modifications needed?<br />
None to review.<br />
What are the population trends for brown bear and the relationship to<br />
habitat?<br />
• Frequency of collection and evaluation: Every 3 rd year/ 5 th year<br />
• MEIT Ranking: 14<br />
• Status as of FY07: A report was prepared in 2005 describing how<br />
brown bears were to be monitored through an Interagency Brown<br />
Bear Study Team, but no evaluation has occurred.<br />
• Any need to change <strong>Forest</strong> Plan or implementation of Plan? No<br />
information available to make determination.<br />
• Any need to change monitoring protocols or question to be<br />
sure we are getting information we want? FY07 accomplishment<br />
report noted that protocol still needs substantial work. Anticipated<br />
completion date has changed from FY07 to FY09.<br />
• Are the reports adequate or are any modifications needed?<br />
None to review.<br />
What are the population trends for dusky Canada geese and the<br />
relationship to habitat?<br />
• Frequency of collection and evaluation: Every 3 rd year for both<br />
• MEIT Ranking: 7<br />
• Status as of FY07: <strong>Monitoring</strong> and evaluation reports prepared in<br />
2004 and 2007.<br />
• Any need to change <strong>Forest</strong> Plan or implementation of Plan? No.<br />
• Any need to change monitoring protocols or question to be<br />
sure we are getting information we want? FY07 accomplishment<br />
report noted that protocol still needs substantial work. Anticipated<br />
completion date has changed from FY07 to FY08.<br />
• Are the reports adequate or are any modifications needed?<br />
<strong>Report</strong>s are adequate, however the population trend data that is<br />
derived from the nesting density estimates needs to be provided in<br />
future reports. This information is available from other agencies, but<br />
funds need to be provided to analyze that data when available.<br />
FIVE-YEAR MONITORING AND EVALUATION REPORT 9
<strong>Monitoring</strong> summary: As the primary land manager for the Copper River<br />
Delta, the <strong>Forest</strong> <strong>Service</strong> (USFS) is responsible for assessing habitatrelated<br />
changes in the dusky Canada goose population. In 1993, the<br />
USFS began a cooperative project with Alaska Department of Fish and<br />
Game (ADF&G) and the U.S. Fish and Wildlife <strong>Service</strong> (USFWS) to<br />
estimate the number of dusky Canada geese, compare ground-based<br />
estimates with aerial survey estimates, and describe habitat use. This<br />
project relied on ground searches of random plots. These searches have<br />
been conducted concurrently with aerial surveys every three years since<br />
1993.<br />
The nest density survey is conducted every three years and provides<br />
information for population estimates, nesting densities by habitat and<br />
productivity estimates. During the 2003 to 2007 monitoring period,<br />
Cordova RD conducted and reported on two dusky Canada goose nest<br />
density surveys on the Copper River Delta. This work was reported in the<br />
FY04 and FY07 Annual <strong>Forest</strong> Plan <strong>Monitoring</strong> <strong>Report</strong>s. The results in the<br />
2004 and 2007 reports were limited to nesting densities by habitat type<br />
sampled.<br />
In 2004, crews searched 45 plots, which is slightly higher than 1998 (37<br />
plots) and 2001 (39 plots). A higher proportion of sparse-density plots<br />
were searched in 2004 than in previous years. Eighteen plots (40%)<br />
landed in low-density areas, 20 plots (44%) in sparse-density areas, 3<br />
plots (7%) in medium density, and 4 plots (9%) in new marsh. Crews<br />
found 36 nests, which is lower than 2001 (48 nests) and 1998 (70 nests).<br />
This difference was probably due to the higher proportion of sparse plots<br />
searched. Nest density (nests/km2) in medium, low, sparse, and new<br />
marsh was 3.7, 12.35, 7.78, and 2.78 respectively. Nest density did not<br />
differ among years in medium (df = 2, p = 0.32), low (df = 2, p = 0.55), or<br />
sparse (df = 2, p = 0.48) density strata. New marsh had a small sample<br />
size and was not analyzed for difference among years.<br />
In 2007, crews searched 50 plots and of these 23 plots were in lowdensity<br />
areas, 21 plots in sparse–density, 4 plots in medium density, and 2<br />
plots in new marsh. A total of 32 nest were found in 2007 and nest<br />
density did not differ among years in medium (df =3, p=0.40), low (df =3,<br />
p=0.11) and sparse (df =3, p=0.57) density strata.<br />
a) What are the population trends for dusky Canada geese and the<br />
relationship to habitat? Nesting density data collected by Cordova RD<br />
are used for population estimates by USFWS but the estimates were not<br />
provided in the report. Population estimates are derived annually by<br />
USFWS for dusky Canada geese and provided to the Pacific Flyway<br />
Council. These data could be used to evaluate population trends for dusky<br />
Canada geese and their general habitat relationships on the Copper River<br />
10 FIVE-YEAR MONITORING AND EVALUATION REPORT
Delta. However, CRD did report that nesting densities did not differ among<br />
years (2001, 2004 and 2007) in medium (df = 3, p = 0.40), low (df = 3, p =<br />
0.11), or sparse (df = 3, p = 0.57) density strata.<br />
b) Have numbers of dusky Canada geese on the <strong>Forest</strong> increased,<br />
decreased, or remained the same? This information was not provided<br />
in the 2004 or 2007 <strong>Report</strong>s. Determining dusky nesting densities was the<br />
purpose of the work conducted in 2004 and 2007. Similar nest searches<br />
have been conducted concurrently with aerial surveys in 1993, 1995,<br />
1998, 2001, 2004 and 2007. However, a random sampling design that<br />
included several habitat types was initiated in 1998 and was used in<br />
subsequent sampling years (2001, 2004 and 2007).<br />
c) What are the characteristics of dusky Canada goose nesting and<br />
brood rearing habitat, and have they changed? Nests located in shrub<br />
communities contained the highest number of nests. Sweet gale, grass,<br />
and moss were the predominant vegetation types at the nest. Average<br />
shrub height at the nest was 100 cm with about 40% shrub cover. Nest<br />
sites were most commonly located in inter-levee basins and on natural<br />
islands. Nesting habitat characteristics were not compared to prior<br />
surveys. Brood rearing habitat was not quantified.<br />
In both years, shrub communities (41-100% shrub cover) and grass-forb<br />
(10-40% shrub cover) contained the highest number of nests. Sweet gale,<br />
grass, and moss were the predominant vegetation types at the nest.<br />
Average shrub height at the nest was 85 cm with about 35% shrub cover<br />
in 2004. In 2007, average shrub height was 100 cm and shrub cover was<br />
40%. In 2004, nest sites were most commonly located in inter-levee<br />
basins and on natural islands.<br />
d) What are the factors that most greatly affect dusky Canada goose<br />
nesting and recruitment success? The 1964 earthquake uplifted the<br />
Copper River Delta, which created a broad band of low-lying wetlands that<br />
was formerly intertidal mudflats. This uplift initially increased goose<br />
breeding habitat and caused a population increase, but as vegetation<br />
developed and predators began to take residence, the dusky population<br />
declined to new lows. Natural succession will continue to increase the tree<br />
and shrub components on the Copper River Delta. This will likely reduce<br />
wetlands habitat and increase predators. Therefore, natural succession<br />
and predation have been identified as the greatest factors affecting dusky<br />
Canada goose nesting and recruitment success.<br />
<strong>Evaluation</strong> summary: Breeding ground surveys offer the most realistic<br />
approach to population-based management efforts. Aerial surveys can be<br />
used to estimate both population and the number of nests, which can then<br />
be combined with nest success data to estimate productivity. Problems<br />
FIVE-YEAR MONITORING AND EVALUATION REPORT 11
with this method occur, however, due to visibility bias or the definition of a<br />
breeding pair. Furthermore, nest success is usually estimated from only<br />
one location, which may not be representative of the entire area. To<br />
overcome these problems, ground-based nest searches of random plots in<br />
conjunction with aerial surveys are needed. This provides a correction<br />
factor for the aerial surveys and gives a broader picture of nest success.<br />
Nest surveys on random plots were needed to extrapolate these types of<br />
data to the entire breeding population. In addition, the Delta continues to<br />
undergo plant community succession accelerated by the 1964 Earthquake<br />
and areas of high nest density are likely to change. As the primary land<br />
manager for the Delta, the U.S. <strong>Forest</strong> <strong>Service</strong> (USFS) needed accurate<br />
population estimates and an understanding of nest distribution. These<br />
searches have been conducted concurrently with aerial surveys in fiscal<br />
years 1993, 1995, 1998, 2001, and 2004.<br />
Interestingly, the medium density plots which produced extremely low nest<br />
numbers in 2004 rebounded in 2007 to its average density. However since<br />
the sample size was so small in 2004 and 2007 (3 plots and 4 plots) no<br />
significant difference in density was detected. Because the sampling<br />
design is completely random, and the medium density strata comprises<br />
the smallest area on the delta, we may have trouble detecting changes in<br />
the medium density strata because this strata will usually have the lowest<br />
number of selected plots.<br />
Changes in hydrology have created access issues. In 2001 and 2004<br />
crews were forced to use more alternate plots. The flow from the Copper<br />
River that feeds the Pete Dahl slough has shifted, causing less water to<br />
run down the Pete Dahl system. In 2007, water levels in Pete Dahl were<br />
better than previous years but still low enough that certain areas were<br />
inaccessible. Plots that cannot be reached in these areas are dropped and<br />
replaced with alternates. Doing so increases the proportion of sparse<br />
density plots because they are generally easier to access. In essence the<br />
randomness of the survey is being reduced which may create problems<br />
when comparing to previous years. One solution is to use helicopters and<br />
airplanes to access these areas.<br />
Data collected from this project are used in conjunction with aerial surveys<br />
to estimate the dusky Canada goose population. Ground data are used to<br />
estimate the number of birds missed in aerial surveys, and thereby<br />
improve aerial estimation. Conditions and timing of nest searching in 2007<br />
were excellent, and an accurate assessment of nesting activity was<br />
obtained; unlike 2001 when a late snowfall caused a disruption in nesting<br />
and a prolonged nesting peak.<br />
12 FIVE-YEAR MONITORING AND EVALUATION REPORT
Recommendations of remedial action: Continue to monitor so<br />
management actions can be taken when necessary to prevent dusky<br />
Canada goose from being listed under the Endangered Species Act.<br />
Actions taken in response to recommendations identified in previous<br />
reports: Continued to monitor using ground searches on 3-year intervals.<br />
Other Recommendations: Continue to monitor using ground searches<br />
on a 3-year interval. Studies to appraise the status of the dusky nesting<br />
population began as early as 1952 (Nelson 1952, Olson 1954). In 1964,<br />
the ADF&G initiated nest surveys to document habitat use, nest density,<br />
and success (Shepherd 1965). They standardized methods and<br />
conducted annual nest surveys on high nest density areas from 1982 to<br />
1992 (Campbell and Timm 1983, Campbell 1990, Campbell, Rosenberg,<br />
and Rothe 1992). These data provide long-term indices of nest density,<br />
fate, and type of depredation, but focus only on higher density areas. Nest<br />
surveys on random plots were needed to extrapolate these types of data<br />
to the entire breeding population. In addition, the Delta continues to<br />
undergo plant community succession accelerated by the 1964 Earthquake<br />
(Crow 1968, Potyondy et al. 1975, Kempka et al. 1994, Thilenius 1995,<br />
Boggs 2000), and areas of high nest density are likely to shift.<br />
In 1979, ADF&G initiated fixed-wing aerial surveys over part of the Delta<br />
to provide an index to the distribution and numbers of nesting geese. The<br />
ADF&G survey was continued by the USFWS in 1983 and has been flown<br />
annually since then (Conant and Dau 1990, Butler and Eldridge 1991,<br />
Eldridge and Platte 1995). In 1986, the survey was refined, intensified,<br />
and expanded to include all known or suspected nesting habitats on the<br />
Delta (Butler and Eldridge 1991). In addition, fixed-winged surveys were<br />
compared to helicopter surveys. These results showed that one-third more<br />
geese were counted from the helicopter, but the number of additional birds<br />
missed with the helicopter remained unknown. The results suggested that<br />
geese were being missed, and in order to get a population estimate, a<br />
ground-based correction was needed. Due to the fact that vegetation is<br />
changing, this correction factor is repeated every three years.<br />
What are the population trends for moose and the relationship to<br />
habitat?<br />
• Frequency of collection and evaluation: Annual for both<br />
• MEIT Ranking: 17<br />
• Status as of FY07: <strong>Year</strong>ly monitoring of moose on the Copper River<br />
Delta is conducted by ADF&G by aerial surveys. The <strong>Forest</strong> <strong>Service</strong><br />
conducted moose condition monitoring project from 2000-2003.<br />
• Any need to change <strong>Forest</strong> Plan or implementation of Plan? No.<br />
• Any need to change monitoring protocols or question to be<br />
sure we are getting information we want? FY07 accomplishment<br />
FIVE-YEAR MONITORING AND EVALUATION REPORT 13
eport noted that protocol still needs substantial work. Anticipated<br />
completion date is in FY08.<br />
• Are the reports adequate or are any modifications needed?<br />
<strong>Report</strong> is adequate for moose on the Copper River Delta. No other<br />
reports have been completed.<br />
Summary of monitoring and evaluation: In 2003, a study documented<br />
in the report called Assessing Carrying Capacity of Moose on the Copper<br />
River Delta through Analysis of Body Condition was done. This study<br />
focused on the body condition of moose as it relates to habitat carrying<br />
capacity. In collaboration with ADF&G, the <strong>Forest</strong> <strong>Service</strong> initiated a study<br />
in 2000 to assess the change in body condition of moose over winter on<br />
the Copper River Delta. This approach provided an indirect index of the<br />
quality and availability of browse that the moose consume.<br />
In 2003, the <strong>Forest</strong> determined that the current population levels on the<br />
Copper River Delta were probably well below carrying capacity, and<br />
resources do not seem to be a limiting factor in this area. Further study<br />
was recommended to determine body condition over severe winters.<br />
Because moose are a subsistence and hunted species on the Copper<br />
River Delta, ADF&G conducts aerial surveys each year to determine<br />
number of animals to make available for the hunt and when to close the<br />
seasons.<br />
a) Have numbers of moose on the <strong>Forest</strong> increased, decreased or<br />
remained the same? On a <strong>Forest</strong>-wide basis, the <strong>Forest</strong> has not<br />
undertaken surveys to determine the number of moose and their trends.<br />
ADF&G does conduct these types of surveys and this information could be<br />
used to determine trends on the <strong>Forest</strong>.<br />
b) What are the characteristics of moose habitat by season? This<br />
information was not available in the Annual <strong>Monitoring</strong> <strong>Report</strong>s, but has<br />
been quantified for the Copper River Delta and documented by<br />
MacCracken, Van Ballenberghe and Peek (1997) in “Habitat relationships<br />
of moose of the Copper River Delta, in coastal south-central Alaska.”<br />
Stephenson, Van Ballenberghe, Peek, and MacCracken (2006) further<br />
expanded on the topic in their report “Spatio-temporal constraints on<br />
moose habitat and carrying capacity in coastal Alaska: Vegetation<br />
Succession and Climate. “ Stephenson (1995) also provided discussion<br />
on the topic in “Nutritional ecology of moose and vegetation succession on<br />
the Copper River Delta, Alaska”, his Ph.D. dissertation.<br />
c) How have <strong>Forest</strong> activities changed the availability, amount and<br />
quality of moose? This information was not available in the Annual<br />
<strong>Monitoring</strong> <strong>Report</strong>s. However, wildlife enhancement type projects have<br />
14 FIVE-YEAR MONITORING AND EVALUATION REPORT
occurred on a relatively small scale. Therefore, it is unlikely that these<br />
types of activities have significantly changed the availability, amount, and<br />
quality of moose on the <strong>Forest</strong> from 2003 to 2007. Other types of activities<br />
such as winter recreational access could influence moose and this<br />
relationship is being studied.<br />
What are the population trends for black oystercatchers and the<br />
relationship to habitat change?<br />
• Frequency of collection and evaluation: 3 years of each 5 year<br />
period / 5 th year<br />
• MEIT Ranking: 22<br />
• Status as of FY07: Monitored in FY03, 04, 05 and 06. <strong>Report</strong>s<br />
prepared each year. Protocol is being developed.<br />
• Any need to change <strong>Forest</strong> Plan or implementation of Plan? No.<br />
• Any need to change monitoring protocols or question to be<br />
sure we are getting information we want? The MEIT reinterpreted<br />
general monitoring questions from the Revised <strong>Forest</strong> Plan when<br />
they were not clearly stated as a <strong>Forest</strong> Plan monitoring question.<br />
Based on the information presented for this question in Table 5-1 of<br />
the <strong>Forest</strong> Plan, MEIT rephrased it to “What are the population<br />
trends for black oystercatchers and the relationship to habitat<br />
change? In 2006, it was decided to revise the monitoring question to<br />
reflect the MEIT interpretation. When the protocol is approved, the<br />
monitoring question will be revised in the <strong>Forest</strong> Plan to reflect MEIT<br />
recommendations. The FY07 accomplishment report noted that the<br />
protocol still needed substantial work. Anticipated completion date is<br />
FY08.<br />
• Are the reports adequate or are any modifications needed? The<br />
annual reports that provided the data did not directly answer the<br />
monitoring question (before revision in 2007) and often had<br />
information that was beyond these questions. <strong>Report</strong> write-ups<br />
should list monitoring questions and only provide monitoring<br />
information associated with that question. Other data sources should<br />
be included if they are available and if they will provide information to<br />
assist with answering the monitoring question. This information may<br />
be available from data collected prior to 2003 and data being<br />
collected by other agencies.<br />
FIVE-YEAR MONITORING AND EVALUATION REPORT 15
<strong>Monitoring</strong> summary and evaluation: Black oystercatchers were<br />
identified as a Management Indicator Species (MIS) on the Chugach<br />
National <strong>Forest</strong> to evaluate the effects of management activities on target<br />
ecosystems. Black oystercatchers are thought to be ecological indicators<br />
for shoreline habitat, and therefore they were used to assess the effects of<br />
human activities on shoreline ecosystems.<br />
Glacier and Cordova Ranger Districts both conducted inventories and<br />
described nesting habitat for black oystercatchers. Their inventory work<br />
has covered most of the Prince William Sound shoreline on National<br />
<strong>Forest</strong> System land. These data have been presented in the <strong>Monitoring</strong><br />
<strong>Report</strong>s from 2003 to 2006.<br />
Cordova Ranger District’s work has focused on inventorying shorelines in<br />
the Eastern Prince William Sound to provide the baseline data for future<br />
monitoring of these areas and an understanding of breeding pair territory<br />
densities. Further analysis of these data could provide a better<br />
understanding of the relationship between breeding pair densities and<br />
habitat.<br />
Glacier Ranger District has nesting pair data from shoreline surveys for a<br />
known area in Harriman Fiord, Barry Arm, and Western Prince William<br />
Sound from 2000 to 2006. In addition, more intensive work in this area<br />
from 2004 through 2006 included nest monitoring and productivity,<br />
banding, radio-tagging and telemetry, human use censuses, remote video<br />
nest monitoring, characterizing nest site and habitat as excerpted from the<br />
2006 report below. Population trends for black oystercatchers and their<br />
relationship to habitat can be analyzed from the data for the Harriman<br />
Fiord area since they have surveys from the same area since 2000.<br />
Table 1 displays a summary of the shoreline surveys for black<br />
oystercatchers conducted from 2003-2006 by the <strong>Forest</strong> <strong>Service</strong>. The<br />
Eastern Prince William Sound has been surveyed annually from 2003 to<br />
2006 but only Green Island was surveyed more than once during that time<br />
period. Other surveys in the eastern Sound from 2000 to 2002 were<br />
referred to in the 2003 report, but data were not presented. The data<br />
collected for the eastern Sound from 2003-2006 provides baseline data for<br />
future monitoring of population trends.<br />
Surveys in Western Prince William Sound included a general survey of<br />
this area that covered 430 km in 2004 and three consecutive years of data<br />
for 73km of the Harriman Fiord area that provides trend data for a specific<br />
shoreline. These data are present below in Table 1. Breeding pairs for the<br />
3 year period were similar and the number of breeding pairs was slightly<br />
higher in 2006. The survey data for the western Sound was collected from<br />
1999-2003. Only a partial data set was presented in the 2005 report and<br />
16 FIVE-YEAR MONITORING AND EVALUATION REPORT
was not in a form that could be used for comparative purposes. However,<br />
the original reports may have data that could be used for analyses.<br />
In general, breeding pairs per kilometer in the Sound ranged from 1.9 to<br />
4.4. A standard shoreline habitat classification for each survey was not<br />
completed which limits the analysis of breeding pairs to habitat types. A<br />
total of 70.1 km of shoreline was surveyed for habitat type using the<br />
NOAA Environmental Sensitivity Index (ESI) Map for Harriman Fiord and<br />
black oystercatcher breeding pairs. The data for 2004 and 2005 are<br />
presented in Figures 1 and 2. It should be noted that these data included<br />
re-nesting birds and they do not have a one to one correspondence to<br />
nesting density data presented for Harriman Fiord in Table 2. However, for<br />
both years gravel beaches received the highest use by nesting pairs.<br />
Using ESI habitat types has the best potential for standardizing data<br />
collection with regards to habitat relationships of nesting black<br />
oystercatchers. Shoreline habitat for the entire Sound could be calculated<br />
as well as the availability of each shoreline habitat type. These data could<br />
establish whether birds prefer a particular shoreline habitat for nesting in<br />
relation to the availability of that habitat. Also, the breeding pairs per<br />
kilometer could be estimated for each shoreline habitat and these<br />
relationships could be monitored. It appears that these data exist from the<br />
inventory work by the <strong>Forest</strong> <strong>Service</strong> in the Sound but further work is<br />
needed to create a synthesis of this information.<br />
Table 1 – Summary of black oystercatcher monitoring on the Chugach<br />
National <strong>Forest</strong><br />
<strong>Year</strong> Survey Area<br />
Total<br />
kilometers<br />
of shoreline<br />
surveyed<br />
# of BLOY*<br />
breeding<br />
pairs<br />
Breeding<br />
pairs per<br />
kilometer<br />
Eastern Prince William Sound<br />
Montague Island -<br />
2003<br />
Zaikof Pt. to Beach River &<br />
San Juan Bay to Jeannie<br />
Cove<br />
Montague Island - San Juan<br />
75 km 30 pairs<br />
1 pair per<br />
2.5 km<br />
2004<br />
to Hanning Bay (32Km) &<br />
Beach River to Log Jam Bay<br />
(32km)<br />
Montague Island - Log Jam<br />
64 km 24 pairs<br />
1pair per<br />
2.66 km<br />
2005<br />
Bay to Jeannie Cove (10km);<br />
Port Chalmers and Green<br />
Island (60km)<br />
Montague island - Hanning<br />
70 km 16 pairs<br />
1 pair per<br />
4.4 km<br />
2006<br />
Bay to Port Chalmers (48km)<br />
& Green Island, Little Green<br />
Island and Channel Island<br />
(54km)<br />
102 km 64 pairs<br />
1 pair per<br />
1.9 km<br />
FIVE-YEAR MONITORING AND EVALUATION REPORT 17
Western Prince William Sound<br />
2004<br />
Western Prince William<br />
Sound (includes Harriman<br />
Fiord)<br />
430 km 144 pairs<br />
1 pair per<br />
2.9 km<br />
2004<br />
Harriman Fiord area (subset<br />
of the above survey)<br />
73 km 25 pairs<br />
1 pair per<br />
2.9 km<br />
2005 Harriman Fiord area 73 km 29 pairs<br />
1 pair per<br />
2.5 km<br />
2006 Harriman Fiord area 73 km 28 pairs<br />
1 pair per<br />
2.6 km<br />
*BLOY = black oystercatcher and one nest converted to 1 breeding pair<br />
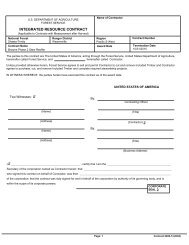
Figure 1 – Harriman Fiord shoreline habitat used by nesting black oystercatchers in 2004<br />
(n=35)<br />
gravel beach<br />
66%<br />
rocky shores<br />
17%<br />
sand and gravel beach<br />
11%<br />
glacially influ. tide-flat<br />
6%<br />
sheltered permeable rocky<br />
shore (0%)<br />
18 FIVE-YEAR MONITORING AND EVALUATION REPORT
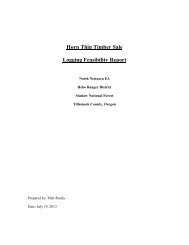
Figure 2 – Harriman Fiord shoreline habitat used by nesting black oystercatchers in 2005<br />
(n=37)<br />
gravel beach<br />
63%<br />
rocky shores<br />
11%<br />
sand and gravel beach<br />
20%<br />
glacially influ. tide-flat<br />
2%<br />
sheltered permeable rocky<br />
shore<br />
4%<br />
In the 2003 surveys conducted on Montague Island, crews inventoried 30<br />
nest locations with the highest densities in Jeannie Cove and the<br />
northeastern shoreline of Montague Island. The habitats recorded for the<br />
30 nests were sand (11), rock or boulder (10), and cobble or pebbles (9).<br />
Crews noted that black oystercatchers appeared to nest in all substrates<br />
and their distribution was more a factor of food availability, the width of the<br />
intertidal zone and near gently sloping intertidal zones. The Annual<br />
<strong>Report</strong>, provided by the Cordova Ranger District, identifies Montague<br />
Island as a high nesting density area for black oystercatcher with low<br />
recreational use area.<br />
In 2004, crews surveyed 64 km of shoreline on Montague Island and<br />
inventoried 24 nest locations with Patton Bay and Hanning Bay having the<br />
highest nesting densities. Crews also monitored 27 black oystercatcher<br />
territories in the Harriman Fiord area. Nest productivity was low with only 2<br />
nests out of 29 fledging chicks. Depredation and flooding events appeared<br />
to be the cause of most nest failures. Glacier Districts 2004 report stated<br />
that they intend to summarize the findings from the 144 territories<br />
monitored with 17 survey areas in the western Sound in a final report by<br />
mid 2005. It is unclear when these data were collected. It is mentioned in<br />
the report that other black oystercatcher inventory work was being<br />
conducted at Glacier Bay, Kenai Fjords National Parks, and Middleton<br />
Island, and these studies could be additional sources of information to<br />
assist with evaluating monitoring questions.<br />
In 2005, Montague Island shoreline from Log Jam Bay to Jeannie Cove<br />
and shoreline in Port Chalmers was surveyed as well as Green Island.<br />
The north side of Green Island had the highest number of nests (7), and a<br />
FIVE-YEAR MONITORING AND EVALUATION REPORT 19
total of 16 nests were recorded for the entire 70km of surveyed shoreline.<br />
Crews noted high nest failure for Green Island and suggested resurveying<br />
this area.<br />
In 2005, crews also surveyed 73 km of shoreline and documented 31<br />
black oystercatcher territories in the Harriman Fiord area. All territories<br />
occupied in 2004 were re-occupied in 2005 indicating a static population<br />
for those two years. Fifteen of the 47 nests monitored successfully<br />
hatched 31 chicks, of which 23 were fledged. A total of 70.1 km of<br />
shoreline was surveyed for habitat type using the NOAA Environmental<br />
Sensitivity Index (ESI) Map. Habitat at Harriman Fiord fell into five ESI<br />
categories: 46% sheltered rocky shore, 29% gravel beach, 10.3%<br />
sheltered permeable rocky shore, 10.3% salt /brackish water marsh, and<br />
3.5% mixed sand and gravel beach. In 2005, 5 nests were found on rocky<br />
shores, 29 on gravel beaches, 2 on sheltered permeable rocky shore, 1 in<br />
salt/brackish marsh, and 9 in mixed sand/gravel habitat. In 2004, 6 nests<br />
were found on rocky shores, 23 on gravel beaches, 0 on sheltered<br />
permeable rocky shore, 2 in salt/brackish marsh, and 4 in mixed sand /<br />
gravel habitat. These initial data show that black oystercatchers nest on<br />
gravel and mixed sand gravel beaches in a disproportionate ratio to total<br />
habitat present in Harriman Fiord. Nearly 20% of nesting occurred in a<br />
habitat type that made up just 3.5% of the total habitat present in the<br />
Fiord.<br />
Table 2 - Abundance and Productivity of Black Oystercatchers at<br />
Harriman Fiord, 2000-2005<br />
<strong>Year</strong> Total Reproductive Pairs per Number Mean<br />
Birds Pairs km hatched chicks/hatched<br />
beach nests<br />
nest<br />
2005 ≥70 29 0.43 15 2.0 (n=15)<br />
2004 70 25 0.34 2† 2.4 (n=2)<br />
2003 51 11 0.18 7 1.9 (n=7)<br />
2002 50 19 0.33 7 1.4 (n=5)<br />
2001 43 18 0.32 12 1.9 (n=10)<br />
2000 42 15 0.30 17 0.29 - 0.32 (n=6)<br />
Shaded rows denote directly comparable intensive survey efforts (compared with<br />
previous years) at Harriman Fiord<br />
†= <strong>Year</strong> of high nest failure. Causes: unknown - 52%, suspected river otter depredation -<br />
21%, flooding - 17%, other depredation - 10%<br />
Sources: Brown and Poe 2003, Poe 2003, Brown et al. 2004, 2005 data.<br />
In 2006, crews documented 28 territorial black oystercatcher pairs along<br />
73 km of surveyed shoreline in the Harriman Fiord. The total population of<br />
black oystercatchers (breeding pairs and non-breeding birds) that<br />
occurred in the area was thought to match or exceed the documented<br />
upper range for Harriman Fiord. Thirteen of 40 nests (33%) successfully<br />
hatched in 2006 producing 29 chicks of which 15 fledged. Three years of<br />
data suggest that there is a high natural variation in productivity between<br />
20 FIVE-YEAR MONITORING AND EVALUATION REPORT
years at Harriman. It appears that black oystercatchers in Harriman Fiord<br />
exhibit high mean clutch size, low hatch success, moderate fledging<br />
success, and low reproductive density compared to other areas for which<br />
information is available.<br />
In 2006, crews also surveyed 102km; Montague Island shoreline from<br />
Hanning Bay to Port Chalmers 48 km, and Green Island, Little Green<br />
Island and Channel Island (54 km). They observed 172 black<br />
oystercatchers and located 64 oystercatcher nest territories. Much of the<br />
surveyed shoreline (50 km) from Hanning Bay to Port Chalmers averaged<br />
0.9 nests/km and this is the highest nesting density recorded by Cordova<br />
District. Green Island was surveyed for a second time in as many years<br />
and found little change in the number of nesting territories between the<br />
two years (11 nesting territories in 2005 vs. 14 in 2006). The dominant<br />
substrate within 1m of nests was gravel (54%) and boulders (42%).<br />
Beach slope at nest sites averaged 10.7 degrees. These gentle sloping<br />
areas characteristic of black oystercatcher nesting areas are also<br />
desirable to recreational users (camping, landing boats, beachcombing).<br />
a) Has use of nesting beaches on the <strong>Forest</strong> increased, decreased, or<br />
stayed the same? The number of breeding pairs for the Harriman Fiord<br />
area appeared to be consistent for years 2004-2006. This was the only<br />
known area that was consistently surveyed on an annual basis. However,<br />
some surveys conducted prior to 2003 in the Sound possibly could be<br />
used for trend analysis, but these data for the most part were not reported<br />
in any of the 2003-06 annual reports. It is not known whether some of the<br />
surveys prior to 2003 were conducted with similar protocols and thereby<br />
could be used to determine trend in use of nesting beaches by black<br />
oystercatchers.<br />
b) What are the specific characteristics of beaches used by black<br />
oystercatchers for nesting? The substrate within 1 meter of where<br />
black oystercatchers nested was almost evenly split between cobble,<br />
sand, and rock/boulder for 30 nests in the eastern Sound (Fig. 3).<br />
Dominant substrate measurements indicated they selected nest sites on<br />
patches of gravel that occurred within boulder beaches. Black<br />
oystercatchers consistently occupied gravel peninsulas where fresh water<br />
streams entered salt water. Beach slopes were typically gentle, averaging<br />
less than 11% at these sites. There was high variation between nest sites<br />
and their distance to fresh water and mussel beds.<br />
The specific habitat characteristics within 1 meter of the nest provide<br />
some insight into immediate nesting habitat of black oystercatchers.<br />
These nesting habitat data would be more powerful if linked to the NOAA<br />
Environmental Sensitivity Index (ESI) Map. By doing so, they could<br />
provide better information on what types of beaches black oystercatchers<br />
are selecting with regards to amount of habitat that is available for each<br />
FIVE-YEAR MONITORING AND EVALUATION REPORT 21
habitat type. More than likely a synthesis of this information could be done<br />
from the existing data.<br />
Figure 3 - Substrate within 1 meter of black oystercatcher nests in Eastern Prince William<br />
Sound (N=30)<br />
Cobble, 9<br />
Rock or Boulder, 10<br />
Sand, 11<br />
c) What amount of overlap is there in the use of beaches by nesting<br />
black oystercatchers and recreationists? Recreational use overlap with<br />
black oystercatcher use was well documented in Harriman Fiord in 2005<br />
and 2006, but only the 2005 report provided data. A total of 262 people<br />
were seen on beaches in Harriman, along with 158 tents. Sixteen groups<br />
were within 100 m of a nest, 26 within 200 m, and 41 groups within 300 m.<br />
In two cases, camping groups used sites within 30 m of black<br />
oystercatcher nests, and these nests failed.<br />
No attempts to document the overlap between recreational users and<br />
black oystercatchers has been made for the Eastern Sound. The 2006<br />
Harriman Fiord data that is being analyzed by Oregon State University will<br />
provide more information for answering this question.<br />
Recommendations of remedial action: None<br />
Actions taken in response to recommendations identified in previous<br />
reports: None<br />
Other Recommendations: Structure the monitoring protocol to answer<br />
the specific monitoring questions.<br />
What are the population trends for Dolly Varden char and the<br />
relationship to habitat?<br />
• Frequency of collection and evaluation: Annual / 5 th year<br />
• MEIT Ranking: 20<br />
22 FIVE-YEAR MONITORING AND EVALUATION REPORT
• Status as of FY07: Monitored in FY03 and FY04. Protocol being<br />
developed. Generally, there is a lack of distribution and abundance<br />
data for Dolly Varden char across the <strong>Forest</strong>. Specifically, larger,<br />
more robust populations with multiple age classes would be needed<br />
for any evaluation of populations and their response to habitat<br />
change. In 2003, fish population surveys were conducted in three<br />
drainages of Prince William Sound and the Copper River Delta.<br />
Suitable populations of char were found in these drainages, but most<br />
reaches are open to anadromous fish. In 2004, ten drainages were<br />
sampled for Dolly Varden and only one stream had char above a<br />
known barrier. Choosing streams above barriers to anadromous fish<br />
passage helps limit population variability introduced from the marine<br />
environment when evaluating the effects of implementing the <strong>Forest</strong><br />
Plan.<br />
• Any need to change <strong>Forest</strong> Plan or implementation of Plan? No.<br />
• Any need to change monitoring protocols or question to be<br />
sure we are getting information we want? A review is needed to<br />
determine if this monitoring question is appropriate given the scope<br />
of management, risk to habitat and populations, and our ability to<br />
measure change. The <strong>Forest</strong> Plan is predicted to have a low risk of<br />
adversely affecting Dolly Varden char. It states; ”The conservation of<br />
habitats for Dolly Varden char, which have widespread distribution<br />
throughout nearly all suitable freshwater, particularly small<br />
freshwater streams and lakes, is provided through the<br />
implementation of <strong>Forest</strong> standards and guidelines. These standards<br />
and guidelines are designed to protect key elements of Dolly Varden<br />
habitat, such as stream banks, riparian vegetation, and water quality.<br />
Implementing the Revised <strong>Forest</strong> Plan would have a low probability<br />
of impacting Dolly Varden char habitat” (ROD, V, B-1, p38).<br />
Moreover, approximately 95% of all watersheds have prescriptions<br />
that are non-developmental in nature and any effects are likely highly<br />
localized and minor (FEIS, 3-113). A general lack of nexus exists<br />
between management prescriptions in the <strong>Forest</strong> Plan with response<br />
reaches of stream that hold robust populations of Dolly Varden char.<br />
Completion of this monitoring protocol is planned for 2010.<br />
• Are the reports adequate or are any modifications needed? The<br />
reports are adequate to help determine distributions of Dolly Varden.<br />
However, they are pre-cursory in nature and meant to help guide the<br />
selection of stream reaches needed to monitor <strong>Forest</strong> Plan<br />
implementation.<br />
Summary of monitoring and evaluation: Generally, there is a lack of<br />
distribution and abundance data for Dolly Varden char across the <strong>Forest</strong>.<br />
Specifically, larger, more robust populations with multiple age classes<br />
would be needed for any evaluation of populations and their response to<br />
habitat change. In 2003, fish population surveys were conducted in three<br />
FIVE-YEAR MONITORING AND EVALUATION REPORT 23
drainages of Prince William Sound and the Copper River Delta. Suitable<br />
populations of char were found in these drainages, but most reaches are<br />
open to anadromous fish. In 2004, ten drainages were sampled for Dolly<br />
Varden and only one stream had char above a known barrier. Choosing<br />
streams above barriers to anadromous fish passage helps limit population<br />
variability introduced from the marine environment when evaluating effects<br />
of the <strong>Forest</strong> Plan implementation.<br />
What are the population trends for Coho salmon and the relationship to<br />
habitat change?<br />
• Frequency of collection and evaluation: Annual / 5 th year<br />
• MEIT Ranking: 23<br />
• Status as of FY07: Monitored in 2004. Generally, there is a lack of<br />
distribution and especially abundance data for coho salmon across<br />
the <strong>Forest</strong>. Specifically, larger, more robust populations with multiple<br />
age classes would be needed for any evaluation of populations and<br />
their response to habitat change. Twenty-two drainages were<br />
sampled across the <strong>Forest</strong> to determine population<br />
presence/absence and/or structure.<br />
• Any need to change <strong>Forest</strong> Plan or implementation of Plan? No.<br />
• Any need to change monitoring protocols or question to be<br />
sure we are getting information we want? MEIT interpreted the<br />
question to be the relationship of Coho Salmon populations and<br />
habitat change. The <strong>Forest</strong> Plan is predicted to have a low risk of<br />
adversely affecting coho salmon. It states: “The likelihood of forest<br />
management activities affecting the quantity and quality of coho<br />
habitat is low due to the implementation of <strong>Forest</strong>wide standards and<br />
guidelines at the project level and the allowance for fish habitat<br />
improvement projects within nearly all management areas on the<br />
Chugach (ROD, V, B-1, p38).” Moreover, approximately 95% of all<br />
watersheds fall into prescriptions that are non-developmental in<br />
nature and any effects are likely highly localized and minor (FEIS, 3-<br />
113). There is also a general lack of nexus between management<br />
prescriptions in the <strong>Forest</strong> Plan with response reaches of stream that<br />
hold robust populations of coho salmon. A review of this monitoring<br />
question is planned for 2010. The FY07 accomplishment report<br />
noted that protocol still needs substantial work. Anticipated<br />
completion date is 2010.<br />
• Are the reports adequate or are any modifications needed? The<br />
reports are adequate to help determine distributions of coho salmon.<br />
However, they are pre-cursory in nature and meant to help guide the<br />
selection of stream reaches needed to monitor <strong>Forest</strong> Plan<br />
implementation.<br />
24 FIVE-YEAR MONITORING AND EVALUATION REPORT
Species of Special Interest<br />
Is <strong>Forest</strong> management maintaining favorable conditions for sustaining<br />
gray wolves?<br />
• Frequency of collection and evaluation: Annual / 5 th year<br />
• MEIT Ranking: not in top 30<br />
• Status as of FY07: No monitoring or evaluation has occurred.<br />
• Any need to change <strong>Forest</strong> Plan or implementation of Plan? No<br />
information is available to make a determination.<br />
• Any need to change monitoring protocols or question to be<br />
sure we are getting information we want? <strong>Forest</strong> monitoring<br />
protocols have not been developed.<br />
• Are the reports adequate or are any modifications needed?<br />
None to review.<br />
Is <strong>Forest</strong> management maintaining favorable conditions for sustaining<br />
Kenai wolverines?<br />
• Frequency of collection and evaluation: Annual / 5 th year<br />
• MEIT Ranking: not in top 30<br />
• Status as of FY07: No monitoring or evaluation has occurred.<br />
• Any need to change <strong>Forest</strong> Plan or implementation of Plan? No<br />
information is available to make a determination.<br />
• Any need to change monitoring protocols or question to be<br />
sure we are getting information we want? <strong>Forest</strong> monitoring<br />
protocols have not been developed.<br />
• Are the reports adequate or are any modifications needed?<br />
None to review.<br />
Summary of monitoring and evaluation: <strong>Monitoring</strong> with respect to the<br />
<strong>Forest</strong> Plan has not been done however the Seward Ranger District has<br />
conducted some winter aerial surveys. The following summarizes that<br />
data.<br />
a) Is <strong>Forest</strong> management maintaining favorable conditions for<br />
sustaining Kenai wolverines? No information is available to make a<br />
determination.<br />
b) Have the numbers of wolverines on the <strong>Forest</strong> increased,<br />
decreased, or remained the same? Winter aerial survey work in 2004<br />
quantified the number of wolverines by tracks after snow events. This<br />
information provided a minimum count of wolverines on a portion of the<br />
Kenai Peninsula that overlapped onto the <strong>Forest</strong>. These results provided<br />
baseline data that could assist with determining the status and trends of<br />
wolverines on the <strong>Forest</strong>.<br />
c) Are Kenai wolverines isolated from mainland populations of<br />
wolverines? This question has not been answered in the type of<br />
monitoring that has been done to date. It could be answered by<br />
conducting DNA analyses of harvested wolverines.<br />
FIVE-YEAR MONITORING AND EVALUATION REPORT 25
d) What are the limiting factors for wolverines on the <strong>Forest</strong>? This<br />
information was not provided in monitoring reports. However, since<br />
wolverine population density and reproductive potential is low relative to<br />
other furbearers, it is important for management agencies to closely<br />
monitor wolverine populations and those human activities that could<br />
adversely affect them. Wolverines seem to prefer foothills and<br />
mountainous areas, which usually are lightly developed by humans but<br />
are often favored areas for hunting, trapping, snowmachining, and other<br />
outdoor activities.<br />
e) How have <strong>Forest</strong> activities influenced the limiting factors? The<br />
effects of winter recreational access and other <strong>Forest</strong> activities on<br />
wolverines are unknown. Data collected from radio-collared wolverines<br />
could assist with determining whether <strong>Forest</strong> activities are limiting factors.<br />
Recommendations of remedial action: None<br />
Actions taken in response to recommendations identified in previous<br />
reports: None<br />
Other Recommendations: Wolverine populations and their reproductive<br />
potential are relatively lower than any other species on the <strong>Forest</strong>.<br />
Therefore, the <strong>Forest</strong> should continue work to determine if <strong>Forest</strong> activities<br />
are limiting factors on wolverines.<br />
Is <strong>Forest</strong> management maintaining favorable conditions for sustaining<br />
Townsend warblers?<br />
• Frequency of collection and evaluation: every 5 th year for both<br />
• MEIT Ranking: not in top 30<br />
• Status as of FY07: Not funded, no monitoring or evaluation<br />
occurred.<br />
• Any need to change <strong>Forest</strong> Plan or implementation of Plan? No<br />
information is available to make a determination.<br />
• Any need to change monitoring protocols or question to be<br />
sure we are getting information we want? <strong>Forest</strong> monitoring<br />
protocols have not been developed.<br />
• Are the reports adequate or are any modifications needed?<br />
None to review.<br />
Is <strong>Forest</strong> management maintaining favorable conditions for sustaining<br />
northern goshawks?<br />
• Frequency of collection and evaluation: Annual/ every 5 th year<br />
• MEIT Ranking: not in top 30<br />
• Status as of FY07: Not funded, no monitoring or evaluation has<br />
occurred.<br />
26 FIVE-YEAR MONITORING AND EVALUATION REPORT
• Any need to change <strong>Forest</strong> Plan or implementation of Plan? No<br />
information is available to make a determination.<br />
• Any need to change monitoring protocols or question to be<br />
sure we are getting information we want? <strong>Forest</strong> monitoring<br />
protocols have not been developed.<br />
• Are the reports adequate or are any modifications needed?<br />
None to review.<br />
Is <strong>Forest</strong> management maintaining favorable conditions for sustaining<br />
Sitka black-tailed deer?<br />
• Frequency of collection and evaluation: Annual/ every 5 th year<br />
• MEIT Ranking: not in top 30<br />
• Status as of FY07: Populations monitored by ADF&G. Not funded<br />
by <strong>Forest</strong> <strong>Service</strong>, no evaluation has occurred.<br />
• Any need to change <strong>Forest</strong> Plan or implementation of Plan? No<br />
information is available to make a determination.<br />
• Any need to change monitoring protocols or question to be<br />
sure we are getting information we want? <strong>Forest</strong> monitoring<br />
protocols have not been developed.<br />
• Are the reports adequate or are any modifications needed?<br />
None to review.<br />
Is <strong>Forest</strong> management maintaining favorable conditions for sustaining<br />
the Montague Island marmot?<br />
• Frequency of collection and evaluation: once in 5 years / every 5 th<br />
year (if found to be present, adjustments will be made to schedule)<br />
• MEIT Ranking: not in top 30<br />
• Status as of FY07: Not funded, no monitoring or evaluation has<br />
occurred.<br />
• Any need to change <strong>Forest</strong> Plan or implementation of Plan? No<br />
information is available to make a determination.<br />
• Any need to change monitoring protocols or question to be<br />
sure we are getting information we want? <strong>Forest</strong> monitoring<br />
protocols have not been developed.<br />
• Are the reports adequate or are any modifications needed?<br />
None to review.<br />
Is <strong>Forest</strong> management maintaining favorable conditions for sustaining<br />
cutthroat trout?<br />
• Frequency of collection and evaluation: Annual/ every 5 th year<br />
• MEIT Ranking: not in top 30<br />
• Status as of FY07: monitored in FY03 and FY04.<br />
• Any need to change <strong>Forest</strong> Plan or implementation of Plan? No.<br />
• Any need to change monitoring protocols or question to be<br />
sure we are getting information we want? A review of this<br />
FIVE-YEAR MONITORING AND EVALUATION REPORT 27
monitoring question is planned in FY10 to determine the feasibility of<br />
monitoring populations and habitat in relation to the risk to these<br />
populations from implementing the <strong>Forest</strong> Plan.<br />
• Are the reports adequate or are any modifications needed? The<br />
reports are adequate.<br />
Summary of monitoring and evaluation: <strong>Monitoring</strong> was conducted in<br />
2003 and 2004. Generally, there is a lack of distribution and especially<br />
abundance data for cutthroat trout across the <strong>Forest</strong>. Specifically, larger,<br />
more robust populations with multiple age classes are needed for any<br />
evaluation of populations and their response to habitat change. Therefore,<br />
efforts were focused on distribution and relative abundance in these<br />
surveys.<br />
In response, surveys were conducted in 2003 and 2004 in fifteen<br />
drainages in western Prince William Sound and two drainages of the<br />
Copper River Delta. Cutthroat trout were not observed in any of western<br />
Prince William Sound surveys, however, they were observed in both<br />
drainages of west Copper River Delta. Size selectivity of sampling gear<br />
and other complications with adult salmon made it difficult to determine<br />
the population size structure for juvenile fish. Moreover, population<br />
estimates were attempted for larger fish in these two drainages that<br />
indicated relatively small populations overall. Because of these small<br />
population sizes it is questionable if they would be large enough to<br />
monitor.<br />
Overall, the results indicate that cutthroat trout are more limited in their<br />
distribution and abundance than originally thought. However, cutthroat<br />
trout occur entirely within areas having management prescriptions that are<br />
not likely to adversely affect populations or habitat.<br />
Threatened, Endangered and Sensitive Animal Species<br />
What are the population trends for trumpeter swans and the relationship<br />
to habitat change?<br />
• Frequency of collection and evaluation: Annual / every 5 th year<br />
• MEIT Ranking: not in top 30<br />
• Status as of FY07: Monitored in FY03, FY04, FY05, and FY06.<br />
<strong>Monitoring</strong> protocols are being developed.<br />
• Any need to change <strong>Forest</strong> Plan or implementation of Plan? No.<br />
• Any need to change monitoring protocols or question to be<br />
sure we are getting information we want? The MEIT reinterpreted<br />
general monitoring questions from the Revised <strong>Forest</strong> Plan when<br />
they were not clearly stated as a <strong>Forest</strong> Plan monitoring question.<br />
Based on the information presented for this question in Table 5-1 of<br />
the <strong>Forest</strong> Plan, MEIT rephrased it to “What are the population<br />
trends for trumpeter swans and the relationship to habitat change?”<br />
The question was revised in FY07 from “what are the status and<br />
28 FIVE-YEAR MONITORING AND EVALUATION REPORT
trends of trumpeter swans?” to reflect the MEIT interpretation. When<br />
the protocol is approved, the monitoring question will be revised in<br />
the <strong>Forest</strong> Plan to reflect MEIT recommendations. The anticipated<br />
protocol completion date is FY09.<br />
• Are the reports adequate or are any modifications needed? The<br />
reports are adequate for determining if the number of trumpeter<br />
swans have increased, decreased, or remained the same. They are<br />
inadequate for determining the characteristics of nesting and brood<br />
rearing habitats and if the habitats have changed. They are<br />
inadequate for determining what factors most greatly affect trumpeter<br />
swan nesting and recruitment success.<br />
Summary of monitoring and evaluation: The USFWS monitors<br />
trumpeter swans throughout the State of Alaska every 5 years. Biannual<br />
surveys are conducted on the Copper River Delta by USFWS with<br />
financial assistance from USFS. The Cordova and Seward Ranger<br />
Districts have conducted trumpeter swan surveys. Surveys reported the<br />
overall number of swans observed and provided observations on young<br />
produced. Following is a summary of the report results relevant to the<br />
monitoring questions.<br />
a) Have the numbers of trumpeter swans nesting on the <strong>Forest</strong><br />
increased, decreased or remained the same? On the area surveyed on<br />
the Copper River Delta, the trumpeter swan population is above the long<br />
term average and from FY03 to FY04, the numbers of swans increased. In<br />
May 2004, 940 white swans (adults and sub-adults) were counted, up 3%<br />
from the spring of 2003 and 44% above the mean. The forest service has<br />
not funded monitoring on the Delta since then; however, surveys have<br />
been conducted annually by USFWS since 1968. The lowest population<br />
count for the Cordova Ranger District was 500 but reached a high of 1,222<br />
birds in 2001.<br />
The total number of swans observed on the Seward Ranger District in the<br />
area surveyed in the spring in 2006 was 29, in 2005 – 34, and spring of<br />
2004 -19. These data suggest that swan numbers have increased on the<br />
Seward Ranger District. It is unclear whether the fluctuations in numbers<br />
are a result of the timing of the flights.<br />
b) What are the characteristics of trumpeter swan nesting and brood<br />
rearing habitat, and have they changed? Swans on Cordova and<br />
Seward Ranger Districts appear to be using wetlands, slow-moving<br />
channels, and small lakes during the summer breeding season. More<br />
specific characteristics of nesting and brood rearing habitat have not been<br />
analyzed. It is expected that swan nesting habitat on Cordova and Seward<br />
Ranger Districts is similar to other areas used by swans and evaluated<br />
FIVE-YEAR MONITORING AND EVALUATION REPORT 29
elsewhere. The long term effects of vegetation succession on swan<br />
nesting and brooding habitat is an unknown for the Copper River Delta.<br />
c) What are the factors that most greatly affect trumpeter swan<br />
nesting and recruitment success? A specific study has not been<br />
initiated to evaluate factors that affect trumpeter swan nesting and<br />
recruitment. However, the Cordova District along with USFWS has a long<br />
term data set for nesting and recruitment on the Copper River Delta. In<br />
2004, a total of 189 cygnets in 59 broods were observed in August, equal<br />
to and 5% above the mean, respectively. Nest success, defined as the<br />
proportion of occupied nests in May that produced at least one cygnet still<br />
alive in August, was 26% below the mean at 0.37.<br />
Recommendations of remedial action for this monitoring item: None.<br />
Actions taken in response to recommendations identified in previous<br />
reports: None.<br />
Other Recommendations: None.<br />
<strong>Forest</strong> Products<br />
Are harvested forestlands restocked?<br />
• Frequency of collection and evaluation: Annual sample of<br />
selected areas/ annual<br />
• MEIT Ranking: 29<br />
• Status as of FY07: The protocol was completed and approved in<br />
2007. Harvested forestlands are surveyed according to Regional<br />
reforestation certification protocols. No <strong>Forest</strong> Plan level evaluation<br />
has occurred of reforestation stocking surveys. All harvested areas<br />
are surveyed to ensure they meet restocking guidelines by year 5.<br />
None have been identified as not meeting guidelines.<br />
• Any need to change <strong>Forest</strong> Plan or implementation of Plan? No<br />
information is available to make a determination.<br />
• Any need to change monitoring protocols or question to be<br />
sure we are getting information we want? No.<br />
• Are the reports adequate or are any modifications needed?<br />
None to review.<br />
Have conditions changed that would affect the suitability of timber<br />
production lands?<br />
• Frequency of collection and evaluation: every 10 years for both.<br />
• MEIT Ranking: 25<br />
• Status as of FY07: The protocol was completed and approved in<br />
2007. Not monitored or evaluated.<br />
• Any need to change <strong>Forest</strong> Plan or implementation of Plan? No<br />
30 FIVE-YEAR MONITORING AND EVALUATION REPORT
• Any need to change monitoring protocols or question to be<br />
sure we are getting information we want? No. the MEIT first<br />
interpreted this question to be “Have lands once identified as<br />
unsuitable for timber production been examined to determine if they<br />
have become suitable.” While the protocols were being developed in<br />
2007, it was determined that the trigger for the analysis and<br />
evaluation was a letter from the timber interests requesting a timber<br />
sale program (the condition to change). Then lands would be<br />
examined to determine if they were suitable. Currently no lands on<br />
the Chugach National <strong>Forest</strong> are classified as suitable for timber<br />
production.<br />
• Are the reports adequate or are any modifications needed?<br />
None required yet.<br />
Minerals<br />
Are mining plans of operations consistent with Revised <strong>Forest</strong> Plan<br />
direction?<br />
• Frequency of collection and evaluation: One time collection /<br />
every 5 th year.<br />
• MEIT Ranking: 24<br />
• Status as of FY07: Not monitored. In 2007, this item was<br />
determined to be an inventory and was dropped from the monitoring<br />
strategy. Mining plans of operations are inventoried using the INFRA<br />
database for locatable minerals. Numbers and locations of plans of<br />
operations vary widely from year to year according to public interest<br />
which is often directly reflective of the price of gold and other metals.<br />
Current or recently active plans were inventoried and entered into<br />
the locatable database during 2008 and reports can be directly<br />
generated from the database. Data is to be collected and entered<br />
routinely as new plans are submitted, changes to existing plans<br />
occur, or with routine administration such as inspections; updates<br />
should not be accomplished only on a set periodic basis. Plans of<br />
operations are approved consistent with the Standards and<br />
Guidelines in the Revised Land and Resource Management Plan<br />
and administered to standard by following regulations at 36 CFR<br />
228A and guidance at FSM 2810. The inventory is due to be<br />
completed in 2008.<br />
• Any need to change monitoring protocols or question to be<br />
sure we are getting information we want? Yes, this item needs to<br />
be dropped from the <strong>Forest</strong> Plan monitoring strategy.<br />
• Are the reports adequate or are any modifications needed? N/A<br />
Heritage Resources<br />
Are National Register eligible heritage resources being adequately<br />
maintained and protected?<br />
• Frequency of collection and evaluation: Annual for both<br />
FIVE-YEAR MONITORING AND EVALUATION REPORT 31
• MEIT Ranking: 2<br />
• Status as of FY07: No monitoring or evaluation has occurred.<br />
Protocol has been through final review, but not yet approved by FLT.<br />
• Any need to change <strong>Forest</strong> Plan or implementation of Plan? Not<br />
at this time – Pilot protocol is being implemented in FY08.<br />
• Any need to change monitoring protocols or question to be<br />
sure we are getting information we want? The anticipated date for<br />
approval of protocol is the end of FY09. Although reviewers had<br />
approved the initial protocol in FY07, in FY08 comments from the<br />
Regional Office were incorporated into the protocol and implemented<br />
on a trial basis. The question and protocol implementation will be<br />
reviewed in FY09, changes made if necessary, and approved.<br />
• Are the reports adequate or are any modifications needed?<br />
None to review.<br />
What is the status and condition of heritage resources on the<br />
<strong>Forest</strong>?<br />
• Frequency of collection and evaluation: Annual for both<br />
• MEIT Ranking: 1<br />
• Status as of FY07: No monitoring or evaluation has occurred.<br />
Protocol has been through final review, but not approved by FLT.<br />
• Any need to change <strong>Forest</strong> Plan or implementation of Plan? Not<br />
at this time – Pilot protocol is being implemented in 2008.<br />
• Any need to change monitoring protocols or question to be<br />
sure we are getting information we want? Anticipated date for<br />
approval of protocol is by the end of 2009. Although reviewers had<br />
approved the initial protocol in FY07, in FY08, comments from the<br />
Regional Office were incorporated into the protocol and implemented<br />
on a trial basis. The question and protocol implementation will be<br />
reviewed in FY09, changes made if necessary, and approved.<br />
• Are the reports adequate or are any modifications needed?<br />
None to review.<br />
Recreation Opportunities, Tourism, Access, and Facilities<br />
What are the characteristics of recreational visitors? What is their<br />
pattern of recreational use? What are their perceptions of opportunities<br />
and settings?<br />
• Frequency of collection and evaluation: Once every 5 years /<br />
every 5 th year<br />
• MEIT Ranking: 11<br />
• Status as of FY07: Monitored in FY03 and FY05. Next National<br />
Visitor Use <strong>Monitoring</strong> (NVUM) scheduled for 2008.<br />
• Any need to change <strong>Forest</strong> Plan or implementation of Plan? No.<br />
• Any need to change monitoring protocols or question to be<br />
sure we are getting information we want? The MEIT suggested<br />
changing and the FY08 NVUM survey included additional questions<br />
32 FIVE-YEAR MONITORING AND EVALUATION REPORT
to improve information collected.<br />
• Are the reports adequate or are any modifications needed? The<br />
report is produced by NVUM staff and is adequate for our use.<br />
Additionally, raw data is available if we want to further analyze.<br />
Is the Revised <strong>Forest</strong> Plan direction for motorized and non-motorized<br />
access working?<br />
• Frequency of collection and evaluation: Annual/ every 5 th year<br />
• MEIT Ranking: 9<br />
• Status as of FY07: No monitoring or evaluation has occurred. The<br />
protocol is currently being reviewed by Recreation, Lands and<br />
Minerals Staff Officer.<br />
• Any need to change <strong>Forest</strong> Plan or implementation of Plan?<br />
With completion of the Kenai Winter Access EIS, summer and winter<br />
uses are defined. Recent implementation of the new Access Travel<br />
Management Rule, for summer off-highway uses, has surfaced<br />
several roads not currently in the <strong>Forest</strong> inventory that need to be<br />
added.<br />
• Any need to change monitoring protocols or question to be<br />
sure we are getting information we want? Anticipated date for<br />
approval of protocol is the 2 nd quarter, FY09.<br />
• Are the reports adequate or are any modifications needed? No<br />
report to review.<br />
Are areas of the <strong>Forest</strong> being managed in accordance with the<br />
prescribed Recreation Opportunity Spectrum (ROS) class in <strong>Forest</strong>wide<br />
standards and guidelines?<br />
• Frequency of collection and evaluation: Annual/ every 5 th year<br />
• MEIT Ranking: not in top 30<br />
• Status as of FY07: Not funded, no monitoring or evaluation has<br />
occurred.<br />
• Any need to change <strong>Forest</strong> Plan or implementation of Plan? No<br />
information is available to make a determination.<br />
• Any need to change monitoring protocols or question to be<br />
sure we are getting information we want? <strong>Forest</strong> monitoring<br />
protocols have not been developed.<br />
• Are the reports adequate or are any modifications needed?<br />
None to review.<br />
What is the use of developed recreational facilities and how does it<br />
compare to capacity?<br />
• Frequency of collection and evaluation: Annual for both<br />
• MEIT Ranking: 12<br />
• Status as of FY07: No monitoring or evaluation has occurred.<br />
Protocol being reviewed.<br />
FIVE-YEAR MONITORING AND EVALUATION REPORT 33
• Any need to change <strong>Forest</strong> Plan or implementation of Plan? No<br />
information is available to make a determination.<br />
• Any need to change monitoring protocols or question to be<br />
sure we are getting information we want? Anticipated date for<br />
approval of protocol is 2 nd quarter FY09.<br />
• Are the reports adequate or are any modifications needed?<br />
None to review.<br />
What are the trends in commercial recreation services on the <strong>Forest</strong> and<br />
how does it compare to capacity?<br />
• Frequency of collection and evaluation: Annual/ every 5 th year<br />
• MEIT Ranking: not in top 30<br />
• Status as of FY07: No monitoring or evaluation has occurred.<br />
Protocol currently being reviewed by Recreation, Lands and Minerals<br />
Staff Officer.<br />
• Any need to change <strong>Forest</strong> Plan or implementation of Plan? The<br />
area of the <strong>Forest</strong> currently of most concern, Prince William Sound,<br />
is receiving increased emphasis with the PWS Framework, a project<br />
to gather information on recreation use, places and patterns as well<br />
as information on heritage and wildlife areas. Project will lead to<br />
analysis of capacity for commercial and non-commercial allocations<br />
in the Sound. Need for change unknown at this time.<br />
• Any need to change monitoring protocols or question to be<br />
sure we are getting information we want? Anticipated date for<br />
approval of protocol is 2 nd quarter of FY09.<br />
• Are the reports adequate or are any modifications needed?<br />
None to review.<br />
Scenic Quality<br />
Are areas of the <strong>Forest</strong> being managed in accordance with the Scenery<br />
Integrity Objectives (SIO) in <strong>Forest</strong>wide Standards and Guidelines?<br />
• Frequency of collection and evaluation: Annual sample of<br />
selected areas/ every 5 th year<br />
• MEIT Ranking: 8<br />
• Status as of FY07: No monitoring or evaluation has occurred. FY07<br />
accomplishment report notes that protocol still needs substantial<br />
work. Protocol being reviewed by Recreation, Lands and Minerals<br />
Staff Officer.<br />
• Any need to change <strong>Forest</strong> Plan or implementation of Plan? No<br />
change in <strong>Forest</strong> Plan needed at this time.<br />
• Any need to change monitoring protocols or question to be<br />
sure we are getting information we want? Anticipated date for<br />
completion of protocol is 2 nd quarter of FY09.<br />
• Are the reports adequate or are any modifications needed?<br />
None to review.<br />
34 FIVE-YEAR MONITORING AND EVALUATION REPORT
Fire Protection and Fuels Management<br />
What is the pattern of abundance of different fuel types on the Kenai<br />
Peninsula?<br />
• Frequency of collection and evaluation: Once every 5 years /<br />
every 5 th year<br />
• MEIT Ranking: 13<br />
• Status as of FY07: The protocol is being finalized and includes four<br />
methodologies applied to the Kenai Peninsula Geographic Area:<br />
1) Annual review of fire and fuels project records. If more than 20<br />
percent of the management areas or fire/fuels projects fail in<br />
meeting goals, objectives, standards, and guidelines, then a<br />
subjective evaluation would be triggered on whether or not more<br />
follow up (and perhaps management action) is needed. This<br />
methodology is being implemented in FY08 and results will be<br />
reported at year’s end.<br />
2 http://frcc.gov/<br />
2) Annual review of information in the national NFPORS, FACTS,<br />
and INFRA databases on fire and fuels activities. If more than 20<br />
percent of the management areas or fire/fuels projects fail in<br />
meeting goals, objectives, standards, and guidelines, then a<br />
subjective evaluation would be triggered on whether or not more<br />
follow up (and perhaps management action) is needed. This<br />
methodology is being implemented in FY08 and results will be<br />
reported at years end.<br />
3) Fire Regime and Condition Class (FRCC) 2<br />
evaluation every<br />
five years. FRCC will be mapped using remote sensing and<br />
represents the degree of departure of current conditions from<br />
reference conditions (areas of FRCC class 3 would be of highest<br />
concern to management since they represent the greatest<br />
departure from reference conditions).<br />
4) Fuel Characteristics Classification System (FCCS) 3<br />
evaluation<br />
every five years. The fuel bed fire potential of FCCS will be<br />
mapped using remote sensing and represents the fuel complex<br />
based on potential fire behavior, crown fire, and available fuels.<br />
• Any need to change <strong>Forest</strong> Plan or implementation of Plan? The<br />
information is not yet available to make the determination; however<br />
the initial results of the monitoring will be available late in FY08.<br />
• Any need to change monitoring protocols or question to be<br />
sure we are getting information we want? The MEIT interpreted<br />
the monitoring question to be “Are human life, property, and facilities<br />
3 http://www.fs.fed.us/pnw/fera/fccs/<br />
FIVE-YEAR MONITORING AND EVALUATION REPORT 35
eing protected from wildland fire hazards?” When the protocol is<br />
approved, the monitoring question will be revised in the <strong>Forest</strong> Plan<br />
to reflect MEIT recommendations. A draft protocol exists. The final<br />
protocol is anticipated by late 2008. Reevaluation of the protocol will<br />
occur every 5 years beginning in FY12.<br />
• Are the reports adequate or are any modifications needed?<br />
None to review.<br />
Wilderness<br />
Is the wilderness character of the Wilderness Study Area (WSA) and<br />
areas recommended for Wilderness being maintained?<br />
• Frequency of collection and evaluation: Annual sample of<br />
selected areas/ every 5 years<br />
• MEIT Ranking: 3<br />
• Status as of FY07: Not monitored or evaluated. FY07<br />
accomplishment report notes that protocol still needs substantial<br />
work. Currently working with Tongass NF and intend to tier off their<br />
wilderness protocol<br />
• Any need to change <strong>Forest</strong> Plan or implementation of Plan? No<br />
change in <strong>Forest</strong> Plan needed at this time.<br />
• Any need to change monitoring protocols or question to be<br />
sure we are getting information we want? Anticipated date for<br />
completion of protocol is unknown at this time.<br />
• Are the reports adequate or are any modifications needed?<br />
None to review.<br />
Research Natural Areas<br />
Are proposed and established Research Natural Areas (RNA) being<br />
maintained in a state unmodified by human activity?<br />
• Frequency of collection and evaluation: Once in 10 years / 10 th<br />
year (<strong>Forest</strong> Plan); new protocol frequency of data collection and<br />
evaluation depends on methodology used.<br />
• MEIT Ranking: 16<br />
• Status as of FY07: No monitoring or evaluation has occurred.<br />
Protocol completed and approved in 2007 and includes two<br />
methodologies:<br />
1) Annual review of information in the corporate FACTS, INFRA,<br />
TIM, SUDS, and PALS databases. This review will note if any<br />
activities not allowed under the RNA prescription are proposed or<br />
occurring within the network. The occurrence of any activity not<br />
allowed would require immediate management action to bring the<br />
area into compliance. The database review methodology is being<br />
implemented in 2008 and results will be reported at years end.<br />
2) Visitor effects monitoring will occur every five years using<br />
methods derived from Cole (1989) and Monz (1998). This<br />
monitoring will detect if human caused damage is occurring<br />
36 FIVE-YEAR MONITORING AND EVALUATION REPORT
within the RNA network. Such changes would then be interpreted<br />
in regard to the extent they interfere with the purposes for which<br />
the affected RNAs were established (as described in the<br />
respective establishment records). The greater the aggregate<br />
size of the affected area and the more intense the damage, the<br />
greater the likelihood that natural processes could be impacted<br />
and that management action is called for.<br />
• Any need to change <strong>Forest</strong> Plan or implementation of Plan?<br />
Initial results of this monitoring will not be available until late in FY08<br />
so the information is not presently available to make the<br />
determination.<br />
• Any need to change monitoring protocols or question to be<br />
sure we are getting information we want? The <strong>Monitoring</strong> and<br />
<strong>Evaluation</strong> Interdisciplinary Team interpreted the monitoring question<br />
to be “Are proposed and established Research Natural Areas (RNA)<br />
being maintained in a manner consistent with the purposes for which<br />
the area was established?” When the protocol is approved, the<br />
monitoring question will be revised in the <strong>Forest</strong> Plan to reflect MEIT<br />
recommendations. Reevaluation of the protocol will occur every 5<br />
years beginning in FY12.<br />
• Are the reports adequate or are any modifications needed?<br />
None to review.<br />
Community Effects<br />
What are the trends in local economies?<br />
• Frequency of collection and evaluation: Annual/ every 3 years<br />
• MEIT Ranking: Not in top 30<br />
• Status as of FY07: Not monitored or evaluated (not funded).<br />
• Any need to change <strong>Forest</strong> Plan or implementation of Plan? No<br />
information to make a determination.<br />
• Any need to change monitoring protocols or question to be<br />
sure we are getting information we want? Not at this time since<br />
item has not been funded to date. The monitoring question should be<br />
looked at if and when funding becomes available. <strong>Forest</strong> monitoring<br />
protocols have not been developed.<br />
• Are the reports adequate or are any modifications needed?<br />
None to review.<br />
What are the effects of National <strong>Forest</strong> management on lands, resources<br />
and communities adjacent to the <strong>Forest</strong>?<br />
• Frequency of collection and evaluation: Once every 5 years/<br />
every 5 th year<br />
• MEIT Ranking: Not in top 30<br />
• Status as of FY07: Not monitored or evaluated (not funded)<br />
• Any need to change <strong>Forest</strong> Plan or implementation of Plan? No<br />
information to make a determination.<br />
FIVE-YEAR MONITORING AND EVALUATION REPORT 37
• Any need to change monitoring protocols or question to be<br />
sure we are getting information we want? Not at this time since<br />
item has not been funded to date. The monitoring question should be<br />
looked at if and when funding becomes available. <strong>Forest</strong> monitoring<br />
protocols have not been developed.<br />
• Are the reports adequate or are any modifications needed?<br />
None to review.<br />
Additional Questions<br />
What are the population trends for mountain goat and the relationship to<br />
habitat change?<br />
Note: This general question was added to comply with the 1982 planning<br />
regulations regarding MIS (36 CFR 219.19), and to meet the intent of the<br />
general MIS monitoring question on page 5-8 of the <strong>Forest</strong> Plan (also listed<br />
on page 5 of this report). The mountain goat is an MIS on Chugach National<br />
<strong>Forest</strong>, and therefore, population and habitat trends are subject to monitoring.<br />
• Frequency of collection and evaluation: Annual / every 3 rd year<br />
• MEIT Ranking: 19<br />
• Status as of FY07: Monitored in FY03, FY04, FY05, and FY06.<br />
FY07 accomplishment report notes that protocol still needs<br />
substantial work.<br />
• Any need to change <strong>Forest</strong> Plan or implementation of Plan?<br />
Yes. This monitoring question is to be added to the <strong>Forest</strong> Plan.<br />
• Any need to change monitoring protocols or question to be<br />
sure we are getting information we want? The MEIT reinterpreted<br />
general monitoring questions from the <strong>Forest</strong> Plan if they were not<br />
clearly stated as a <strong>Forest</strong> Plan monitoring question. Based on the<br />
information presented for this question in Table 5-1 of the <strong>Forest</strong><br />
Plan, MEIT revised it to “What are the population trends for mountain<br />
goats and the relationship to habitat change?” In 2007, it was<br />
decided to change the monitoring question to reflect MEIT<br />
interpretation. Anticipated date for completion of protocol is October<br />
2008. When the protocol is approved, the monitoring question will be<br />
added to the <strong>Forest</strong> Plan to reflect MEIT recommendations.<br />
• Are the reports adequate or are any modifications needed? The<br />
reports to date are not adequate to determine if forest management<br />
is maintaining conditions favorable for sustaining mountain goats, if<br />
management is respecting the guidelines for distances between<br />
activities and important goat habitat and what the population trends<br />
are for mountain goat and the relationship to habitat change.<br />
However, a master’s thesis soon to be completed will provide<br />
sufficient information to address the first two items. The new<br />
protocols being developed will also improve our ability to answer the<br />
questions about goats.<br />
38 FIVE-YEAR MONITORING AND EVALUATION REPORT
Summary of monitoring and evaluation: The process being<br />
implemented first establishes the populations, locations, and habitat of the<br />
mountain goat, and subsequently determines the location of the motorized<br />
use and effects on the mountain goat.<br />
Population trends for mountain goats and their relationship to habitat has<br />
not been reported by the <strong>Forest</strong> in Annual <strong>Monitoring</strong> <strong>Report</strong>s. It should be<br />
noted that this is a two part question. The first step is to conduct<br />
population surveys for mountain goats and to conduct these surveys<br />
regularly to establish population trend data. To date, surveys have been in<br />
the winter and this is not an optimum time of year to survey mountain<br />
goats for a total population count. Goats are more visible in the summer<br />
and population estimates would be more reliable during this season.<br />
ADF&G conducts surveys for goats and possibly these surveys could be<br />
used for population trend data. If these data could be used, how these<br />
population trend data are related to habitat would need to be determined.<br />
Cordova District reported the number of goats sighted and the number of<br />
goat trails detected from winter/spring aerial surveys. These surveys were<br />
designed to determine areas of use by goats and then compared to a<br />
habitat capability model developed by Suring et al. (1988. Habitat<br />
capability model for mountain goats in Southeast Alaska: Winter Habitat.)<br />
Most goat sightings were within the range of the model. However, since it<br />
is difficult to locate and observe goats in the winter it remains unknown if<br />
the survey data are representative of the entire population.<br />
Glacier District developed a study to assess the potential bias in predicting<br />
goat distribution using only goat locations collected from aerial survey by<br />
incorporating goats with radio telemetry collars. After this step is complete<br />
they plan to identify habitat variables significant across both datasets and<br />
settle on a final model for predicting mountain goat habitat by season.<br />
Ongoing work on goats with GPS collars will provide additional data and<br />
further our understanding of mountain goat habitat relationships.<br />
In 2006, the Cordova Ranger District surveyed 232 mi 2 for mountain goats<br />
on winter range. Twenty-two goats and 17 goat trails were observed,<br />
resulting in a density of approximately 0.09 goats and 0.07 tracks per mi 2 .<br />
All goats were between 700 and 3500 feet in elevation and most were on<br />
southerly aspects. Not all seemingly suitable habitats revealed goats or<br />
their sign.<br />
The 2006 surveys replicated previous efforts in the same area and will<br />
assist trend analysis and will help the <strong>Forest</strong> identify high goat use areas<br />
and proper implementation of the <strong>Forest</strong> Plan.<br />
Locations of goats and tracks generally agreed with the habitat model<br />
currently used to make management decisions. However, absence of<br />
goats from predicted habitat suggests that other factors may also<br />
influence goat distribution. For this reason, continued mapping of occupied<br />
winter range is recommended rather than relying solely on habitat models.<br />
FIVE-YEAR MONITORING AND EVALUATION REPORT 39
This will allow the <strong>Forest</strong> to maximize management opportunities while<br />
minimizing effects on goat population trends.<br />
a) Is the forest management maintaining favorable conditions for<br />
sustaining mountain goats? The <strong>Forest</strong> has conducted winter surveys<br />
to determine the distribution of goats with regard to the impacts of winter<br />
recreation. Heli-skiing and flight routes are permitted with conditions to<br />
minimize and avoid disturbance of mountain goats. Surveys and habitat<br />
models developed by the <strong>Forest</strong> appear to have provided sufficient<br />
management information for maintaining favorable conditions for<br />
sustaining mountain goats.<br />
b) <strong>Forest</strong>wide guidelines have identified specific distances to be<br />
maintained between activities and important goat habitat. Is<br />
management respecting these guidelines and are they effective?<br />
Guidelines, specific survey data and habitat models have been used by<br />
management to permit winter recreational activities.<br />
<strong>Evaluation</strong>: None.<br />
Recommendations of remedial action: None.<br />
Actions taken in response to recommendations identified in previous<br />
reports: None.<br />
Other Recommendations: None.<br />
Are <strong>Forest</strong> management actions contributing to changes in air quality<br />
on the <strong>Forest</strong>?<br />
Note: This general question was added in response to the Revised <strong>Forest</strong><br />
Plan appeal decision.<br />
• Frequency of collection and evaluation: Once every 3-5 years for<br />
both<br />
• MEIT Ranking: 18<br />
• Status as of FY07: A pilot study was monitored and evaluated in<br />
2007. Pilot protocol was developed in 2006-2007 and approved by<br />
the FLT in November 2007.<br />
• Any need to change <strong>Forest</strong> Plan or implementation of Plan?<br />
Yes. This monitoring question is to be added to the <strong>Forest</strong> Plan.<br />
• Any need to change monitoring protocols or question to be<br />
sure we are getting information we want? Pilot protocol was<br />
approved by the FLT in November 2007. Protocol may need to be<br />
modified prior to additional monitoring to account for changes in site<br />
selection and equipment used, and to further define thresholds.<br />
• Are the reports adequate or are any modifications needed? No<br />
modifications are needed.<br />
40 FIVE-YEAR MONITORING AND EVALUATION REPORT
Summary of monitoring and evaluation: An air quality monitoring pilot<br />
study was conducted on the Chugach National <strong>Forest</strong> during the winter of<br />
2006-2007 to address concerns that winter motorized uses on the <strong>Forest</strong><br />
are impacting air quality. The purpose was to quantify the levels of air<br />
pollutants in areas with high levels of winter motorized use on the<br />
Chugach National <strong>Forest</strong>. The air quality monitoring protocol was<br />
developed as part of the <strong>Forest</strong> Plan <strong>Monitoring</strong> Guide, and the protocol<br />
was implemented from January 2007 to May 2007. Technical assistance<br />
was provided by the Alaska Dept. of Environmental Conservation.<br />
(MacFarlane 2007)<br />
<strong>Forest</strong> <strong>Service</strong> personnel from the Supervisor’s Office and the Glacier<br />
Ranger District measured carbon monoxide and fine particulate<br />
concentrations at Turnagain Pass on a total of 8 days during the 2006-07<br />
winter-motorized season. The west side of Turnagain Pass represents one<br />
of the most heavily used areas on the Chugach National <strong>Forest</strong> for winter<br />
motorized use. Air quality data were analyzed in relation to weather and<br />
use parameters during the sample days, and a report was produced. The<br />
complete “Winter 2007 Air Quality <strong>Monitoring</strong> <strong>Report</strong>, Turnagain Pass,<br />
Alaska, Chugach National <strong>Forest</strong>” prepared by Bill MacFarlane is available<br />
at the <strong>Forest</strong> Supervisor’s Office in Anchorage Alaska.<br />
<strong>Evaluation</strong>: The data show that motorized use at Turnagain Pass resulted<br />
in increased levels of carbon monoxide and fine particulates at sites<br />
measured near the western parking lot. However, the carbon monoxide<br />
and fine particulate data collected on the 8 sample days indicated low<br />
potential for violations of the Alaska State air quality standards. Under the<br />
present motorized use trends at Turnagain Pass, the likelihood of<br />
exceeding the standards as a result of winter motorized use is relatively<br />
low. However, as shown on one of the sample days, a moderate potential<br />
exists for exceeding the standards when high levels of motorized use<br />
occur on cold days with temperature inversions. (MacFarlane 2007)<br />
Recommendations of remedial action for this monitoring item: None.<br />
Other Recommendations: This study was limited in its temporal and<br />
spatial scope, but provides an adequate look at the potential that these<br />
uses are violating State air quality standards. It is recommended that this<br />
type of sampling is repeated every 3 to 5 years to determine future trends<br />
and whether violations of air quality standards are occurring. (MacFarlane<br />
2007)<br />
Fine particulates should be measured, as they are the largest concern for<br />
violations of the State standards from winter motorized use. From a<br />
technical standpoint, the “EBAM” sampler with a battery system performed<br />
well for this type of sampling. Carbon monoxide may also be measured.<br />
FIVE-YEAR MONITORING AND EVALUATION REPORT 41
However, the “PACIII” samplers did not perform well in this environment. If<br />
carbon monoxide is measured, alternate sampling equipment may need to<br />
be acquired and tested. Chugach National <strong>Forest</strong> personnel should work<br />
with the Alaska Department of Environmental Conservation to conduct this<br />
sampling. Sampling should be conducted in high-use areas such as<br />
Turnagain Pass, the Lost Lake trailhead, or the Placer River parking<br />
areas. Because of the remote nature of these sites and the low potential<br />
for exceeding the State air quality standards at this time, it is not feasible<br />
to install permanent air quality monitoring equipment. Sampling should<br />
focus on cold days with temperature inversions and high levels of use in<br />
order to determine the maximum levels of air pollutants that might occur<br />
under these conditions. (MacFarlane 2007)<br />
What is the effect of summer OHV use on soils and/or vegetation where<br />
OHV use is allowed?<br />
Note: This general question was added in response to the Revised <strong>Forest</strong><br />
Plan Appeal Decision.<br />
• Frequency of collection and evaluation: Not defined<br />
• MEIT Ranking: Not in top 30<br />
• Status as of FY07: Monitored on Cordova Ranger District in 2006<br />
and 2007.<br />
• Any need to change <strong>Forest</strong> Plan or implementation of Plan?<br />
Yes. This monitoring question is to be added to the <strong>Forest</strong> Plan.<br />
Summary interpretations are not yet available to make a<br />
determination. Initial interpretations are expected in FY09.<br />
• Any need to change monitoring protocols or question to be<br />
sure we are getting information we want? The soil resource<br />
monitoring protocols are expected to be approved in FY08. The<br />
protocols used to address the level of ground disturbing activities will<br />
include OHV use. The effect of summer OHV use on soils and<br />
vegetation will be included as a subset under that question.<br />
• Are the reports adequate or are any modifications needed? The<br />
existing reports are adequate for the legacy data.<br />
Summary of monitoring: In 2006 and 2007, the Chugach National <strong>Forest</strong><br />
monitored off-highway vehicle (OHV) use on portions of Hawkins and<br />
Hinchinbrook Islands on the Cordova Ranger District. The 2007<br />
monitoring was based on recommendations in the 2006 monitoring report<br />
(Hodges 2006; Meade 2007). The OHV monitoring can be reviewed in the<br />
2007 report prepared by Meade.<br />
The areas monitored are open to OHV use by rural Alaska residents for<br />
subsistence purposes (generally for deer hunting from Aug.1 – Dec. 31) in<br />
both summer and winter. Areas can be closed if natural resources are<br />
significantly impacted by OHV use. For non-subsistence uses, the<br />
following restrictions apply- the Anderson Bay area is open to summer<br />
42 FIVE-YEAR MONITORING AND EVALUATION REPORT
OHV use on designated routes and in all areas for winter use. No routes<br />
have been designated at this time. The Canoe Pass area is closed to<br />
motorized use.<br />
<strong>Five</strong> trail systems were surveyed in 2007, covering approximately 10 miles<br />
of OHV trail. Trails surveyed were located in Anderson Bay on<br />
Hinchinbrook Island and in the Canoe Pass area on Hawkins Island.<br />
Detailed trail data, maps, and photos for each system are presented in the<br />
2007 report prepared by Meade.<br />
Summary of evaluation: The 2007 report notes that some OHV damage<br />
occurred; that it is relatively minimal given the ratio between damage and<br />
trail length, and that damage found in the 2006 survey was not necessarily<br />
in the same trail sections as those found in the survey conducted in 2002.<br />
The report states that the likely reason for this is that vegetation can hide<br />
user-created trails within a few years, and that new damage can occur in a<br />
given trail section and year.<br />
The 2007 report concludes: "There are several stream crossing sites<br />
where extensive damage has occurred. Mitigation measures such as<br />
hardening the surface or rerouting the trail should be implemented as<br />
soon as possible at the Canoe Pass sites and possibly at the Boswell Bay<br />
site. Alternate routes and other possible mitigation measures should be<br />
investigated at lower priority sites in case conditions get worse in the<br />
future"(Meade 2007).<br />
Recommendations for remedial action for this monitoring item: Since<br />
the Canoe Pass trails are relatively close to Cordova, several private<br />
cabins are in the area, and the Canoe Pass inlet provides a sheltered<br />
anchorage for boats, these trails probably receive relatively high OHV use.<br />
Although large sections of these trails are undamaged, disturbances in<br />
some sections of the trail may have become worse since the 2002<br />
surveys. In 2007, recent use was evident on both of these trails.<br />
OHV users on the Canoe Pass trails have tried to minimize damage by<br />
placing logs, culverts, boards, or other materials at most of the stream<br />
crossings and on some of the steeper slopes. These efforts have probably<br />
helped, but haven’t been entirely successful. If continued monitoring<br />
shows that damage is increasing, specific stringer or stream crossing sites<br />
may need to be closed, alternate routes created, damaged areas restored,<br />
or hardened paths created. Placing log stringers or some other material<br />
through wetter areas and reseeding bare soil is recommended. Some of<br />
the crossings at fish-bearing or Class 3 streams may need immediate<br />
restoration work to prevent damage to fish habitat.<br />
FIVE-YEAR MONITORING AND EVALUATION REPORT 43
Actions to recommendations identified in previous reports: One of<br />
the questions to be addressed with this monitoring is the current status of<br />
the effects of OHV use in the Anderson Bay area. This area was an area<br />
of high concern as it had heavy OHV use that caused resource damage in<br />
the past. The low level of resource damage found in the 2006 and 2007<br />
monitoring efforts indicate little or no OHV use is occurring in these areas<br />
now. It appears that some of the damaged areas observed in 2002 may<br />
have healed themselves.<br />
Other Recommendations: The 2006 surveys provided a good database<br />
on the location and extent of soil and vegetation damage caused by OHV<br />
use. No invasive plant species were found during the surveys in 2006 or<br />
2007. Invasive plants are often a concern associated with OHV use<br />
because seeds or plant parts often stick in the mud on the tires and are<br />
transported to new sites.<br />
The main knowledge gap concerns the current use levels and to what<br />
degree the damage is accruing over time. It is possible that the use at<br />
Anderson Bay is low enough that the disturbed trail sections can heal<br />
themselves. In these cases it may not be necessary to restore Level 3<br />
disturbances until we know that continuing use or other factors will not<br />
permit natural recovery. At stream crossing sites and areas where<br />
damage is increasing, a response may be necessary.<br />
In areas where it is not possible to relocate a trail, trail hardening or<br />
structures may be needed. It may be possible to use local native<br />
materials, such as logs, to make bridges, corduroy paths, or other<br />
structures. For extensively damaged areas, geotextile fabric overlain with<br />
gravel, Geoblock®, or other materials may need to be used. The cost of<br />
planning, construction, and materials could be substantial if a hardened<br />
trail is needed to cover long stretches of wetlands.<br />
Examples of mitigation include limiting use when the ground is not frozen,<br />
avoiding use in the wetter areas, or having users agreeing to end trails at<br />
designated sites in the back country and continue hunting on foot beyond<br />
that point.<br />
44 FIVE-YEAR MONITORING AND EVALUATION REPORT
STATUS OF FOREST PLAN MONITORING BY FISCAL YEAR<br />
Status of <strong>Forest</strong> Plan monitoring; frequency of data collection and evaluation.<br />
No = not monitored; OA = monitored by other agencies; P-Dev = protocol being developed; N/A = not<br />
applicable. Cells are highlighted in FY evaluation should occur.<br />
# <strong>Monitoring</strong> Question<br />
(How often data collected)<br />
1<br />
Are projects being<br />
implemented consistent with<br />
the <strong>Forest</strong> Plan direction?<br />
(5 years)<br />
2 Are management activities<br />
achieving their intended<br />
outcomes? (Annual)<br />
3 To what extent is ecosystem<br />
composition and structure<br />
changing and has forest<br />
management influenced<br />
these changes? How do<br />
these changes compare to<br />
the expected range?<br />
(Annual)<br />
4 What is the level of ground<br />
disturbing activity? (Annual)<br />
5 What is the existing water<br />
quantity? (As scheduled) In<br />
07, FLT decided this was<br />
research, not FP monitoring<br />
6 Are Best Management<br />
Practices (including wetland<br />
management) effective in<br />
meeting water quality<br />
standards? (As scheduled)<br />
7 What is the abundance and<br />
distribution of sensitive<br />
plants in areas affected by<br />
management activities?<br />
(Annual) As of 2007, done on<br />
a project- by-project basis,<br />
(TE&S surveys) no forestwide<br />
report or evaluation.<br />
How often<br />
evaluated<br />
Compliance with Revised <strong>Forest</strong> Plan<br />
Every 5<br />
yrs<br />
FY03 FY04 FY05 FY06 FY07<br />
N/A N/A N/A No<br />
P-Dev<br />
Integrated Effectiveness/Validation <strong>Monitoring</strong><br />
Every 5<br />
yrs<br />
Every 5<br />
years<br />
Every 5<br />
years<br />
No –<br />
P-Dev<br />
Yes –<br />
<strong>Report</strong><br />
Soil Resources<br />
Yes<br />
<strong>Report</strong><br />
Water Resources<br />
Every 5<br />
years<br />
Every 5<br />
years<br />
Yes<br />
<strong>Report</strong><br />
No –<br />
P-Dev<br />
Yes -<br />
<strong>Report</strong><br />
Sensitive and Exotic Plant Species<br />
Every 5<br />
years<br />
No<br />
P-Dev<br />
No<br />
P-Dev<br />
No No<br />
P-Dev<br />
No No No<br />
P-Dev<br />
No No No<br />
P-Dev<br />
No No No No<br />
P-Dev<br />
No No No No<br />
P-Dev<br />
No<br />
P-Dev<br />
No –<br />
Protocol<br />
on hold<br />
in 07<br />
No<br />
P-Dev<br />
No<br />
P-Dev<br />
No -<br />
question<br />
dropped<br />
No<br />
P-Dev<br />
No<br />
P-Dev<br />
FIVE-YEAR MONITORING AND EVALUATION REPORT 45
Status of <strong>Forest</strong> Plan monitoring; frequency of data collection and evaluation.<br />
No = not monitored; OA = monitored by other agencies; P-Dev = protocol being developed; N/A = not<br />
applicable. Cells are highlighted in FY evaluation should occur.<br />
# <strong>Monitoring</strong> Question<br />
(How often data collected)<br />
8 What is the distribution and<br />
abundance of exotic plants,<br />
particularly in areas affected<br />
by management activities?<br />
(Annual) As of 2007, done on<br />
a project- by-project basis,<br />
(TE&S surveys) no forest-wide<br />
report or evaluation.<br />
9 What are the population<br />
trends for Management<br />
Indicator Species (MIS) and<br />
their relationship to habitat?<br />
Are MIS truly reflective of all<br />
fish and wildlife species on<br />
the <strong>Forest</strong>? (not shown) *In<br />
FY06, FLT decided question is<br />
redundant with specific MIS<br />
monitoring questions.<br />
10 Has the Revised <strong>Forest</strong><br />
Plan direction prevented<br />
adverse interactions<br />
between bears and<br />
humans? (Annual)<br />
11 What are the population<br />
trends for brown bear and<br />
the relationship to habitat?<br />
(Every 3 rd year)<br />
12 What are the population<br />
trends for dusky Canada<br />
geese and the relationship<br />
to habitat change?<br />
(Every 3 rd year)<br />
13 What are the population<br />
trends for moose and the<br />
relationship to habitat?<br />
(Annual)<br />
14 What are the population<br />
trends for black<br />
oystercatchers and the<br />
relationship to habitat<br />
change?<br />
(3 yrs in each 5 yrs)<br />
How often<br />
evaluated<br />
<strong>Forest</strong> Plan<br />
= annual;<br />
new<br />
protocol =<br />
Every 5<br />
years<br />
Management Indicator Species<br />
FY03 FY04 FY05 FY06 FY07<br />
No No No No<br />
P-Dev<br />
not shown No No No No –<br />
Not<br />
funded<br />
Every 5<br />
years<br />
Every 3<br />
years<br />
Every 3<br />
years<br />
No<br />
P -<br />
Dev<br />
N/A No <strong>Report</strong> Status<br />
<strong>Report</strong><br />
No<br />
eval.<br />
Monito<br />
red by<br />
OA<br />
<strong>Report</strong> No No –<br />
OA, no<br />
FS<br />
funding<br />
Annual 2<br />
Survey<br />
<strong>Report</strong><br />
s<br />
Every 5<br />
years<br />
Yes -<br />
Survey<br />
&<br />
<strong>Report</strong><br />
Yes -<br />
<strong>Report</strong><br />
Yes -<br />
<strong>Report</strong><br />
No -<br />
OA<br />
Yes,<br />
report<br />
did not<br />
address<br />
<strong>Forest</strong><br />
Plan<br />
question<br />
46 FIVE-YEAR MONITORING AND EVALUATION REPORT<br />
No<br />
P-Dev<br />
No -<br />
question<br />
dropped<br />
No<br />
P-Dev<br />
No -OA<br />
Yes<br />
(OA + F)<br />
No - OA<br />
No<br />
P- Dev
Status of <strong>Forest</strong> Plan monitoring; frequency of data collection and evaluation.<br />
No = not monitored; OA = monitored by other agencies; P-Dev = protocol being developed; N/A = not<br />
applicable. Cells are highlighted in FY evaluation should occur.<br />
# <strong>Monitoring</strong> Question<br />
(How often data collected)<br />
15 What are the population<br />
trends for Dolly Varden<br />
char and the relationship to<br />
habitat? (Annual)<br />
16 What are the population<br />
trends for coho salmon and<br />
the relationship to habitat?<br />
(Annual)<br />
17 Is <strong>Forest</strong> management<br />
maintaining favorable<br />
conditions for sustaining<br />
gray wolves? (Annual)<br />
18 Is <strong>Forest</strong> management<br />
maintaining favorable<br />
conditions for sustaining<br />
Kenai wolverines?<br />
(Annual)<br />
19 Is <strong>Forest</strong> management<br />
maintaining favorable<br />
conditions for sustaining<br />
Townsend warblers?<br />
(Every 5 years)<br />
20 Is forest management<br />
maintaining favorable<br />
conditions for sustaining<br />
northern goshawks?<br />
(Annual)<br />
21 Is <strong>Forest</strong> management<br />
maintaining favorable<br />
conditions for sustaining<br />
Sitka black-tailed deer?<br />
(Annual)<br />
22 Is forest management<br />
maintaining favorable<br />
conditions for sustaining the<br />
Montague Island marmot?<br />
(Once) If marmots are found,<br />
adjustments will be made to<br />
the schedule.<br />
23 Is <strong>Forest</strong> management<br />
maintaining favorable<br />
conditions for sustaining<br />
cutthroat trout? (Annual)<br />
How often<br />
evaluated<br />
Every 5<br />
years<br />
Every 5<br />
years<br />
FY03 FY04 FY05 FY06 FY07<br />
Yes -<br />
<strong>Report</strong><br />
Yes -<br />
<strong>Report</strong><br />
No Yes<br />
<strong>Report</strong><br />
Species of Special Interest<br />
Every 5<br />
years<br />
Every 5<br />
years<br />
Every 5<br />
years<br />
Every 5<br />
years<br />
Every 5<br />
years<br />
Every 5<br />
years (if<br />
found to<br />
be<br />
present)<br />
Every 5<br />
years<br />
No<br />
P- Dev<br />
No No<br />
P- Dev<br />
No No No No -<br />
Not<br />
funded<br />
No No No No -<br />
Not<br />
funded<br />
n/a n/a n/s No -<br />
Not<br />
funded<br />
No No No No -<br />
Not<br />
funded<br />
No No No No-<br />
Not<br />
funded<br />
No No No No -<br />
Not<br />
funded<br />
2<br />
<strong>Report</strong>s<br />
<strong>Report</strong> No No -<br />
Not<br />
funded<br />
No<br />
P- Dev<br />
No<br />
P- Dev<br />
No - not<br />
funded<br />
No - not<br />
funded<br />
No - not<br />
funded<br />
No - not<br />
funded<br />
No – not<br />
funded<br />
No – not<br />
funded<br />
No - not<br />
funded<br />
FIVE-YEAR MONITORING AND EVALUATION REPORT 47
Status of <strong>Forest</strong> Plan monitoring; frequency of data collection and evaluation.<br />
No = not monitored; OA = monitored by other agencies; P-Dev = protocol being developed; N/A = not<br />
applicable. Cells are highlighted in FY evaluation should occur.<br />
# <strong>Monitoring</strong> Question<br />
(How often data collected)<br />
24 What are the population<br />
trends for trumpeter swans<br />
and the relationship to<br />
habitat change? (Annual)<br />
25 Are harvested forestlands<br />
restocked? (annual of<br />
selected areas)<br />
26 Have conditions changed<br />
that would affect the<br />
suitability of timber<br />
production lands?<br />
(every 10 years)<br />
27 Are mining plans of<br />
operations consistent with<br />
Revised <strong>Forest</strong> Plan<br />
direction? (once) In FY07<br />
determined to be an inventory<br />
to occur in FY08.<br />
28 Are National Register<br />
eligible heritage resources<br />
being adequately<br />
maintained and protected?<br />
(Annual)<br />
29 What is the status and<br />
condition of heritage<br />
resources on the <strong>Forest</strong>?<br />
(Annual)<br />
How often<br />
evaluated<br />
FY03 FY04 FY05 FY06 FY07<br />
Threatened, Endangered and Sensitive Animal Species<br />
Every 5<br />
years<br />
Yes -<br />
<strong>Report</strong><br />
<strong>Forest</strong> Products<br />
Every 5<br />
years<br />
Every 10<br />
years<br />
Every 5<br />
years<br />
Minerals<br />
Yes -<br />
<strong>Report</strong><br />
Yes -<br />
<strong>Report</strong><br />
Yes on<br />
Kenai<br />
No No No No<br />
P-Dev<br />
No No No No<br />
P-Dev<br />
No No No No<br />
P-Dev<br />
Annual<br />
Heritage<br />
No No No No<br />
P-Dev<br />
Annual No No No No<br />
P-Dev<br />
48 FIVE-YEAR MONITORING AND EVALUATION REPORT<br />
No – not<br />
funded<br />
Recreation Opportunities, Tourism, Access, and Facilities<br />
30 What are the characteristics Every 5 Yes - No <strong>Report</strong> No No<br />
of recreational visitors? years Survey<br />
What is their pattern of<br />
recreational use? What are<br />
their perceptions of<br />
opportunities and settings?<br />
(Once every 5 years)<br />
&<br />
<strong>Report</strong><br />
No<br />
Protocol<br />
approved<br />
No<br />
Protocol<br />
approved<br />
No –<br />
inventory<br />
so no<br />
protocol<br />
needed.<br />
No<br />
P-Dev<br />
No<br />
P-Dev
Status of <strong>Forest</strong> Plan monitoring; frequency of data collection and evaluation.<br />
No = not monitored; OA = monitored by other agencies; P-Dev = protocol being developed; N/A = not<br />
applicable. Cells are highlighted in FY evaluation should occur.<br />
# <strong>Monitoring</strong> Question<br />
(How often data collected)<br />
31 Is the Revised <strong>Forest</strong> Plan<br />
direction for motorized and<br />
nonmotorized access<br />
working? (Annual)<br />
32 Are areas of the <strong>Forest</strong><br />
being managed in<br />
accordance with the<br />
prescribed Recreation<br />
Opportunity Spectrum<br />
(ROS) class in <strong>Forest</strong>-wide<br />
standards and guidelines?<br />
(Annual)<br />
33 What is the use of<br />
developed recreational<br />
facilities and how does it<br />
compare to capacity?<br />
(Annual)<br />
34 What are the trends in<br />
commercial recreation<br />
services on the <strong>Forest</strong> and<br />
how does it compare to<br />
capacity? (Annual)<br />
35 Are areas of the <strong>Forest</strong><br />
being managed in<br />
accordance with the<br />
Scenery Integrity Objectives<br />
in <strong>Forest</strong>-wide standards<br />
and guidelines? (annual<br />
sample of selected areas)<br />
36 What is the pattern of<br />
abundance of different fuel<br />
types on the Kenai<br />
Peninsula?<br />
(<strong>Forest</strong> Plan = 5 yr; 2008<br />
Protocol = annual)<br />
How often<br />
evaluated<br />
Every 5<br />
years<br />
Every 5<br />
years<br />
FY03 FY04 FY05 FY06 FY07<br />
No No No No<br />
P-Dev<br />
No No No No –<br />
Not<br />
funded<br />
Annual No No No No<br />
P-Dev<br />
Annual No No No No<br />
P-Dev<br />
Every 5 th<br />
year<br />
Scenic Quality<br />
No No No No<br />
P-Dev<br />
Fire Protection and Fuels Management<br />
<strong>Forest</strong> Plan<br />
= Every 5 th<br />
yr; New<br />
protocol =<br />
depends on<br />
methodology<br />
N/A N/A N/A No<br />
P-<br />
Dev<br />
No<br />
Protocol<br />
needs<br />
FLT<br />
approval<br />
No – not<br />
funded<br />
No<br />
Protocol<br />
needs<br />
FLT<br />
approval<br />
No<br />
Protocol<br />
needs<br />
FLT<br />
approval<br />
No<br />
P-Dev<br />
No<br />
P-Dev<br />
FIVE-YEAR MONITORING AND EVALUATION REPORT 49
Status of <strong>Forest</strong> Plan monitoring; frequency of data collection and evaluation.<br />
No = not monitored; OA = monitored by other agencies; P-Dev = protocol being developed; N/A = not<br />
applicable. Cells are highlighted in FY evaluation should occur.<br />
# <strong>Monitoring</strong> Question<br />
(How often data collected)<br />
37 Is the wilderness character<br />
of the Wilderness Study<br />
Area (WSA) and areas<br />
recommended for<br />
Wilderness being<br />
maintained? (Annual<br />
sample for selected areas)<br />
38 Are proposed and<br />
established Research<br />
Natural Areas (RNA) being<br />
maintained in a state<br />
unmodified by human<br />
activity? (<strong>Forest</strong> Plan = 10 yr;<br />
2007 Protocol = annual)<br />
39 What are the trends in local<br />
economies? (annual)<br />
40 What are the effects of<br />
National <strong>Forest</strong><br />
management on lands,<br />
resources and communities<br />
adjacent to the <strong>Forest</strong>?<br />
(Once every 5 years)<br />
41 What are the population<br />
trends for mountain goat<br />
and the relationship to<br />
habitat change?(Annual)<br />
42 Air Quality - Are <strong>Forest</strong><br />
management actions<br />
contributing to changes in<br />
air quality on the <strong>Forest</strong>?<br />
(once every 3-5 years)<br />
How often<br />
evaluated<br />
Every 5 th<br />
year<br />
Wilderness<br />
Research Natural Areas<br />
<strong>Forest</strong> Plan<br />
= Every 10 th<br />
yr; New =<br />
depends on<br />
methodology<br />
Community Effects<br />
Every 3<br />
years<br />
Every 5<br />
years<br />
FY03 FY04 FY05 FY06 FY07<br />
No No No No<br />
P-<br />
Dev<br />
N/A N/A N/A No<br />
P-<br />
Dev<br />
No NO No No –<br />
not<br />
funde<br />
d<br />
Added Questions (Record of Decision)<br />
Every 3<br />
years<br />
50 FIVE-YEAR MONITORING AND EVALUATION REPORT<br />
No<br />
P-Dev<br />
No,<br />
protocol<br />
complete<br />
No – not<br />
funded<br />
N/A N/A N/A N/A No – not<br />
funded<br />
Yes -<br />
CRD<br />
Yes -<br />
CRD<br />
Added Questions (Appeal Decision)<br />
Once<br />
every 3-5<br />
years<br />
Yes -<br />
CRD<br />
Yes<br />
–<br />
CRD<br />
P -<br />
Dev<br />
No No No No<br />
P- Dev<br />
No<br />
P-Dev<br />
Yes<br />
P-Dev
Status of <strong>Forest</strong> Plan monitoring; frequency of data collection and evaluation.<br />
No = not monitored; OA = monitored by other agencies; P-Dev = protocol being developed; N/A = not<br />
applicable. Cells are highlighted in FY evaluation should occur.<br />
# <strong>Monitoring</strong> Question<br />
(How often data collected)<br />
43 OHV Impacts - What is the<br />
effect of summer OHV use<br />
on soils and/or vegetation<br />
where OHV use is allowed?<br />
(not defined)<br />
Recommendation -include<br />
as part of level of ground<br />
disturbing question.<br />
How often<br />
evaluated<br />
Not<br />
Defined<br />
FY03 FY04 FY05 FY06 FY07<br />
No No No Yes –<br />
on<br />
CRD<br />
Yes – on<br />
CRD<br />
P-Dev as<br />
part of #4<br />
FIVE-YEAR MONITORING AND EVALUATION REPORT 51
LITERATURE CITED<br />
Arhangelsky, K. 2007. Non-native plant species inventory of southcentral Alaska:<br />
Chugach National <strong>Forest</strong>. Summary of 2007 survey findings. Final <strong>Report</strong> to<br />
<strong>USDA</strong> <strong>Forest</strong> <strong>Service</strong>, State and Private <strong>Forest</strong>y. Turnstone Environmental<br />
Consultants, Inc., Portland, Oregon. 42 p.<br />
Boggs, K. 2000. Classification of community types, seral sequences, and<br />
landscapes of the Copper River Delta. General Technical <strong>Report</strong> PNW-GTR-469.<br />
<strong>USDA</strong> <strong>Forest</strong> <strong>Service</strong>, PNW Research Station. Portland, OR. 244 p.<br />
Bromley, R.B.H. 1984. The energetics of migration and reproduction of dusky<br />
Canada geese (Branta canadensis occidentalis). PhD. Thesis, Oregon State<br />
University, Corvallis, OR. 116 p.<br />
Butler, W. I., and W. D. Eldridge. 1991. Development of an aerial breeding pair<br />
survey for dusky Canada geese (Branta canadensis occidentalis), on the Copper<br />
River Delta, Alaska. Unpublished <strong>Report</strong>. USFWS, Anchorage, AK. 30 p.<br />
Campbell, B.H. 1990. Factors affecting the nesting success of dusky Canada<br />
geese, (Branta canadensis occidentalis), on the Copper River Delta, Alaska.<br />
Canadian Field-Naturalist 104(4):567-574.<br />
_____, Rosenberg, D.H., and T. Rothe. 1992. Waterfowl program annual report.<br />
Unpubl. Rep., Alaska Dept. Fish and Game. Anchorage, AK. 42 p.<br />
_____, and D.E. Timm. 1983. Annual report of survey-inventory activities. Part V.<br />
Waterfowl. Vol. XIII. Alaska Dept. of Fish and Game. Federal Aid to Wildlife<br />
Restoration Progress <strong>Report</strong>, Project W-22-1, Job 11.0, Juneau, AK. 45 p.<br />
Cole, D.N. 1989. Wilderness campsite monitoring methods: a sourcebook.<br />
<strong>USDA</strong> <strong>Forest</strong> <strong>Service</strong>, Intermountain <strong>Forest</strong> and Range Exp. Sta. Gen. Tech.<br />
Rep. INT-259. Ogden, Utah. 57 p.<br />
Conant, B., and C.P. Dau. 1990. Dusky Canada goose breeding population survey.<br />
Unpubl. Rep. USFWS, Juneau, Alaska. 4p.<br />
Crow, J.H. 1968. Plant ecology of the Copper River Delta, Alaska. Ph.D.<br />
dissertation, Washington State University, Pullman, WA. 120 p.<br />
DeVelice, R.L., C.J. Hubbard, K. Boggs, S. Boudreau, M. Potkin, T. Boucher, and<br />
C. Wertheim. 1999. Plant community types of the Chugach National <strong>Forest</strong>:<br />
southcentral Alaska. <strong>USDA</strong> <strong>Forest</strong> <strong>Service</strong>, Chugach NF, Alaska Region Tech.<br />
Pub. R10-TP-76. Anchorage, AK.<br />
52 FIVE-YEAR MONITORING AND EVALUATION REPORT
DeVelice, R.L. 2003. Non-native plant inventory: Kenai trails. <strong>USDA</strong> <strong>Forest</strong><br />
<strong>Service</strong>, Chugach NF, Alaska Reg. Tech. Pub. R10-TP-124. Anchorage, AK.<br />
Duffy, M. 2003. Non-native plants of Chugach National <strong>Forest</strong>: a preliminary<br />
inventory. <strong>USDA</strong> <strong>Forest</strong> <strong>Service</strong>, Chugach NF, Alaska Reg. Tech. Pub. R10-TP-<br />
111. Anchorage, AK.<br />
Eldridge, W. D., and B. Platte. 1995. <strong>Report</strong> to Pacific Flyway Study Committee<br />
on 1986-1995 breeding ground surveys of dusky Canada geese on the Copper<br />
River Delta. Unpublished <strong>Report</strong> USFWS. Anchorage, AK. 4 p.<br />
Elzinga, C.L., D.W. Salzer, and J.W. Willoughby. 1998. Measuring and<br />
monitoring plant populations. Bureau of Land Mgmt Tech. Ref. 1730-1. Denver,<br />
CO. 477 p.<br />
Fode, J. and P. Meyers. 2007. Dusky Canada goose nest density on the Copper<br />
River Delta. 2007 Final <strong>Report</strong>. Unpub. internal doc. Chugach NF. Cordova RD.<br />
10 p.<br />
Hodges, K. (editor). 2006. Off highway vehicle use and its effects on portions of<br />
Hawkins and Hinchinbrook Islands, 2006 Survey <strong>Report</strong>. Unpub. internal rep.<br />
<strong>USDA</strong> FS, Chugach NF, Cordova RD. 19 p.<br />
Kempka, R.G., B.S. Maurizi, F.A. Reid, D.W. Logan, and D.E. Youkey. 1994.<br />
Utilizing SPOT multispectral imagery to assess wetland vegetation succession in<br />
the Copper River Delta, Alaska. Second Thematic Conference on Remote<br />
Sensing for Marine and Coastal Environments, New Orleans, Louisiana. 12 p.<br />
MacFarlane, W. 2007. Winter 2007 air quality monitoring report; Turnagain Pass,<br />
Alaska, Chugach NF. Unpub. internal rep. Chugach NF. 40 p.<br />
Meade, S. 2007. Off highway vehicle use monitoring on portions of Hawkins and<br />
Hinchinbrook Islands. 2007 <strong>Report</strong>. Unpublished internal report. Chugach NF.<br />
Cordova RD. 16 p.<br />
Monz, C.A. 1998. <strong>Monitoring</strong> recreation resource impacts in two coastal areas of<br />
western North America: an initial assessment. Pages 117-122 in Personal,<br />
societal, and ecological values of wilderness: Sixth World Wilderness Congress<br />
proceedings, on research, management, and allocation, volume I (A.E. Watson,<br />
G.H. Aplet, and J.C. Hendee, Comps.). <strong>USDA</strong> FS Proceedings RMRS-P-4,<br />
Ogden, Utah.<br />
Nelson, U.C. 1952. Copper River Delta banding operations---July 15-25, 1952.<br />
Pages 10-12 in U.C. Nelson, Federal Aid Leader. Alaska Game Commission<br />
Quarterly <strong>Report</strong>. USFWS. Federal Aid to Wildlife Restoration Program <strong>Report</strong><br />
Project 7(1), Juneau, AK.<br />
FIVE-YEAR MONITORING AND EVALUATION REPORT 53
Olsen, S.T. 1954. Copper River Delta banding operations. Pages 34-42 in U.C.<br />
Nelson, Federal Aid Leader. AK Game Commission Quarterly <strong>Report</strong>. USFWS.<br />
Federal Aid to Wildlife Restoration Program <strong>Report</strong> Project 7(1), Juneau, AK.<br />
Potyondy, J.P., M.P. Meyer, and A.C. Mase, Jr. 1975. Hydrologic response of the<br />
Copper River Delta-Controller Bay area, Alaska, to land emergence and uplift.<br />
University of Minnesota, St. Paul. 84 p.<br />
Sheperd, P.E.K. 1965. A preliminary evaluation of earthquake damage to<br />
waterfowl habitat in south central Alaska. 45 th Annual conference of the Western<br />
Association of State Game and Fish Commissioners. 9 p.<br />
Thelenius, J.F. 1995. Phytosociology and succession on earthquake-uplifted<br />
coastal wetlands, Copper River Delta, Alaska. Gen. Tech. Rep. PNW-GTR-346.<br />
Portland, OR. <strong>USDA</strong> FS, Pacific Northwest Res. Sta. 58 p.<br />
Weller, M.W. 1956. A simple field candler for waterfowl eggs. J. Wildl. Manage.<br />
20:111-113.<br />
54 FIVE-YEAR MONITORING AND EVALUATION REPORT
APPENDIX<br />
The top 30 monitoring questions in descending order of the sum of management<br />
potential, risks, and uncertainty criteria scores from the MEIT model. The total<br />
score and the weighted average values for each of the criteria are also shown.<br />
<strong>Monitoring</strong> Question<br />
Overall Score (0-1 range)<br />
Management Potential + Risks +<br />
Uncertainty (0-0.40 range)<br />
6. Required by Law<br />
100%<br />
Model Criteria and Weights<br />
75% 50%<br />
33_heritage_survey 0.72 0.37 0.16 0.16 0.16 0.12 0.03 0.09 0.00 0.00<br />
32_heritage_condition 0.76 0.33 0.16 0.16 0.12 0.12 0.03 0.09 0.04 0.04<br />
42_wsa 0.71 0.31 0.16 0.16 0.16 0.09 0.00 0.06 0.04 0.04<br />
1_plan_consistency 0.66 0.31 0.16 0.16 0.16 0.09 0.03 0.06 0.00 0.00<br />
39_commercial_rec 0.54 0.31 0.00 0.16 0.16 0.06 0.03 0.09 0.00 0.04<br />
10_dlp 0.76 0.30 0.16 0.16 0.12 0.12 0.06 0.06 0.04 0.04<br />
13_dusky_geese 0.76 0.30 0.16 0.16 0.12 0.12 0.06 0.06 0.04 0.04<br />
40_sio 0.68 0.28 0.16 0.16 0.16 0.09 0.00 0.03 0.00 0.08<br />
36_motorized_nonmotorized 0.77 0.27 0.16 0.16 0.12 0.12 0.06 0.03 0.08 0.04<br />
2_intended_outcomes 0.66 0.27 0.16 0.16 0.12 0.09 0.03 0.06 0.04 0.00<br />
35_public_demand 0.54 0.27 0.00 0.16 0.12 0.09 0.03 0.06 0.00 0.08<br />
38_developed_rec 0.60 0.27 0.00 0.16 0.12 0.06 0.09 0.09 0.00 0.08<br />
41_fire_hazard 0.80 0.26 0.16 0.16 0.08 0.12 0.06 0.06 0.08 0.08<br />
12_brown_bear 0.72 0.26 0.16 0.16 0.08 0.12 0.06 0.06 0.04 0.04<br />
3_ecosystem_change 0.76 0.26 0.16 0.16 0.08 0.09 0.06 0.09 0.04 0.08<br />
43_rna 0.61 0.25 0.16 0.16 0.16 0.03 0.00 0.06 0.00 0.04<br />
14_moose 0.70 0.24 0.16 0.16 0.12 0.09 0.06 0.03 0.04 0.04<br />
46_air 0.58 0.22 0.16 0.16 0.16 0.06 0.00 0.00 0.00 0.04<br />
15_mountain_goat 0.64 0.21 0.16 0.16 0.12 0.06 0.03 0.03 0.04 0.04<br />
18_dolly_varden_char 0.64 0.21 0.16 0.16 0.12 0.06 0.03 0.03 0.04 0.04<br />
4_soil 0.64 0.21 0.16 0.16 0.12 0.06 0.03 0.03 0.04 0.04<br />
FIVE-YEAR MONITORING AND EVALUATION REPORT 55<br />
1. Evaluates LRMP<br />
2. Management Potential<br />
3. Risks<br />
4. Desired Conditions<br />
5. Uncertainty<br />
8. National Sustainability Priority<br />
9. Regional Emphasis Area
<strong>Monitoring</strong> Question<br />
Overall Score (0-1 range)<br />
Management Potential + Risks +<br />
Uncertainty (0-0.40 range)<br />
6. Required by Law<br />
Model Criteria and Weights<br />
100% 75% 50%<br />
17_black_oystercatcher 0.69 0.20 0.16 0.16 0.08 0.06 0.09 0.06 0.04 0.04<br />
19_coho_salmon 0.63 0.20 0.16 0.16 0.08 0.09 0.03 0.03 0.04 0.04<br />
31_minerals 0.58 0.19 0.16 0.16 0.16 0.03 0.03 0.00 0.04 0.00<br />
29_timber_suitability 0.51 0.19 0.16 0.16 0.16 0.03 0.00 0.00 0.00 0.00<br />
6_bmp 0.61 0.18 0.16 0.16 0.12 0.03 0.03 0.03 0.04 0.04<br />
8_invasive_plants 0.68 0.17 0.16 0.16 0.08 0.06 0.03 0.03 0.08 0.08<br />
7_sensitive_plants 0.52 0.17 0.08 0.16 0.08 0.03 0.03 0.06 0.04 0.04<br />
28_restocking 0.57 0.15 0.16 0.16 0.12 0.03 0.06 0.00 0.00 0.04<br />
5_water 0.51 0.11 0.16 0.16 0.08 0.03 0.00 0.00 0.00 0.08<br />
56 FIVE-YEAR MONITORING AND EVALUATION REPORT<br />
1. Evaluates LRMP<br />
2. Management Potential<br />
3. Risks<br />
4. Desired Conditions<br />
5. Uncertainty<br />
8. National Sustainability Priority<br />
9. Regional Emphasis Area