Effect of processing stages of apple juice ... - ResearchGate
Effect of processing stages of apple juice ... - ResearchGate
Effect of processing stages of apple juice ... - ResearchGate

Create successful ePaper yourself
Turn your PDF publications into a flip-book with our unique Google optimized e-Paper software.
intended for infants and young children is 10 lg/kg (The<br />
Commission <strong>of</strong> the European Communities, 2006).<br />
Apple <strong>juice</strong>s are the most important source <strong>of</strong> patulin in<br />
human diet (WHO, 1995). The <strong>juice</strong> production requires<br />
the use <strong>of</strong> ripened fruit, which is normally stored at low<br />
temperature prior to <strong>processing</strong>. Even at temperatures<br />
below 5 °C some species <strong>of</strong> Penicillium are able to grow<br />
and produce patulin (Northold & Bullerman, 1982). The<br />
contamination <strong>of</strong> <strong>apple</strong>s with patulin is normally associated<br />
with spoiled tissue areas and although removing rotten<br />
tissue from the fruit can reduce patulin levels,<br />
penetration nevertheless occurs up to approximately 1 cm<br />
into the surrounding healthy tissue (Taniwaki, Hoenderboom,<br />
Vitali, & Eiroa, 1992).<br />
Processing can play an important role in reducing the<br />
potential risks <strong>of</strong> mycotoxin-contaminated food commodities.<br />
Thus, it is important to evaluate the effects <strong>of</strong> <strong>processing</strong><br />
on patulin to determine if the toxin level can be<br />
managed through postharvest procedures. Information<br />
on patulin persistence and transformation during <strong>processing</strong><br />
would be useful for the development <strong>of</strong> an effective<br />
food safety program.<br />
The objective <strong>of</strong> this study was to determine the effect<br />
that some <strong>stages</strong> <strong>of</strong> <strong>apple</strong> <strong>juice</strong> concentrate <strong>processing</strong><br />
(milling, pasteurization, treatment enzymatic, micr<strong>of</strong>iltration<br />
and evaporation) have on patulin levels.<br />
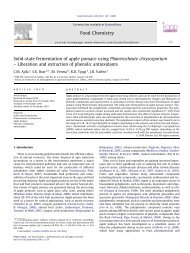
Apple<br />
Washing<br />
Milling<br />
Pressing<br />
Pasteurization<br />
Enzimatic Treatment<br />
Micr<strong>of</strong>iltration<br />
Evaporation<br />
Apple <strong>juice</strong><br />
concentrate<br />
Fig. 1. Flow chart <strong>of</strong> <strong>apple</strong> <strong>juice</strong> concentrate production.<br />
J.E. Welke et al. / Food Control 20 (2009) 48–52 49<br />
2. Materials and methods<br />
2.1. Samples<br />
Sixteen lots <strong>of</strong> <strong>apple</strong> <strong>juice</strong> production were analyzed.<br />
Samples were taken, in duplicate, from five <strong>stages</strong> <strong>of</strong> the<br />
<strong>apple</strong> <strong>juice</strong> production (Fig. 1) processed by an industry<br />
located in Rio Grande do Sul state, Brazil. Samples were<br />
collected after milling, pasteurization, enzymatic treatment,<br />
micr<strong>of</strong>iltration and evaporation.<br />
2.2. Sample preparation<br />
2.2.1. Patulin extraction<br />
A modified version <strong>of</strong> the method used by MacDonald<br />
et al. (2000) was used. Ten grams <strong>of</strong> <strong>apple</strong> or <strong>apple</strong> <strong>juice</strong><br />
were extracted with 20 mL <strong>of</strong> ethyl acetate by mixing vigorously<br />
for 1 min using a vortex mixer. The extraction was<br />
repeated twice using 20 mL portions <strong>of</strong> ethyl acetate.<br />
2.2.2. Sample clean-up<br />
The organic phases were combined and extracted with<br />
10 mL <strong>of</strong> sodium carbonate solution (1.5%, w/v) to remove<br />
phenolic acids. The phases were allowed to separate and<br />
the aqueous phase was extracted with 10 mL <strong>of</strong> ethyl acetate,<br />
which was combined with the preceding portion.<br />
Extracted samples were dried with anhydrous sodium sulfate<br />
and transferred to a silica gel column prepared in a<br />
glass tube filled with 8 g <strong>of</strong> silica gel (60, 70–230 mesh,<br />
Merck). The toxin was eluted from the column with<br />
10 mL <strong>of</strong> ethyl acetate. After solvent evaporation, the<br />
extract was redissolved in known volume <strong>of</strong> chlor<strong>of</strong>orm.<br />
All samples were analyzed in duplicate.<br />
2.2.3. Chromatography<br />
Ten, twenty and thirty microliter aliquots <strong>of</strong> sample<br />
extract and patulin standard solution (10 lg/mL) were spotted<br />
1 cm apart on TLC plates (SIL G-25HR, Machery-Nagel<br />
and Co., Code No. 809033, Germany). The spots were dried,<br />
and the plates developed in solvent system toluene:ethyl acetate:formic<br />
acid (5:4:1 v/v/v) (Labuda & Tancinová, 2006).<br />
For identification <strong>of</strong> patulin, the plates were sprayed<br />
with 0.5% aqueous methyl-benzothiazolinone hydrazone<br />
hydrochloride monohydrate (MBTH) (No. 65875, Fluka,<br />
USA) and heated at 130 °C for 15 min. Patulin appeared<br />
as a yellow spot under visible light for reflection and transparency<br />
simultaneously and as a yellow–orange fluorescence<br />
spot under long wavelength UV light (366 nm). The<br />
TLC plate was sprayed with water-90% formic acid (98:2<br />
v/v) until the layer appeared wet and then observed under<br />
366 nm UV light, which improved the visualization <strong>of</strong> the<br />
yellow–orange fluorescence spots against the background<br />
(Martins, Gimeno, Martins, & Bernardo, 2002).<br />
2.2.4. CCD imaging system<br />
The quantification <strong>of</strong> the fluorescence intensities from<br />
UV lamp were recorded by a CCD camera. Images were