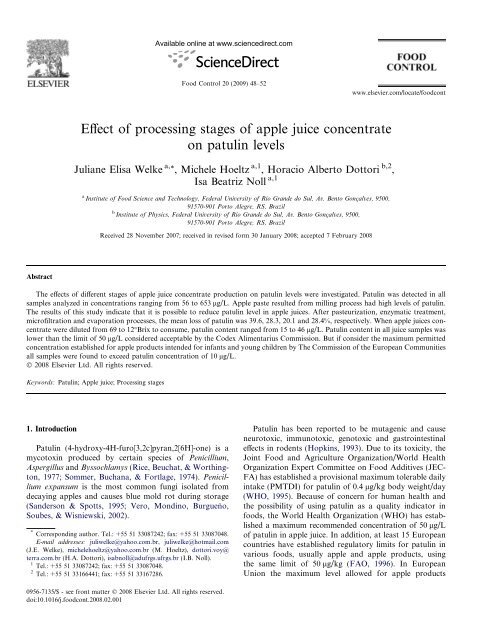
Effect of processing stages of apple juice ... - ResearchGate
Effect of processing stages of apple juice ... - ResearchGate
Effect of processing stages of apple juice ... - ResearchGate

Create successful ePaper yourself
Turn your PDF publications into a flip-book with our unique Google optimized e-Paper software.
Abstract<br />
<strong>Effect</strong> <strong>of</strong> <strong>processing</strong> <strong>stages</strong> <strong>of</strong> <strong>apple</strong> <strong>juice</strong> concentrate<br />
on patulin levels<br />
Juliane Elisa Welke a, *, Michele Hoeltz a,1 , Horacio Alberto Dottori b,2 ,<br />
Isa Beatriz Noll a,1<br />
a Institute <strong>of</strong> Food Science and Technology, Federal University <strong>of</strong> Rio Grande do Sul, Av. Bento Goncßalves, 9500,<br />
91570-901 Porto Alegre, RS, Brazil<br />
b Institute <strong>of</strong> Physics, Federal University <strong>of</strong> Rio Grande do Sul, Av. Bento Goncßalves, 9500,<br />
91570-901 Porto Alegre, RS, Brazil<br />
Received 28 November 2007; received in revised form 30 January 2008; accepted 7 February 2008<br />
The effects <strong>of</strong> different <strong>stages</strong> <strong>of</strong> <strong>apple</strong> <strong>juice</strong> concentrate production on patulin levels were investigated. Patulin was detected in all<br />
samples analyzed in concentrations ranging from 56 to 653 lg/L. Apple paste resulted from milling process had high levels <strong>of</strong> patulin.<br />
The results <strong>of</strong> this study indicate that it is possible to reduce patulin level in <strong>apple</strong> <strong>juice</strong>s. After pasteurization, enzymatic treatment,<br />
micr<strong>of</strong>iltration and evaporation processes, the mean loss <strong>of</strong> patulin was 39.6, 28.3, 20.1 and 28.4%, respectively. When <strong>apple</strong> <strong>juice</strong>s concentrate<br />
were diluted from 69 to 12°Brix to consume, patulin content ranged from 15 to 46 lg/L. Patulin content in all <strong>juice</strong> samples was<br />
lower than the limit <strong>of</strong> 50 lg/L considered acceptable by the Codex Alimentarius Commission. But if consider the maximum permitted<br />
concentration established for <strong>apple</strong> products intended for infants and young children by The Commission <strong>of</strong> the European Communities<br />
all samples were found to exceed patulin concentration <strong>of</strong> 10 lg/L.<br />
Ó 2008 Elsevier Ltd. All rights reserved.<br />
Keywords: Patulin; Apple <strong>juice</strong>; Processing <strong>stages</strong><br />
1. Introduction<br />
Available online at www.sciencedirect.com<br />
Food Control 20 (2009) 48–52<br />
Patulin (4-hydroxy-4H-furo[3,2c]pyran,2[6H]-one) is a<br />
mycotoxin produced by certain species <strong>of</strong> Penicillium,<br />
Aspergillus and Byssochlamys (Rice, Beuchat, & Worthington,<br />
1977; Sommer, Buchana, & Fortlage, 1974). Penicillium<br />
expansum is the most common fungi isolated from<br />
decaying <strong>apple</strong>s and causes blue mold rot during storage<br />
(Sanderson & Spotts, 1995; Vero, Mondino, Burgueño,<br />
Soubes, & Wisniewski, 2002).<br />
* Corresponding author. Tel.: +55 51 33087242; fax: +55 51 33087048.<br />
E-mail addresses: juliwelke@yahoo.com.br, juliwelke@hotmail.com<br />
(J.E. Welke), michelehoeltz@yahoo.com.br (M. Hoeltz), dottori.voy@<br />
terra.com.br (H.A. Dottori), isabnoll@adufrgs.ufrgs.br (I.B. Noll).<br />
1 Tel.: +55 51 33087242; fax: +55 51 33087048.<br />
2 Tel.: +55 51 33166441; fax: +55 51 33167286.<br />
0956-7135/$ - see front matter Ó 2008 Elsevier Ltd. All rights reserved.<br />
doi:10.1016/j.foodcont.2008.02.001<br />
www.elsevier.com/locate/foodcont<br />
Patulin has been reported to be mutagenic and cause<br />
neurotoxic, immunotoxic, genotoxic and gastrointestinal<br />
effects in rodents (Hopkins, 1993). Due to its toxicity, the<br />
Joint Food and Agriculture Organization/World Health<br />
Organization Expert Committee on Food Additives (JEC-<br />
FA) has established a provisional maximum tolerable daily<br />
intake (PMTDI) for patulin <strong>of</strong> 0.4 lg/kg body weight/day<br />
(WHO, 1995). Because <strong>of</strong> concern for human health and<br />
the possibility <strong>of</strong> using patulin as a quality indicator in<br />
foods, the World Health Organization (WHO) has established<br />
a maximum recommended concentration <strong>of</strong> 50 lg/L<br />
<strong>of</strong> patulin in <strong>apple</strong> <strong>juice</strong>. In addition, at least 15 European<br />
countries have established regulatory limits for patulin in<br />
various foods, usually <strong>apple</strong> and <strong>apple</strong> products, using<br />
the same limit <strong>of</strong> 50 lg/kg (FAO, 1996). In European<br />
Union the maximum level allowed for <strong>apple</strong> products
intended for infants and young children is 10 lg/kg (The<br />
Commission <strong>of</strong> the European Communities, 2006).<br />
Apple <strong>juice</strong>s are the most important source <strong>of</strong> patulin in<br />
human diet (WHO, 1995). The <strong>juice</strong> production requires<br />
the use <strong>of</strong> ripened fruit, which is normally stored at low<br />
temperature prior to <strong>processing</strong>. Even at temperatures<br />
below 5 °C some species <strong>of</strong> Penicillium are able to grow<br />
and produce patulin (Northold & Bullerman, 1982). The<br />
contamination <strong>of</strong> <strong>apple</strong>s with patulin is normally associated<br />
with spoiled tissue areas and although removing rotten<br />
tissue from the fruit can reduce patulin levels,<br />
penetration nevertheless occurs up to approximately 1 cm<br />
into the surrounding healthy tissue (Taniwaki, Hoenderboom,<br />
Vitali, & Eiroa, 1992).<br />
Processing can play an important role in reducing the<br />
potential risks <strong>of</strong> mycotoxin-contaminated food commodities.<br />
Thus, it is important to evaluate the effects <strong>of</strong> <strong>processing</strong><br />
on patulin to determine if the toxin level can be<br />
managed through postharvest procedures. Information<br />
on patulin persistence and transformation during <strong>processing</strong><br />
would be useful for the development <strong>of</strong> an effective<br />
food safety program.<br />
The objective <strong>of</strong> this study was to determine the effect<br />
that some <strong>stages</strong> <strong>of</strong> <strong>apple</strong> <strong>juice</strong> concentrate <strong>processing</strong><br />
(milling, pasteurization, treatment enzymatic, micr<strong>of</strong>iltration<br />
and evaporation) have on patulin levels.<br />
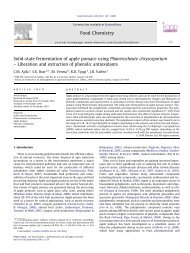
Apple<br />
Washing<br />
Milling<br />
Pressing<br />
Pasteurization<br />
Enzimatic Treatment<br />
Micr<strong>of</strong>iltration<br />
Evaporation<br />
Apple <strong>juice</strong><br />
concentrate<br />
Fig. 1. Flow chart <strong>of</strong> <strong>apple</strong> <strong>juice</strong> concentrate production.<br />
J.E. Welke et al. / Food Control 20 (2009) 48–52 49<br />
2. Materials and methods<br />
2.1. Samples<br />
Sixteen lots <strong>of</strong> <strong>apple</strong> <strong>juice</strong> production were analyzed.<br />
Samples were taken, in duplicate, from five <strong>stages</strong> <strong>of</strong> the<br />
<strong>apple</strong> <strong>juice</strong> production (Fig. 1) processed by an industry<br />
located in Rio Grande do Sul state, Brazil. Samples were<br />
collected after milling, pasteurization, enzymatic treatment,<br />
micr<strong>of</strong>iltration and evaporation.<br />
2.2. Sample preparation<br />
2.2.1. Patulin extraction<br />
A modified version <strong>of</strong> the method used by MacDonald<br />
et al. (2000) was used. Ten grams <strong>of</strong> <strong>apple</strong> or <strong>apple</strong> <strong>juice</strong><br />
were extracted with 20 mL <strong>of</strong> ethyl acetate by mixing vigorously<br />
for 1 min using a vortex mixer. The extraction was<br />
repeated twice using 20 mL portions <strong>of</strong> ethyl acetate.<br />
2.2.2. Sample clean-up<br />
The organic phases were combined and extracted with<br />
10 mL <strong>of</strong> sodium carbonate solution (1.5%, w/v) to remove<br />
phenolic acids. The phases were allowed to separate and<br />
the aqueous phase was extracted with 10 mL <strong>of</strong> ethyl acetate,<br />
which was combined with the preceding portion.<br />
Extracted samples were dried with anhydrous sodium sulfate<br />
and transferred to a silica gel column prepared in a<br />
glass tube filled with 8 g <strong>of</strong> silica gel (60, 70–230 mesh,<br />
Merck). The toxin was eluted from the column with<br />
10 mL <strong>of</strong> ethyl acetate. After solvent evaporation, the<br />
extract was redissolved in known volume <strong>of</strong> chlor<strong>of</strong>orm.<br />
All samples were analyzed in duplicate.<br />
2.2.3. Chromatography<br />
Ten, twenty and thirty microliter aliquots <strong>of</strong> sample<br />
extract and patulin standard solution (10 lg/mL) were spotted<br />
1 cm apart on TLC plates (SIL G-25HR, Machery-Nagel<br />
and Co., Code No. 809033, Germany). The spots were dried,<br />
and the plates developed in solvent system toluene:ethyl acetate:formic<br />
acid (5:4:1 v/v/v) (Labuda & Tancinová, 2006).<br />
For identification <strong>of</strong> patulin, the plates were sprayed<br />
with 0.5% aqueous methyl-benzothiazolinone hydrazone<br />
hydrochloride monohydrate (MBTH) (No. 65875, Fluka,<br />
USA) and heated at 130 °C for 15 min. Patulin appeared<br />
as a yellow spot under visible light for reflection and transparency<br />
simultaneously and as a yellow–orange fluorescence<br />
spot under long wavelength UV light (366 nm). The<br />
TLC plate was sprayed with water-90% formic acid (98:2<br />
v/v) until the layer appeared wet and then observed under<br />
366 nm UV light, which improved the visualization <strong>of</strong> the<br />
yellow–orange fluorescence spots against the background<br />
(Martins, Gimeno, Martins, & Bernardo, 2002).<br />
2.2.4. CCD imaging system<br />
The quantification <strong>of</strong> the fluorescence intensities from<br />
UV lamp were recorded by a CCD camera. Images were
50 J.E. Welke et al. / Food Control 20 (2009) 48–52<br />
taken in each experiment and were analyzed using<br />
IMSTAT s<strong>of</strong>tware (image statistics) <strong>of</strong> image reduction<br />
astronomical facility (IRAF) package.<br />
2.2.5. Patulin standard solution<br />
A stock standard solution <strong>of</strong> patulin was prepared by<br />
dissolving 5 mg <strong>of</strong> pure crystalline patulin (Sigma,<br />
P-2639) in chlor<strong>of</strong>orm at concentration <strong>of</strong> 100 lg/mL.<br />
The standard solution was kept frozen ( 18 °C). The concentration<br />
<strong>of</strong> the patulin stock solution was determined by<br />
measuring the UV absorbance at 275 nm and calculated by<br />
using the molar extinction coefficient e <strong>of</strong> 14,600. The concentration<br />
<strong>of</strong> working standard solution in chlor<strong>of</strong>orm was<br />
10 lg/mL (AOAC, 2000).<br />
2.2.6. Statistical analysis<br />
Box plot and ANOVA were applied to test the effect <strong>of</strong><br />
each stage <strong>of</strong> <strong>apple</strong> <strong>juice</strong> production on patulin levels.<br />
SPSS, version 11.5 (SPSS, Chicago, IL, USA) for Windows<br />
was used for the statistical analysis <strong>of</strong> data.<br />
3. Results and discussion<br />
The method used for patulin determination was efficient.<br />
5-hydroxymethylfurfural (HMF) is formed during heat<br />
treatment and storage <strong>of</strong> carbohydrates-rich products such<br />
as <strong>apple</strong> <strong>juice</strong>s (Kadakal, Sebahattin, & Poyrazoglu, 2002).<br />
HMF is observed as the main interference in patulin determination.<br />
The separation <strong>of</strong> these two compounds is<br />
required to reliable patulin quantification. A clean-up step<br />
using a silica gel column removed the interference. Patulin<br />
and HMF appeared as two different spots which were distinguished<br />
when compared with standards on TLC plate.<br />
The recovery <strong>of</strong> the method was determined by analyzing<br />
<strong>of</strong> 3 <strong>apple</strong> pastes (from milling stage) and 3 <strong>apple</strong> <strong>juice</strong>s<br />
concentrate (last stage). Recovery rates <strong>of</strong> patulin obtained<br />
by spiking the <strong>apple</strong> paste with 200, 300 and 400 lg/kg in<br />
duplicate were 91, 92 and 88%, respectively and the relative<br />
standard deviation (RSD) for repeatability was 4.3, 6.2 and<br />
4.2, respectively. The recovery <strong>of</strong> patulin in <strong>apple</strong> <strong>juice</strong> concentrate<br />
spiked at 50, 100 and 200 lg/L was 93, 96 and<br />
96%, respectively; the RSD for repeatability was 4.9, 3.6<br />
and 8.7, respectively for these concentrations. The limit<br />
<strong>of</strong> detection (LOD) was 0.005 lg/spot and the limit <strong>of</strong><br />
quantification (LOQ) was 14 lg/L. Linearity was determined<br />
by analyzing six calibration standards within the<br />
concentration ranging from 45 to 2100 lg/L which correspond<br />
a patulin concentration ranging from 15 to 700 lg/L<br />
in samples. The correlation coefficient was 0.996.<br />
Patulin was detected in all samples analyzed in concentrations<br />
ranging from 56 to 653 lg/L. In Fig. 2, the box<br />
plots for all samples analyzed show the inter-quartile range<br />
<strong>of</strong> each stage <strong>of</strong> <strong>apple</strong> <strong>juice</strong> production (box), the median<br />
(line inside the box) and minimum and maximum values<br />
(the bar hedges outside the box); the bold line shows the<br />
mean patulin content at each stage <strong>of</strong> <strong>apple</strong> <strong>juice</strong> production.<br />
These results show that the patulin levels can be considerable<br />
reduced through <strong>processing</strong> <strong>stages</strong>. Apple paste<br />
Fig. 2. Trend <strong>of</strong> patulin from milling process to evaporation. The box plot represents the median (line inside the box), the upper and lower quartiles (the<br />
hedges <strong>of</strong> the box), the minimum and maximum (the bar hedges outside the box) <strong>of</strong> patulin for each <strong>apple</strong> <strong>juice</strong> step. The hold curve is the average trend <strong>of</strong><br />
patulin.
Table 1<br />
ANOVA analysis<br />
Source Sum <strong>of</strong> squares DF Mean<br />
square<br />
F-value q-value<br />
Stage 1019099.282 4 254774.821 104.394
52 J.E. Welke et al. / Food Control 20 (2009) 48–52<br />
Kadakal, C., Sebahattin, N., & Poyrazoglu, E. S. (2002). <strong>Effect</strong> <strong>of</strong><br />
commercial <strong>processing</strong> <strong>stages</strong> <strong>of</strong> <strong>apple</strong> <strong>juice</strong> on patulin, fumaric acid<br />
and hydroxymethylfurfural (HMF) levels. Journal <strong>of</strong> Food Quality,<br />
25(4), 359–368.<br />
Kadakal, C., & Nas, S. (2003). <strong>Effect</strong> <strong>of</strong> heat treatment and evaporation<br />
on patulin and some other properties <strong>of</strong> <strong>apple</strong> <strong>juice</strong>. Journal <strong>of</strong> the<br />
Science <strong>of</strong> Food and Agriculture, 83(9), 987–990.<br />
Labuda, R., & Tancinová, D. (2006). Fungi recovered from Slovakian<br />
poultry feed mixtures and their toxinogenity. Annals <strong>of</strong> Agricultural<br />
and Environmental Medicine, 13, 193–200.<br />
MacDonald, S., Long, M., Gilbert, J., Felgueiras, I., Brera, C.,<br />
Jørgensen, K., et al. (2000). Liquid chromatographic method for<br />
determination <strong>of</strong> patulin in clear and cloudy <strong>apple</strong> <strong>juice</strong>s and<br />
<strong>apple</strong> puree: Collaborative study. Journal <strong>of</strong> AOAC International,<br />
83(6), 1387–1394.<br />
Martins, M. L., Gimeno, A., Martins, H. M., & Bernardo, F. (2002). Cooccurrence<br />
<strong>of</strong> patulin and citrinin in Portuguese <strong>apple</strong>s with rotten<br />
spots. Food Additives and Contaminants, 19(6), 568–574.<br />
Northold, M. D., & Bullerman, L. B. (1982). Prevention <strong>of</strong> mold growth<br />
and toxic production through control <strong>of</strong> environmental conditions.<br />
Journal <strong>of</strong> Food Protection, 45, 519–526.<br />
Rice, S. L., Beuchat, L. R., & Worthington, R. E. (1977). Patulin<br />
production by Byssochlamys spp. in fruit <strong>juice</strong>s. Applied and Environmental<br />
Microbiology, 34(6), 791–796.<br />
Sanderson, P. G., & Spotts, R. A. (1995). Postharvest decay <strong>of</strong> winter pear<br />
and <strong>apple</strong> fruit caused by species <strong>of</strong> Penicillium. Phytopathology, 85(1),<br />
103–110.<br />
Sommer, N. F., Buchana, J. R., & Fortlage, R. J. (1974). Production <strong>of</strong><br />
patulin by Penicillium expansum. Journal <strong>of</strong> Applied Microbiology,<br />
28(4), 589–593.<br />
Taniwaki, M. H., Hoenderboom, C. J. M., Vitali, A. A., & Eiroa, M. E.<br />
U. (1992). Migration <strong>of</strong> patulin in <strong>apple</strong> <strong>juice</strong>. Journal <strong>of</strong> Food<br />
Protection, 55, 902–904.<br />
The Commission <strong>of</strong> the European Communities (2006). No. 1881/2006 –<br />
L364/17. Official Journal European Union, 13–14.<br />
Vero, S., Mondino, P., Burgueño, J., Soubes, M., & Wisniewski, M.<br />
(2002). Characterization <strong>of</strong> biocontrol activity <strong>of</strong> two yeast strains<br />
from Uruguay against blue mold <strong>of</strong> <strong>apple</strong>. Postharvest Biology and<br />
Technology, 26(1), 91–98.<br />
WHO (1995). World Health Organization, 44th Report <strong>of</strong> the Joint FAO/<br />
WHO Expert Committee on Food Additives, Technical Report Series,<br />
859, 36.