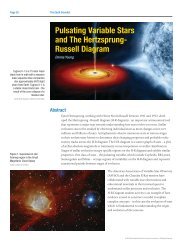
Pulsating Variable Stars and the Hertzsprung-Russell (HR)
Pulsating Variable Stars and the Hertzsprung-Russell (HR)
Pulsating Variable Stars and the Hertzsprung-Russell (HR)

You also want an ePaper? Increase the reach of your titles
YUMPU automatically turns print PDFs into web optimized ePapers that Google loves.
<strong>Pulsating</strong> <strong>Variable</strong> <strong>Stars</strong> <strong>and</strong> <strong>the</strong> <strong>Hertzsprung</strong>-<strong>Russell</strong> (H-R) Diagram<br />
The <strong>Hertzsprung</strong>-<strong>Russell</strong> (H-R) Diagram<br />
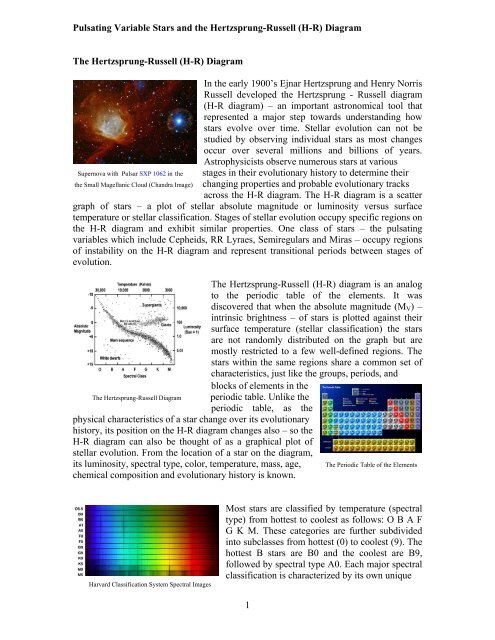
In <strong>the</strong> early 1900’s Ejnar <strong>Hertzsprung</strong> <strong>and</strong> Henry Norris<br />
<strong>Russell</strong> developed <strong>the</strong> <strong>Hertzsprung</strong> - <strong>Russell</strong> diagram<br />
(H-R diagram) – an important astronomical tool that<br />
represented a major step towards underst<strong>and</strong>ing how<br />
stars evolve over time. Stellar evolution can not be<br />
studied by observing individual stars as most changes<br />
occur over several millions <strong>and</strong> billions of years.<br />
Astrophysicists observe numerous stars at various<br />
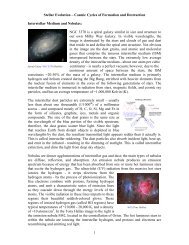
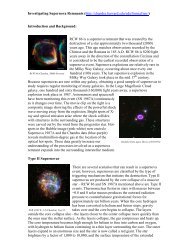
Supernova with Pulsar SXP 1062 in <strong>the</strong> stages in <strong>the</strong>ir evolutionary history to determine <strong>the</strong>ir<br />
<strong>the</strong> Small Magellanic Cloud (Ch<strong>and</strong>ra Image) changing properties <strong>and</strong> probable evolutionary tracks<br />
across <strong>the</strong> H-R diagram. The H-R diagram is a scatter<br />
graph of stars – a plot of stellar absolute magnitude or luminosity versus surface<br />
temperature or stellar classification. Stages of stellar evolution occupy specific regions on<br />
<strong>the</strong> H-R diagram <strong>and</strong> exhibit similar properties. One class of stars – <strong>the</strong> pulsating<br />
variables which include Cepheids, RR Lyraes, Semiregulars <strong>and</strong> Miras – occupy regions<br />
of instability on <strong>the</strong> H-R diagram <strong>and</strong> represent transitional periods between stages of<br />
evolution.<br />
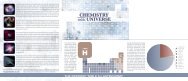
The <strong>Hertzsprung</strong>-<strong>Russell</strong> (H-R) diagram is an analog<br />
to <strong>the</strong> periodic table of <strong>the</strong> elements. It was<br />
discovered that when <strong>the</strong> absolute magnitude (MV) –<br />
intrinsic brightness – of stars is plotted against <strong>the</strong>ir<br />
surface temperature (stellar classification) <strong>the</strong> stars<br />
are not r<strong>and</strong>omly distributed on <strong>the</strong> graph but are<br />
mostly restricted to a few well-defined regions. The<br />
stars within <strong>the</strong> same regions share a common set of<br />
characteristics, just like <strong>the</strong> groups, periods, <strong>and</strong><br />
blocks of elements in <strong>the</strong><br />
The <strong>Hertzsprung</strong>-<strong>Russell</strong> Diagram periodic table. Unlike <strong>the</strong><br />
periodic table, as <strong>the</strong><br />
physical characteristics of a star change over its evolutionary<br />
history, its position on <strong>the</strong> H-R diagram changes also – so <strong>the</strong><br />
H-R diagram can also be thought of as a graphical plot of<br />
stellar evolution. From <strong>the</strong> location of a star on <strong>the</strong> diagram,<br />
its luminosity, spectral type, color, temperature, mass, age, The Periodic Table of <strong>the</strong> Elements<br />
chemical composition <strong>and</strong> evolutionary history is known.<br />
Harvard Classification System Spectral Images<br />
Most stars are classified by temperature (spectral<br />
type) from hottest to coolest as follows: O B A F<br />
G K M. These categories are fur<strong>the</strong>r subdivided<br />
into subclasses from hottest (0) to coolest (9). The<br />
hottest B stars are B0 <strong>and</strong> <strong>the</strong> coolest are B9,<br />
followed by spectral type A0. Each major spectral<br />
classification is characterized by its own unique<br />
1
spectra. Though O B A F G K <strong>and</strong> M are <strong>the</strong> stellar classifications commonly shown on<br />
H-R diagrams, a number of new <strong>and</strong> extended spectral classes have been designated.<br />
These include Wolf-Rayet stars (W), cool dwarfs (L), brown dwarfs (T), carbon stars (C),<br />
<strong>and</strong> stars with zirconium oxide lines that are between M <strong>and</strong> C stars (S). The carbon stars<br />
(C) include stars that were originally classified as R <strong>and</strong> N stars. Class D (degenerate) is<br />
<strong>the</strong> modern classification for white dwarfs. The major classifications have subclasses –<br />
Class D is divided into 7 different subtypes of white dwarfs based upon variations in <strong>the</strong><br />
composition of <strong>the</strong>ir atmospheres, e.g. DQ white dwarfs have a carbon-rich atmosphere<br />
as indicated by atomic or molecular carbon spectral lines.<br />
Spectral lines can show different characteristics within<br />
<strong>the</strong> same spectral type or temperature (T), <strong>and</strong> so a<br />
second type of classification system for stars was<br />
devised using luminosity. The differences in spectral<br />
lines among stars having <strong>the</strong> same spectral type are a<br />
function of <strong>the</strong> radius of <strong>the</strong> star, which results in<br />
different luminosities. Luminosity (L) is related to <strong>the</strong><br />
absolute magnitude (MV) of a star, <strong>and</strong> is <strong>the</strong> total<br />
amount of energy radiated per second. Luminosity is<br />
proportional to <strong>the</strong> fourth power of <strong>the</strong> temperature<br />
(T 4 ). Two stars with similar effective temperatures but<br />
greatly different luminosities must <strong>the</strong>refore differ in<br />
size. They belong to different luminosity classes within<br />
that spectral type, as determined from <strong>the</strong>ir spectra. Stellar Luminosity Classes on <strong>the</strong> H-R Diagram<br />
luminosities range from one million times more luminous<br />
than <strong>the</strong> Sun to one ten-thous<strong>and</strong>th of <strong>the</strong> luminosity of <strong>the</strong> Sun. The basic luminosity<br />
categories from most to least luminous are I <strong>and</strong> II, supergiants <strong>and</strong> bright giants<br />
respectively, III giants, IV subgiants, V main sequence stars, VI subdwarfs <strong>and</strong> VII white<br />
dwarfs.<br />
Starting at <strong>the</strong> upper left-h<strong>and</strong> corner <strong>and</strong> curving down to <strong>the</strong><br />
lower right-h<strong>and</strong> corner is a b<strong>and</strong> called <strong>the</strong> main sequence.<br />
~90% of all stars lie within <strong>the</strong> main sequence. These stars<br />
run from <strong>the</strong> hot <strong>and</strong> bright O <strong>and</strong> B stars at <strong>the</strong> top left-h<strong>and</strong><br />
corner to <strong>the</strong> cool, dim K <strong>and</strong> M stars at <strong>the</strong> lower right-h<strong>and</strong><br />
corner. Main sequence stars have a fairly steady rate of<br />
hydrogen fusion ongoing in <strong>the</strong>ir cores. In main sequence<br />
stars, <strong>the</strong> radiation pressure pushing outward from <strong>the</strong> fusion<br />
process balanced by <strong>the</strong> inward pull of gravitational forces<br />
Major Branches on <strong>the</strong> H-R Diagram maintains a state of dynamic equilibrium. When hydrogen in<br />
<strong>the</strong> core is depleted <strong>and</strong> radiation pressure decreases, <strong>the</strong> two<br />
forces become unbalanced <strong>and</strong> <strong>the</strong> star “moves off <strong>the</strong> main<br />
sequence” <strong>and</strong> begins a series of evolutionary stages – <strong>the</strong> final<br />
end product(s) depending upon <strong>the</strong> initial mass of <strong>the</strong> star. The<br />
giant <strong>and</strong> supergiant branches of <strong>the</strong> H-R diagram are occupied<br />
by stars that have transitioned from <strong>the</strong> main sequence <strong>and</strong> are<br />
fusing heavier atomic nuclei. As most stars transition from <strong>the</strong><br />
main sequence to <strong>the</strong> giant <strong>and</strong> supergiant branches, <strong>the</strong>y<br />
exhibit different types of variability that are also confined to<br />
specific regions on <strong>the</strong> diagram.<br />
Evolutionary Track of <strong>the</strong> Sun<br />
Across <strong>the</strong> H-R Diagram<br />
2
<strong>Variable</strong> <strong>Stars</strong> <strong>and</strong> Light Curves<br />
As many stars transition from one stage to ano<strong>the</strong>r on<br />
<strong>the</strong> H-R diagram <strong>the</strong>y vary in brightness. The<br />
brightness that a star appears to have (apparent<br />
magnitude) from our perspective here on Earth<br />
depends upon its distance from Earth <strong>and</strong> its actual<br />
intrinsic brightness, or absolute magnitude (MV). The<br />
behavior of stars that vary in magnitude (brightness)<br />
can be studied by measuring <strong>the</strong>ir changes in<br />
brightness over time <strong>and</strong> plotting <strong>the</strong> changes on a<br />
graph called a light curve. Light curves are usually<br />
A <strong>Variable</strong> Star Classification plots of apparent magnitude over time. The apparent<br />
magnitudes of stars are adjusted to what <strong>the</strong>ir values<br />
would be without <strong>the</strong> light extinctions caused by <strong>the</strong> atmosphere. The brightest stars are<br />
designated as first magnitude, <strong>and</strong> those at <strong>the</strong> limits of unaided eye observation as sixth<br />
magnitude. Vega, <strong>the</strong> brightest star in <strong>the</strong> summer sky in <strong>the</strong> Nor<strong>the</strong>rn Hemisphere, was<br />
originally designated as <strong>the</strong> zero point, <strong>and</strong> has an apparent magnitude of +0.03.<br />
Examples of apparent magnitude values for celestial objects are: <strong>the</strong> Sun as seen from<br />
Earth -26.74, <strong>the</strong> full moon -12.92, Crab supernova (SN 1054) -6.00, Venus -4.89, Sirius<br />
(α Canis Majoris) -1.47 M33, (Andromeda Galaxy) +5.72, <strong>and</strong> Pluto +13.65.<br />
Historically <strong>the</strong> time scale has been <strong>the</strong> Julian Day (JD), a counting system starting with<br />
January 1, 4713 BC – Julian Day number 1. Currently astronomers are beginning to use<br />
day <strong>and</strong>/or year for <strong>the</strong> time scale. Measuring <strong>and</strong> recording <strong>the</strong> changes in magnitude<br />
<strong>and</strong> plotting <strong>the</strong> resulting light curves allow astronomers to determine <strong>the</strong> period of<br />
variation. The period is <strong>the</strong> amount of time it takes for <strong>the</strong> star to go through one<br />
complete cycle from maximum magnitude through minimum magnitude <strong>and</strong> back to<br />
maximum magnitude. The 2011 General<br />
Catalog of <strong>Variable</strong> <strong>Stars</strong> (GCVS) classifies<br />
43,675 Milky Way Galaxy stars into several<br />
different categories <strong>and</strong> subcategories of<br />
variability. NOTE: For more information<br />
about variable stars <strong>and</strong> light curves, The AAVSO Dwarf Nova Cataclysmic <strong>Variable</strong> Light Curve<br />
American Association of <strong>Variable</strong> Star<br />
Observers (AAVSO) has a set of curricular materials – <strong>Variable</strong> Star Astronomy (VSA) –<br />
with content, activities <strong>and</strong> investigations, based on <strong>the</strong> AAVSO’s unique electronic<br />
database of more than 21,000,000 variable star observations. The VSA materials are<br />
available at http://www.aavso.org/educational/vsa/.<br />
Intrinsic <strong>Variable</strong> <strong>Stars</strong> – Cataclysmic <strong>and</strong> <strong>Pulsating</strong><br />
Stellar Evolution: A Journey with Ch<strong>and</strong>ra<br />
Ch<strong>and</strong>ra Poster<br />
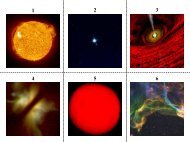
Intrinsic variable stars vary due to physical changes<br />
within <strong>the</strong> star or star system <strong>and</strong> are divided into two<br />
classes – cataclysmic <strong>and</strong> pulsating. Many of <strong>the</strong>se<br />
variables are ei<strong>the</strong>r stages of stellar evolution, or<br />
transitional periods from one stage of stellar evolution<br />
to ano<strong>the</strong>r. <strong>Pulsating</strong> stars are important for studying<br />
<strong>the</strong> internal structures <strong>and</strong> processes of evolving stars.<br />
3
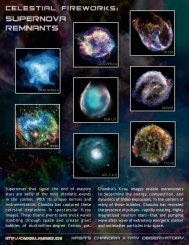
Cataclysmic <strong>Variable</strong>s: Supernovas <strong>and</strong> novas are cataclysmic<br />
variables. Nova eruptions occur in contact binary systems. Some<br />
systems consist of a white dwarf orbiting a larger <strong>and</strong> cooler star,<br />
such as a red giant – o<strong>the</strong>rs have a white dwarf <strong>and</strong> a main<br />
sequence star companion. A layer of hydrogen-rich material is<br />
slowly accreted from <strong>the</strong> red giant or main sequence star into an<br />
accretion disk surrounding <strong>the</strong> compact white dwarf. As matter<br />
accumulates in <strong>the</strong> accretion disk, <strong>the</strong> disk becomes unstable.<br />
Eventually, matter from <strong>the</strong> unstable disk may fall onto <strong>the</strong> white Type Ia Supernova (SN1994D)<br />
dwarf, leading to an outburst, or nova. If <strong>the</strong> amount of material in Galaxy NGC 4526<br />
infalling onto <strong>the</strong> surface of <strong>the</strong> white dwarf is large enough<br />
for <strong>the</strong> mass of <strong>the</strong> white dwarf to approach <strong>the</strong> Ch<strong>and</strong>rasekhar limit, runaway fusion<br />
results in a <strong>the</strong>rmonuclear explosion which completely destroys <strong>the</strong> white dwarf – leaving<br />
behind only <strong>the</strong> remnant. The system increases in brightness to a<br />
typical magnitude of -19.3 within a few days, <strong>the</strong>n <strong>the</strong> light<br />
slowly fades back to its original brightness over <strong>the</strong> next several<br />
months to years. The <strong>the</strong>rmonuclear destruction of a white dwarf<br />
is a Type Ia supernova event. The discovery for <strong>the</strong> first<br />
recognized variable star is attributed to Tycho Brahe, who<br />
discovered a supernova in 1572. Tycho’s supernova was a Type<br />
Ia event – a remnant with no stellar core.<br />
Tycho’s Supernova Remnant<br />
(Ch<strong>and</strong>ra Image)<br />
A Type II supernova is <strong>the</strong> result of <strong>the</strong> core collapse<br />
of a massive star. The core collapses so fast that it<br />
momentarily goes past its equilibrium point at nuclear<br />
density <strong>and</strong> instantaneously rebounds. The innermost<br />
layers of <strong>the</strong> star are still in-falling <strong>and</strong> meet <strong>the</strong><br />
rebounding core, creating a shock wave that runs<br />
outward through <strong>the</strong> layers towards to <strong>the</strong> star's surface.<br />
A Type II supernova can brighten by 20 magnitudes SN 2006gy massive Type II Supernova Event<br />
or more; <strong>and</strong> if <strong>the</strong> (Composite Ch<strong>and</strong>ra, Lick Observatory Image)<br />
progenitor star is<br />
truly massive, it can outshine <strong>the</strong> entire galaxy in X-ray<br />
emissions. The end product within <strong>the</strong> remnant depends<br />
upon <strong>the</strong> initial mass of <strong>the</strong> star, <strong>and</strong> is a neutron star,<br />
pulsar, magnetar, or black hole. Supernovas are <strong>the</strong><br />
catastrophic <strong>and</strong> final evolutionary stages for more<br />
massive stars (Type II) <strong>and</strong> mid-sized progenitor stars<br />
Comparison Light Curves for Type Ia, Type II, in a contact binary system that had evolved into a<br />
SN 1987 (Type II), <strong>and</strong> SN 2006gy Supernovas planetary nebula <strong>and</strong> white dwarf (Type Ia). More<br />
information about Type Ia <strong>and</strong> Type II supernovas is<br />
available at: http://ch<strong>and</strong>ra.harvard.edu/edu/formal/snr/bg.html.<br />
<strong>Pulsating</strong> <strong>Variable</strong>s: <strong>Pulsating</strong> variable stars vary in brightness due to physical changes<br />
within <strong>the</strong> interior of <strong>the</strong> star. The pulsations are due to <strong>the</strong> periodic expansion <strong>and</strong><br />
contraction of <strong>the</strong> surface layers of <strong>the</strong> stars. The change in size is observed as a change<br />
in apparent magnitude. <strong>Stars</strong> pulsate because <strong>the</strong>y are not in hydrostatic equilibrium: <strong>the</strong><br />
force of gravity acting on <strong>the</strong> outer mass of <strong>the</strong> star is not balanced by <strong>the</strong> interior<br />
radiation pressure directed outwards from <strong>the</strong> interior. If a star exp<strong>and</strong>s as a result of<br />
increased radiation pressure, <strong>the</strong> material density <strong>and</strong> pressure decrease until hydrostatic<br />
equilibrium is reached <strong>and</strong> <strong>the</strong>n overshot, owing to <strong>the</strong> momentum of <strong>the</strong> expansion. At<br />
4
this point <strong>the</strong> star is transparent <strong>and</strong> photons can escape. Then gravity dominates, <strong>and</strong> <strong>the</strong><br />
star begins to contract. The momentum of <strong>the</strong> infalling<br />
material carries <strong>the</strong> contraction beyond <strong>the</strong> equilibrium<br />
point. The star becomes opaque <strong>and</strong> photons are trapped<br />
<strong>and</strong> <strong>the</strong> star becomes dimmer. The pressure again becomes<br />
too high, <strong>and</strong> <strong>the</strong> cycle starts over again. The system acts as<br />
an oscillator. With loose atmospheric layers of gases, <strong>the</strong><br />
oscillations get out of phase with one ano<strong>the</strong>r <strong>and</strong> set <strong>the</strong><br />
stage for chaotic motions. Energy is dissipated during such<br />
pulsations (analogous to losses caused by friction forces),<br />
<strong>and</strong> eventually this loss of energy should result in a<br />
damping or lessening of <strong>the</strong> pulsations. The prevalence <strong>and</strong> A <strong>Pulsating</strong> Mira <strong>Variable</strong> Star (Chi Cyg)<br />
regularity of pulsating stars imply that <strong>the</strong> dissipated energy<br />
is replenished in some way. The dynamics of pulsating variable stars is complicated <strong>and</strong><br />
not well understood.<br />
The different types of pulsating variables are distinguished by <strong>the</strong>ir periods of pulsation<br />
<strong>and</strong> <strong>the</strong> shapes of <strong>the</strong>ir light curves. These in turn are a function of <strong>the</strong>ir mass <strong>and</strong><br />
evolutionary stage. Cepheids, RR Lyraes, <strong>and</strong> Long Period <strong>Variable</strong>s (LPVs) – Miras<br />
<strong>and</strong> Semiregulars – are pulsating variable stars <strong>and</strong> occupy regions on <strong>the</strong> H-R diagram<br />
called instability strips. The instability occurs as main sequence stars transition to <strong>and</strong><br />
along <strong>the</strong> giant <strong>and</strong> supergiant branches of <strong>the</strong> H-R diagram.<br />
Cepheid variable stars exp<strong>and</strong> <strong>and</strong> contract in a<br />
repeating cycle of size changes. The change in size<br />
can be observed as a change in apparent brightness<br />
(apparent magnitude.) Cepheids have a repeating<br />
cycle of change that is periodic - as regular as <strong>the</strong><br />
AAVSO Cepheid Light Curve (Delta Cephei) beating of a heart, with periods of 1 to 70 days with<br />
an amplitude variation of 0.1 to 2.0 magnitudes.<br />
These massive stars (~8 solar masses) have a high luminosity <strong>and</strong> are spectral class F at<br />
maximum, <strong>and</strong> G to K at minimum. Cepheids occupy an elongated horizontal instability<br />
strip on <strong>the</strong> H-R diagram as massive stars transition from <strong>the</strong> main sequence to <strong>the</strong> giant<br />
<strong>and</strong>/or supergiant branches.<br />
RR Lyrae variables are older pulsating white giants with low<br />
metallicity. They are common in globular clusters – dense<br />
groups of old stars in <strong>the</strong> halos of galaxies. Like Cepheids,<br />
<strong>the</strong>ir pulsations are periodic. RR Lyraes have ~0.5 solar mass<br />
<strong>and</strong> have a short pulsation period of 0.05 to 1.2 days <strong>and</strong><br />
amplitude variations of 0.3 to 2 magnitudes. RR Lyrae stars<br />
are usually spectral class A. RR Lyrae stars occupy a small<br />
AAVSO RR Lyrae Light Curve instability strip near <strong>the</strong> intersection of <strong>the</strong> main sequence<br />
(RR Lyrae) <strong>and</strong> <strong>the</strong> horizontal giant branch (HB). The HB stars have left<br />
<strong>the</strong> red giant branch <strong>and</strong> are characterized<br />
by helium fusion in <strong>the</strong>ir cores surrounded by a shell of hydrogen<br />
fusion. RR Lyrae stars are highly evolved older stars with low<br />
metallicity, more luminous than <strong>the</strong> Sun <strong>and</strong> less luminous than<br />
Cepheids. Globular clusters with well-defined horizontal branches<br />
usually have significant numbers of RR Lyrae stars.<br />
RR Lyraes in Globular<br />
Cluster M3 Movie<br />
5
All of <strong>the</strong> RR Lyrae stars in a cluster have <strong>the</strong> same average apparent magnitude. In<br />
different clusters, <strong>the</strong> average apparent magnitude is different. This is because all RR<br />
Lyraes have about <strong>the</strong> same average absolute magnitude of +0.75. Many lower-mass<br />
giant stars will go through a RR Lyrae pulsation stage while many higher-mass giant stars<br />
will go through a Cepheid stage. Because low-mass stars live longer than high-mass stars,<br />
<strong>the</strong> Cepheid stars as a group are younger than <strong>the</strong> RR Lyrae stars. RR Lyrae stars can be<br />
used as st<strong>and</strong>ard c<strong>and</strong>les to measure cosmological distances out to ~760,000 parsecs (2.5<br />
million light years). The more luminous Cepheid variables can be used to measure<br />
distances out to ~40 million parsecs (130 million light years).<br />
Cepheids <strong>and</strong> RR Lyrae variables portray a relationship<br />
between <strong>the</strong>ir periods <strong>and</strong> luminosities. The periodluminosity<br />
relationship is also known as <strong>the</strong> Leavitt law –<br />
named after its discoverer Henrietta Leavitt at <strong>the</strong> Harvard<br />
College Observatory in Cambridge, Massachusetts in <strong>the</strong><br />
early 1900’s. Once a Cepheid or RR Lyrae has been<br />
identified from its light curve, <strong>the</strong> period is calculated <strong>and</strong> <strong>the</strong><br />
associated luminosity is determined. The luminosity is <strong>the</strong>n<br />
The Period-Luminosity Relationship ei<strong>the</strong>r used directly or converted to absolute magnitude <strong>and</strong><br />
used with <strong>the</strong> apparent magnitude in <strong>the</strong> distance modulus<br />
equation to calculate distances. The distance modulus is a ma<strong>the</strong>matical relationship that<br />
relates absolute magnitude, apparent magnitude, <strong>and</strong> distance. The general relationship is<br />
written as: m - M = 5 log10 [d / (10 pc)], where m = apparent magnitude, M = absolute<br />
magnitude <strong>and</strong> d = distance.<br />
Long Period <strong>Variable</strong>s (LPVs) are pulsating red giants or supergiants with periods<br />
ranging from 30-1000 days. They are usually of spectral type M, R, C or N. There are<br />
two subclasses; Mira <strong>and</strong> Semiregular.<br />
Mira variables are periodic pulsating red giants with<br />
periods of 80 to 1000 days. It is a stage that most midsized<br />
main sequence stars transition through as <strong>the</strong>y<br />
evolve to <strong>the</strong> red giant branch. Miras have amplitude<br />
variations of more than 2.5 magnitudes. Mira (Omicron<br />
Ceti) is <strong>the</strong> prototype of Mira variable stars. The Sun will<br />
AAVSO Light Curve (Omicron Ceti) eventually transition through a pulsating Mira stage. The<br />
Mira instability strip on <strong>the</strong> H-R diagram is located in a<br />
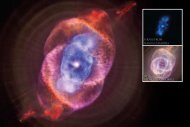
region between mid-sized stars on <strong>the</strong> main sequence <strong>and</strong> <strong>the</strong> giant branch. Mira was <strong>the</strong><br />
second variable star to be discovered, by<br />
David Fabricius in 1596 – 24 years after<br />
Tycho’s observation of a Type Ia<br />
supernova. Mira is in a contact binary<br />
system with a white dwarf companion.<br />
Material from <strong>the</strong> surface of <strong>the</strong> red<br />
giant Mira A is forming an accretion<br />
disk surrounding <strong>the</strong> white dwarf – Mira<br />
B. Mira will eventually collapse <strong>and</strong> form Ch<strong>and</strong>ra Image <strong>and</strong> Illustration of <strong>the</strong> Mira A <strong>and</strong> Mira B System<br />
a planetary nebula <strong>and</strong> a white dwarf. If a<br />
large enough mass of materials infalls onto <strong>the</strong> surface of <strong>the</strong> white dwarf (Mira B) from<br />
Mira A, <strong>the</strong> white dwarf could produce a Type Ia supernova event – o<strong>the</strong>rwise <strong>the</strong> system<br />
will result in two co-orbiting white dwarfs.<br />
6
Semiregular variables are giants <strong>and</strong> supergiants showing<br />
periodicity accompanied by intervals of semiregular or<br />
irregular light variation. Their periods range from 30 to<br />
1000 days, generally with amplitude variations of less than<br />
2.5 magnitudes. Antares (α Scorpius) <strong>and</strong> Betelgeuse (α<br />
AAVSO Light Curve (Z Ursae Majoris) Orionis) are two prominent examples of LPV semiregular<br />
variable stars. These stars occupy a region<br />
of instability on <strong>the</strong> H-R diagram above <strong>the</strong> Mira variables <strong>and</strong> are<br />
generally spectral class K, M, C or S.<br />
Antares <strong>and</strong> Betelgeuse will both<br />
eventually collapse into Type II<br />
supernovas – leaving behind a remnant<br />
<strong>and</strong> a neutron star or pulsar core –<br />
possibly within <strong>the</strong> next one million<br />
years.<br />
Antares in <strong>the</strong> Constellation Scorpio Betelgeuse in <strong>the</strong><br />
Constellation Orion<br />
<strong>Pulsating</strong> <strong>Variable</strong> <strong>Stars</strong> <strong>and</strong> Instability Strips on <strong>the</strong> H-R Diagram<br />
Many objects can not be plotted on <strong>the</strong> H-R diagram due to<br />
<strong>the</strong>ir extreme <strong>and</strong> complex properties – such as neutron stars,<br />
pulsars, black holes, planetary nebulas <strong>and</strong> supernova remnants.<br />
Neutron stars <strong>and</strong> pulsars are <strong>the</strong> stellar cores of supergiants<br />
that have collapsed. They have temperatures of approximately a<br />
million degrees Kelvin, <strong>and</strong> would fall far off to <strong>the</strong> left of <strong>the</strong><br />
H-R diagram. Black holes, <strong>the</strong> end result from catastrophic<br />
collapses of <strong>the</strong> most massive stars, emit no light on <strong>the</strong>ir own<br />
<strong>and</strong> <strong>the</strong>refore have no absolute visual magnitude. Their<br />
surroundings may become visible if <strong>the</strong>y accrete mass from a<br />
binary companion, but <strong>the</strong>y still cannot be placed on an H-R<br />
diagram. Planetary nebulas are remnants comprised of<br />
illuminated material that surrounds white dwarfs. Strong stellar<br />
winds from <strong>the</strong> progenitor red giant stars <strong>and</strong> <strong>the</strong> expulsion of<br />
The Cambridge Encyclopedia of surface materials from <strong>the</strong> slight rebound of <strong>the</strong> core during <strong>the</strong><br />
<strong>Stars</strong>, J B Taylor, © 2006 collapse produce planetary nebulas which continue to exp<strong>and</strong><br />
into <strong>the</strong> interstellar medium (ISM). Though planetary nebulas<br />
are sometimes shown on H-R diagrams, it is usually to show <strong>the</strong> progress of <strong>the</strong> central<br />
white dwarf star as it transitions to <strong>the</strong> white dwarf branch of<br />
<strong>the</strong> diagram – <strong>the</strong>y would also fall to <strong>the</strong> left of <strong>the</strong> upper-left<br />
quadrant of <strong>the</strong> H-R diagram. As planetary nebulas continue to<br />
exp<strong>and</strong>, <strong>the</strong>y become more <strong>and</strong> more tenuous <strong>and</strong> after ~25,000<br />
– 50,000 years are no longer visible. Type II supernova<br />
remnants contain materials from <strong>the</strong> progenitor star when <strong>the</strong><br />
rebounding core meets <strong>the</strong> infalling atmospheric layers, <strong>and</strong><br />
Type Ia supernova remnants are <strong>the</strong> materials produced from<br />
<strong>the</strong> <strong>the</strong>rmonuclear destruction of a white dwarf.<br />
The remnants are complex <strong>and</strong> contain structures such as knots, SN G292.0+1.8 Composite Image<br />
filaments <strong>and</strong> shock waves <strong>and</strong> can not be plotted on <strong>the</strong> H-R Ch<strong>and</strong>ra/Palomar Obs/DSS<br />
diagram.<br />
.<br />
7
Since stars are plotted on <strong>the</strong> H-R diagram by absolute<br />
magnitude <strong>and</strong>/or luminosity <strong>and</strong> surface temperature (stellar<br />
classification), each star is plotted as one data point. Main<br />
sequence stars, giants <strong>and</strong> supergiants, <strong>and</strong> white dwarfs all<br />
occupy specific branches on <strong>the</strong> diagram. These objects have<br />
an absolute magnitude <strong>and</strong> temperature that does not vary<br />
enough to change <strong>the</strong>ir spectral class. Plotting Cepheids, RR<br />
Lyrae, Mira <strong>and</strong> Semiregular pulsating variable stars on <strong>the</strong> H-<br />
R diagram is not a single plot like non-pulsating stars. During<br />
<strong>the</strong>ir evolution through <strong>the</strong> instability strips <strong>the</strong>y are<br />
pulsationally unstable – exp<strong>and</strong>ing <strong>and</strong> brightening, <strong>the</strong>n<br />
contracting <strong>and</strong> become dimmer. The instability strips for<br />
Miras <strong>and</strong> Cepheids are especially elongated because of <strong>the</strong>se<br />
expansions <strong>and</strong> contractions. Some pulsating variable stars<br />
change in temperature by two spectral classes during one cycle<br />
The Cambridge Encyclopedia of from maximum to minimum. To study <strong>the</strong> complete cycle of<br />
<strong>Stars</strong>, J B Taylor, © 2006 change for individual variable stars, it is necessary to plot <strong>the</strong>m<br />
twice on <strong>the</strong> H-R diagram – both at<br />
maximum absolute magnitude (MVmax) <strong>and</strong> minimum absolute<br />
magnitude (Mvmin) – along with <strong>the</strong> corresponding spectral<br />
classes. NOTE: For simplification, pulsating variables are<br />
normally shown on H-R diagrams with one data point that<br />
represents <strong>the</strong>ir average absolute magnitudes <strong>and</strong> temperatures.<br />
The averages locate <strong>the</strong> variables on <strong>the</strong> diagram in <strong>the</strong> middle of<br />
<strong>the</strong>ir cycles; whereas a better underst<strong>and</strong>ing of <strong>the</strong>se stars<br />
necessitates plotting <strong>the</strong>m at both extremes of <strong>the</strong>ir cycles so <strong>the</strong><br />
degree of variation is more easily seen. H-R Diagram Instability Strips<br />
<strong>Variable</strong> stars need to be systematically observed over decades in order to determine <strong>the</strong>ir<br />
long-term behavior. The observational data are used to analyze variable star behavior <strong>and</strong><br />
to develop computerized <strong>the</strong>oretical models of variable stars. The nature of <strong>the</strong> variability<br />
provides information about stellar properties, such as mass, radius, luminosity,<br />
temperature, internal <strong>and</strong> external structure, composition, <strong>and</strong> evolutionary history.<br />
<strong>Variable</strong> stars play a crucial role in our underst<strong>and</strong>ing of <strong>the</strong> universe. Cepheids <strong>and</strong> RR<br />
Lyraes have played a major part in determining distances to galaxies <strong>and</strong> determining <strong>the</strong><br />
age of <strong>the</strong> Universe. Mira variables give us a glimpse into<br />
<strong>the</strong> future evolution of our own star; <strong>the</strong> Sun. Accretion<br />
disks in cataclysmic variables help us to underst<strong>and</strong><br />
larger scale disk dynamics – such as processes inside<br />
active galaxies with supermassive black holes. Through<br />
nucleosyn<strong>the</strong>sis, supernovas create <strong>the</strong> elements<br />
necessary for life, <strong>and</strong> are part of <strong>the</strong> process that<br />
provides <strong>the</strong> conditions for planetary formation. <strong>Variable</strong><br />
Ch<strong>and</strong>ra Illustration of Star CoRoT-2A stars are integral to <strong>the</strong> process of stellar evolution - <strong>the</strong><br />
with Planet <strong>and</strong> Distant Companion Star endless cycle of stellar formation <strong>and</strong> destruction. A<br />
complete description of <strong>the</strong> story of stellar evolution is<br />
available at <strong>the</strong> following: http://ch<strong>and</strong>ra.harvard.edu/edu/formal/stellar_ev/story/<br />
8