Pulsating Variable Stars and The Hertzsprung- Russell Diagram
Pulsating Variable Stars and The Hertzsprung- Russell Diagram
Pulsating Variable Stars and The Hertzsprung- Russell Diagram

Create successful ePaper yourself
Turn your PDF publications into a flip-book with our unique Google optimized e-Paper software.
Page 20 <strong>The</strong> Earth Scientist<br />
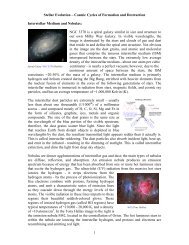
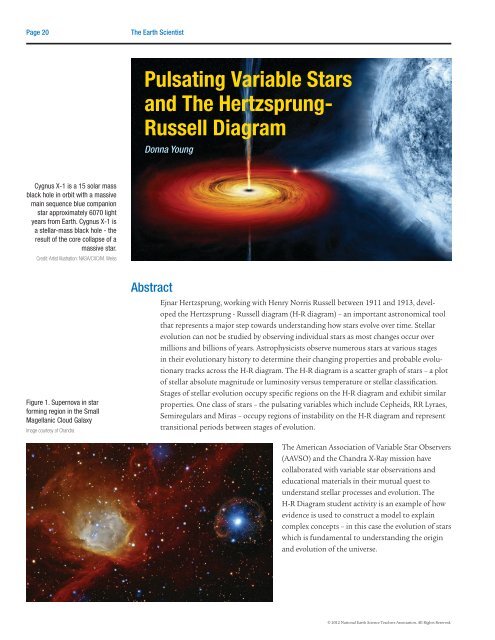
Cygnus X-1 is a 15 solar mass<br />
black hole in orbit with a massive<br />
main sequence blue companion<br />
star approximately 6070 light<br />
years from Earth. Cygnus X-1 is<br />
a stellar-mass black hole - the<br />
result of the core collapse of a<br />
massive star.<br />
Credit: Artist Illustration: NASA/CXC/M. Weiss<br />
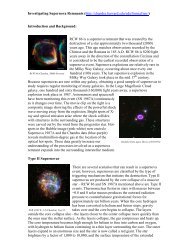
Figure 1. Supernova in star<br />
forming region in the Small<br />
Magellanic Cloud Galaxy<br />
Image courtesy of Ch<strong>and</strong>ra<br />
<strong>Pulsating</strong> <strong>Variable</strong> <strong>Stars</strong><br />
<strong>and</strong> <strong>The</strong> <strong>Hertzsprung</strong>-<br />
<strong>Russell</strong> <strong>Diagram</strong><br />
Donna Young<br />
Abstract<br />
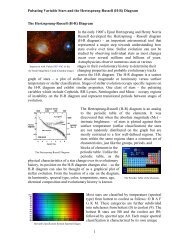
Ejnar <strong>Hertzsprung</strong>, working with Henry Norris <strong>Russell</strong> between 1911 <strong>and</strong> 1913, developed<br />
the <strong>Hertzsprung</strong> - <strong>Russell</strong> diagram (H-R diagram) – an important astronomical tool<br />
that represents a major step towards underst<strong>and</strong>ing how stars evolve over time. Stellar<br />
evolution can not be studied by observing individual stars as most changes occur over<br />
millions <strong>and</strong> billions of years. Astrophysicists observe numerous stars at various stages<br />
in their evolutionary history to determine their changing properties <strong>and</strong> probable evolutionary<br />
tracks across the H-R diagram. <strong>The</strong> H-R diagram is a scatter graph of stars – a plot<br />
of stellar absolute magnitude or luminosity versus temperature or stellar classification.<br />
Stages of stellar evolution occupy specific regions on the H-R diagram <strong>and</strong> exhibit similar<br />
properties. One class of stars – the pulsating variables which include Cepheids, RR Lyraes,<br />
Semiregulars <strong>and</strong> Miras – occupy regions of instability on the H-R diagram <strong>and</strong> represent<br />
transitional periods between stages of evolution.<br />
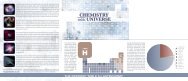
<strong>The</strong> American Association of <strong>Variable</strong> Star Observers<br />
(AAVSO) <strong>and</strong> the Ch<strong>and</strong>ra X-Ray mission have<br />
collaborated with variable star observations <strong>and</strong><br />
educational materials in their mutual quest to<br />
underst<strong>and</strong> stellar processes <strong>and</strong> evolution. <strong>The</strong><br />
H-R <strong>Diagram</strong> student activity is an example of how<br />
evidence is used to construct a model to explain<br />
complex concepts – in this case the evolution of stars<br />
which is fundamental to underst<strong>and</strong>ing the origin<br />
<strong>and</strong> evolution of the universe.<br />
© 2012 National Earth Science Teachers Association. All Rights Reserved.
<strong>The</strong> <strong>Hertzsprung</strong>-<strong>Russell</strong> (H-R) <strong>Diagram</strong><br />
<strong>The</strong> <strong>Hertzsprung</strong>-<strong>Russell</strong> (H-R) diagram is an analog to the<br />
periodic table of the elements. It was discovered that when<br />
the absolute magnitude (M V) – intrinsic brightness – of stars<br />
is plotted against their temperature (stellar classification)<br />
the stars are not r<strong>and</strong>omly distributed on the graph but are<br />
mostly restricted to a few well-defined regions. <strong>The</strong> stars<br />
within the same regions share a common set of characteristics,<br />
just like the groups, periods, <strong>and</strong> blocks of elements in<br />
the periodic table. Unlike the periodic table, as the physical<br />
characteristics of a star change over its evolutionary history,<br />
its position on the H-R diagram changes also – so the H-R<br />
diagram can also be thought of as a graphical plot of stellar<br />
evolution. From the location of a star on the diagram, its<br />
luminosity, spectral type, color, temperature, mass, chemical<br />
composition, age, <strong>and</strong> evolutionary history are known.<br />
© 2012 National Earth Science Teachers Association. All Rights Reserved.<br />
Volume XXVIII, Issue 1<br />
Most stars are classified by temperature (spectral type) from hottest to coolest as follows: O B A F G<br />
K M. <strong>The</strong>se categories are further subdivided<br />
into subclasses from hottest (0) to coolest (9).<br />
<strong>The</strong> hottest B stars are B0 <strong>and</strong> the coolest are<br />
B9, followed by spectral type A0. Each major<br />
spectral classification is characterized by its<br />
own unique spectra. Though O B A F G K <strong>and</strong><br />
M are the stellar classifications commonly<br />
shown on H-R diagrams, a number of new<br />
<strong>and</strong> extended spectral classes have been designated.<br />
<strong>The</strong>se include Wolf-Rayet stars (W),<br />
cool dwarfs (L), brown dwarfs (T), carbon<br />
stars (C), <strong>and</strong> stars with zirconium oxide lines<br />
that are between M <strong>and</strong> C stars (S). <strong>The</strong><br />
carbon stars (C) include stars that were<br />
originally classified as R <strong>and</strong> N stars. Class<br />
D (degenerate) is the modern classification<br />
for white dwarfs. <strong>The</strong> major classifications<br />
have subclasses – Class D is divided into 7<br />
different subtypes of white dwarfs based<br />
upon variations in the composition of their<br />
atmospheres, e.g. DQ white dwarfs have a<br />
carbon-rich atmosphere.<br />
Spectral lines can show different characteristics<br />
within the same spectral type or<br />
temperature (T), <strong>and</strong> so a second type of<br />
classification system for stars was devised<br />
using luminosity. <strong>The</strong> differences in spectral<br />
lines among stars having the same<br />
spectral type are a function of the radius<br />
of the star, which results in different<br />
Figure 2. Basic <strong>Hertzsprung</strong>-<br />
<strong>Russell</strong> diagram<br />
<strong>Diagram</strong> courtesy of NASA<br />
Page 21<br />
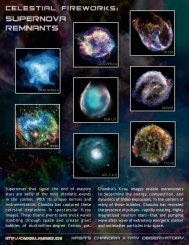
Figure 3 (above). Some examples<br />
of Harvard classification stellar<br />
spectra<br />
Image courtesy of NASA<br />
Figure 4 (left). <strong>The</strong> luminosity<br />
classifications on the H-R<br />
diagram<br />
<strong>Diagram</strong> courtesy of Wikimedia Commons
Page 22 <strong>The</strong> Earth Scientist<br />
Figure 5. H-R diagram of<br />
luminosity vs temperature<br />
Image Courtesy of the European Southern<br />
Observatory<br />
Figure 6. A variable star<br />
classification system<br />
<strong>Diagram</strong> (revised) courtesy of the Australian<br />
Telescope E/PO<br />
luminosities. Luminosity (L) is related to the absolute magnitude (M V) of a star, <strong>and</strong> is the total<br />
amount of energy radiated per second (luminosity is proportional to T 4 ). Two stars with similar<br />
effective temperatures but greatly different luminosities must differ in size. <strong>The</strong>y belong to different<br />
luminosity classes within that spectral type, as determined from their spectra. Stellar luminosities<br />
range from one million times more luminous than the Sun, to one<br />
ten-thous<strong>and</strong>th of the luminosity of the Sun. <strong>The</strong> basic luminosity<br />
categories from most to least luminous are I <strong>and</strong> II, supergiants <strong>and</strong><br />
bright giants respectively, III giants, IV subgiants, V main sequence<br />
stars, VI subdwarfs <strong>and</strong> VII white dwarfs.<br />
Starting at the upper left-h<strong>and</strong> corner <strong>and</strong> curving down to the lower<br />
right-h<strong>and</strong> corner is a b<strong>and</strong> called the main sequence. ~90% of all stars<br />
lie within the main sequence. <strong>The</strong>se stars run from the hot <strong>and</strong> bright<br />
O <strong>and</strong> B stars at the top left-h<strong>and</strong> corner to the cool, dim K <strong>and</strong> M<br />
stars at the lower right-h<strong>and</strong> corner. Main sequence stars have a fairly<br />
steady rate of hydrogen fusion ongoing in their cores. In main sequence<br />
stars, the radiation pressure pushing outward from the fusion process<br />
balanced by the inward pull of gravitational forces maintains a state<br />
of dynamic equilibrium. When hydrogen in the core is depleted <strong>and</strong><br />
radiation pressure decreases, the two forces become unbalanced <strong>and</strong> the<br />
star “moves off the main sequence” <strong>and</strong> begins a series of evolutionary<br />
stages – the final end product(s) depending upon the initial mass of the<br />
star. <strong>The</strong> giant <strong>and</strong> supergiant branches of the H-R diagram are occupied<br />
by stars that have transitioned from the main sequence <strong>and</strong> are fusing heavier atomic nuclei.<br />
As most stars transition from the main sequence to the giant <strong>and</strong> supergiant branches, they exhibit<br />
types of variability that are also confined to specific locations on the diagram.<br />
<strong>Pulsating</strong> <strong>Variable</strong> <strong>Stars</strong> <strong>and</strong> Light Curves<br />
As many stars transition from one stage to another on the H-R diagram they vary in brightness. <strong>The</strong><br />
brightness that a star appears to have (apparent magnitude) from our perspective here on Earth<br />
depends upon its distance from Earth <strong>and</strong> its actual intrinsic brightness, or absolute magnitude<br />
(M V). <strong>The</strong> behavior of stars that vary in magnitude (brightness) can be studied by measuring their<br />
changes in brightness over time <strong>and</strong> plotting the changes on a graph called a light curve. Light<br />
curves are usually plots of apparent magnitude<br />
over time. Historically the time scale has been<br />
the Julian Day (JD), a counting system starting<br />
with January 1, 4713 BC – Julian Day number 1.<br />
Measuring <strong>and</strong> recording the changes in magnitude<br />
<strong>and</strong> plotting the resulting light curves allow astronomers<br />
to determine the period of variation. <strong>The</strong><br />
period is the amount of time it takes for the star<br />
to go through one complete cycle from maximum<br />
magnitude through minimum magnitude <strong>and</strong> back<br />
to maximum magnitude. <strong>The</strong> 2011 General Catalog<br />
of <strong>Variable</strong> <strong>Stars</strong> (GCVS) classifies 43,675 Milky<br />
Way Galaxy stars into several different categories<br />
<strong>and</strong> subcategories of variability.<br />
<strong>The</strong> intrinsic, pulsating variable stars located in<br />
the instability regions of the H-R diagram vary in<br />
© 2012 National Earth Science Teachers Association. All Rights Reserved.
ightness due to physical changes within the interior of the star. <strong>The</strong><br />
pulsations are due to the periodic expansion <strong>and</strong> contraction of the<br />
surface layers of the stars. <strong>The</strong> change in size is observed as a change in<br />
apparent magnitude. <strong>Stars</strong> pulsate because they are not in hydrostatic<br />
equilibrium: the force of gravity acting on the outer mass of the star is<br />
not balanced by the interior radiation pressure directed outwards from<br />
the interior. If a star exp<strong>and</strong>s as a result of increased radiation pressure,<br />
the material density <strong>and</strong> pressure decrease until hydrostatic equilibrium<br />
is reached <strong>and</strong> then overshot, owing to the momentum of the expansion.<br />
At this point the star is transparent <strong>and</strong> photons can escape. <strong>The</strong>n<br />
gravity dominates, <strong>and</strong> the star begins to contract. <strong>The</strong> momentum of<br />
the infalling material carries the contraction beyond the equilibrium<br />
point. <strong>The</strong> star becomes opaque <strong>and</strong> photons are trapped <strong>and</strong> the star<br />
becomes dimmer. <strong>The</strong> pressure again becomes too high, <strong>and</strong> the cycle<br />
starts over again.<br />
© 2012 National Earth Science Teachers Association. All Rights Reserved.<br />
Volume XXVIII, Issue 1<br />
<strong>The</strong> system acts as an oscillator. With loose atmospheric layers of gases,<br />
the oscillations get out of phase with one another <strong>and</strong> set the stage for<br />
chaotic motions. Energy is dissipated during such pulsations (analogous<br />
to losses caused by frictional forces), <strong>and</strong> eventually this loss of energy should result in a damping<br />
or lessening of the pulsations. <strong>The</strong> prevalence <strong>and</strong> regularity of pulsating stars imply that the dissipated<br />
energy is replenished in some way. <strong>The</strong> dynamics of pulsating variable stars is complicated<br />
<strong>and</strong> not well understood.<br />
<strong>The</strong> different types of pulsating variables are distinguished by their periods of pulsation <strong>and</strong> the<br />
shapes of their light curves. <strong>The</strong>se in turn are a function of their mass <strong>and</strong> evolutionary stage.<br />
Cepheids, RR Lyraes, <strong>and</strong> Long Period <strong>Variable</strong>s<br />
(LPVs) – Miras <strong>and</strong> Semiregulars – are pulsating variable<br />
stars <strong>and</strong> occupy regions on the H-R diagram<br />
called instability strips.<br />
Cepheid variable stars exp<strong>and</strong> <strong>and</strong> contract in a<br />
repeating cycle of size changes. <strong>The</strong> change in size<br />
can be observed as a change in apparent brightness<br />
(apparent magnitude.) Cepheids have a repeating<br />
cycle of change that is periodic - as regular as the<br />
beating of a heart, with a period of 1 to 70<br />
days with an amplitude variation of 0.1 to<br />
2.0 magnitudes. <strong>The</strong>se massive stars (~8<br />
solar masses) have a high luminosity <strong>and</strong><br />
are spectral class F at maximum, <strong>and</strong> G to<br />
K at minimum. Cepheids occupy an elongated<br />
horizontal instability strip on the<br />
H-R diagram as massive stars transition<br />
from the main sequence to the giant <strong>and</strong><br />
supergiant branches.<br />
RR Lyrae variables are older pulsating<br />
white giants with low metallicity. <strong>The</strong>y<br />
are common in globular clusters – dense<br />
groups of old stars in the halos of galaxies.<br />
Page 23<br />
Figure 7. <strong>Pulsating</strong> mira variable<br />
star (Chi Cyg)<br />
Image courtesy of SAO/NASA<br />
Figure 8. Cepheid variable star<br />
light curve (Delta Cep)<br />
Image courtesy of AAVSO, Cambridge, MA<br />
Figure 9. RR Lyrae variable star<br />
light curve<br />
Image courtesy of AAVSO, Cambridge, MA
Page 24 <strong>The</strong> Earth Scientist<br />
Figure 10 (left). Mira variable star<br />
light curve (Omicron Ceti)<br />
Image courtesy of AAVSO, Cambridge, MA<br />
Figure 11 (right). Semiregular<br />
variable star light curve (Z Uusae<br />
Majoris)<br />
Image courtesy of AAVSO, Cambridge, MA<br />
Figure 12. H-R diagram with<br />
instability strips labeled<br />
<strong>Diagram</strong> courtesy of Wikimedia Commons<br />
Like Cepheids, their pulsations are periodic. RR Lyraes have ~0.5 solar mass <strong>and</strong> have a short pulsation<br />
period of 0.05 to 1.2 days <strong>and</strong> amplitude variations of 0.3 to 2 magnitudes. RR Lyrae stars are<br />
usually spectral class A. RR Lyrae stars occupy a small instability strip near the intersection of the<br />
main sequence <strong>and</strong> the horizontal giant branch (HB). <strong>The</strong> HB stars have left the red giant branch<br />
<strong>and</strong> are characterized by helium fusion in their cores surrounded by a shell of hydrogen fusion.<br />
Cepheids <strong>and</strong> RR Lyrae variables are periodic <strong>and</strong> there is a relationship between their period <strong>and</strong><br />
luminosity – the period-luminosity relationship. <strong>The</strong> period is calculated from the light curve <strong>and</strong><br />
the associated luminosity is determined. <strong>The</strong> luminosity is then either used directly or converted to<br />
absolute magnitude <strong>and</strong> used with the apparent magnitude in the distance modulus equation to<br />
calculate cosmological distances within the Milky Way Galaxy <strong>and</strong> to other galaxies.<br />
Long Period <strong>Variable</strong>s (LPVs) are pulsating red giants or supergiants with periods ranging from<br />
30-1000 days. <strong>The</strong>y are usually of spectral type M, R, C or N. <strong>The</strong>re are two subclasses; Mira <strong>and</strong><br />
Semiregular.<br />
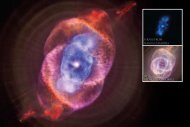
Mira variables are periodic pulsating red giants with a periods of 80 to 1000 days. It is a stage that<br />
most mid-sized main sequence stars transition through as they evolve to the red giant branch.<br />
Miras have amplitude variations of more than 2.5 magnitudes. Mira (Omicron Ceti) is the prototype<br />
of Mira variable stars. <strong>The</strong> Sun will eventually become a pulsating Mira star. <strong>The</strong> Mira instability<br />
strip on the H-R diagram is the region between mid-sized stars on the main sequence <strong>and</strong> the<br />
giant branch.<br />
Semiregular variables are giants <strong>and</strong> supergiants showing periodicity accompanied<br />
by intervals of semiregular or irregular light variation. <strong>The</strong>ir periods<br />
range from 30 to 1000 days, generally with amplitude variations of less than<br />
2.5 magnitudes. Antares (α Scorpius) <strong>and</strong> Betelgeuse (α Orionis) are two prominent<br />
examples of LPV semiregular variable stars. <strong>The</strong>se stars occupy a region<br />
of instability on the H-R diagram similar to the Mira variables.<br />
Plotting Cepheids, RR Lyrae, Mira <strong>and</strong> Semiregular pulsating variable stars<br />
on the H-R diagram is not a single plot like non-pulsating stars. During<br />
their evolution through the instability strips they are pulsationally unstable<br />
– exp<strong>and</strong>ing <strong>and</strong> brightening, then contracting <strong>and</strong> become dimmer. <strong>The</strong><br />
instability strips for Miras <strong>and</strong> Cepheids are especially elongated because<br />
of these expansions <strong>and</strong> contractions. Some pulsating variable stars change<br />
in temperature by two spectral classes during one cycle from maximum to<br />
minimum. To show the entire cycle of change for individual variable stars, it is<br />
necessary to plot them twice on the H-R diagram – both at maximum absolute<br />
© 2012 National Earth Science Teachers Association. All Rights Reserved.
© 2012 National Earth Science Teachers Association. All Rights Reserved.<br />
Volume XXVIII, Issue 1<br />
magnitude (M Vmax) <strong>and</strong> minimum absolute magnitude (Mv min) – along with the corresponding<br />
spectral classes.<br />
<strong>Variable</strong> <strong>Stars</strong> & the H-R <strong>Diagram</strong> Classroom Activities, Materials<br />
<strong>and</strong> Resources<br />
In 1996 a set of curricular materials was written for the American Association of <strong>Variable</strong> Star<br />
Observers (AAVSO) in Cambridge, Massachusetts titled H<strong>and</strong>s-On Astrophysics – <strong>Variable</strong> <strong>Stars</strong> in<br />
Math, Science <strong>and</strong> Computer<br />
Class. <strong>The</strong> materials have<br />
been converted, with the<br />
support of both AAVSO <strong>and</strong><br />
the Ch<strong>and</strong>ra E/PO office, to<br />
an electronic PDF version<br />
<strong>and</strong> renamed <strong>Variable</strong> Star<br />
Astronomy (VSA). <strong>The</strong> materials<br />
are located at http://<br />
www.aavso.org/education/<br />
vsa/. <strong>The</strong> AAVSO <strong>Variable</strong> Star<br />
Astronomy (VSA) educational<br />
project was funded by the<br />
National Science Foundation.<br />
<strong>The</strong> content, activities, investigations<br />
<strong>and</strong> software, based<br />
on the AAVSO’s unique<br />
electronic database of more<br />
than 21,000,000 variable<br />
star observations, provides<br />
students with the necessary information <strong>and</strong> skills to study <strong>and</strong> research variable star behavior.<br />
<strong>The</strong> VSA materials are posted on the AAVSO website, <strong>and</strong> three of the activities <strong>and</strong> investigations,<br />
enhanced with extensions <strong>and</strong> flash versions, have also been posted on the Ch<strong>and</strong>ra website at<br />
http://ch<strong>and</strong>ra.harvard.edu/edu/formal/index.html. Ch<strong>and</strong>ra is designed to observe X-rays from<br />
high-energy regions of the universe – including cataclysmic variables (supernovas, novas), <strong>and</strong> X-ray<br />
binary systems such as the pulsating red giant Mira A <strong>and</strong> its white dwarf companion Mira B.<br />
Plotting <strong>Variable</strong> <strong>Stars</strong> on the H-R <strong>Diagram</strong><br />
Students plot pulsating variable stars on an H-R diagram. <strong>The</strong> diagram<br />
has several bright <strong>and</strong> nearby stars plotted to show the locations of the<br />
main sequence, giant, supergiant <strong>and</strong> dwarf branches. Students plot both<br />
maxima <strong>and</strong> minima with corresponding stellar classifications for several<br />
variables, then identify the type of variability – Cepheid, RR Lyrae, Mira<br />
or Semiregular. <strong>The</strong> investigation includes extensive background information,<br />
student worksheets <strong>and</strong> answer keys in HTML <strong>and</strong> PDF.<br />
Student Activity<br />
http://ch<strong>and</strong>ra.harvard.edu/edu/formal/variable_stars/plot.html<br />
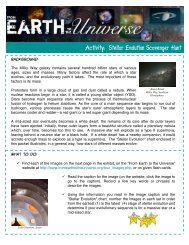
Stellar Heartbeats is an introductory activity designed to familiarize<br />
students with the magnitude scale <strong>and</strong> the Julian Day by estimating the<br />
changing magnitude of a variable star using comparison stars, plotting<br />
Page 25<br />
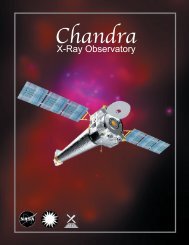
Figure 13. <strong>The</strong> Stellar Evolution: A<br />
Journey with Ch<strong>and</strong>ra Poster<br />
Illustration courtesy of Ch<strong>and</strong>ra<br />
Figure 14. <strong>The</strong> pulsating variable<br />
star Mira the Beautiful (Omicron<br />
Ceti)<br />
Image courtesy of Ch<strong>and</strong>ra
Page 26 <strong>The</strong> Earth Scientist<br />
About the<br />
Author<br />
Donna Young develops<br />
educational materials for<br />
the Ch<strong>and</strong>ra X-ray mission,<br />
<strong>and</strong> is a staff member at<br />
the American Association<br />
of <strong>Variable</strong> Star Observers<br />
in Cambridge, MA. She<br />
is the National Science<br />
Olympiad astronomy<br />
event supervisor. She<br />
presents Ch<strong>and</strong>ra <strong>and</strong><br />
AAVSO educational<br />
materials to formal<br />
<strong>and</strong> informal educators<br />
<strong>and</strong> Science Olympiad<br />
coaches <strong>and</strong> teams at<br />
national workshops <strong>and</strong><br />
conferences. She can be<br />
reached at donna@aavso.<br />
org.<br />
a light curve <strong>and</strong> determining the period. <strong>The</strong>re are HTML, Flash, PDF, <strong>and</strong> PowerPoint versions.<br />
http://ch<strong>and</strong>ra.harvard.edu/edu/formal/variable_stars/activity1a.html<br />
A <strong>Variable</strong> Star in Cygnus uses a set of photos of the variable star W Cyg. By using actual images of W<br />
Cyg students learn how to estimate the changing magnitudes of a variable star with actual comparison<br />
stars against a background of the real sky. Students then plot a light curve <strong>and</strong> determine the<br />
period. <strong>The</strong>re are HTML, Flash, PDF, <strong>and</strong> PowerPoint versions.http://ch<strong>and</strong>ra.harvard.edu/edu/<br />
formal/variable_stars/activity2a.html<br />
Stellar Cycles: A pre or post assessment ac tivity complete with a scoring rubric to determine student<br />
underst<strong>and</strong>ing of stellar evolution. <strong>The</strong> image set for the ac tivity includes images of the different<br />
stages of stellar evolution, light curves <strong>and</strong> H-R diagrams. (HTML, PDF <strong>and</strong> PowerPoint (PPT)<br />
versions) http://ch<strong>and</strong>ra.harvard.edu/edu/formal/stellar_cycle/<br />
NOTE: One, color set of Stellar Life Cycles cards is included with the print version of this journal.<br />
Educators can request additional classroom sets with the Card Sets Request Form at http://<br />
ch<strong>and</strong>ra.harvard.edu/edu/request_special.html<br />
<strong>The</strong> Ch<strong>and</strong>ra Chronicles have two articles describing how the AAVSO amateur observers assisted<br />
the Ch<strong>and</strong>ra X-Ray Observatory during two observing campaigns of the variable star SS Cygni:<br />
Backyard Astronomers Trigger Multi-satellite Observing Campaign on SS Cygni http://<br />
ch<strong>and</strong>ra.harvard.edu/chronicle/0101/aavso.html<br />
Astronomers Team Up for Ch<strong>and</strong>ra Observations of SS Cygni http://ch<strong>and</strong>ra.harvard.edu/<br />
chronicle/0300/aavso.html<br />
Are you looking for some quality<br />
mineral or fossil specimens<br />
for your classes? Or maybe for you?<br />
Check out the assortment of<br />
minerals <strong>and</strong> fossil specimens<br />
available on our Online Store<br />
from Nature’s Own!<br />
Classroom specimens <strong>and</strong> collections,<br />
jewelry, <strong>and</strong> household items available!<br />
Visit our online store at<br />
www.windows2universe.org/store,<br />
<strong>and</strong> click on “Nature’s Own”<br />
Windows to the Universe members get a 10% discount!<br />
© 2012 National Earth Science Teachers Association. All Rights Reserved.