Workers' Compensation Reinsurance Association - Minnesota State ...
Workers' Compensation Reinsurance Association - Minnesota State ...
Workers' Compensation Reinsurance Association - Minnesota State ...
You also want an ePaper? Increase the reach of your titles
YUMPU automatically turns print PDFs into web optimized ePapers that Google loves.
This document is made available electronically by the <strong>Minnesota</strong> Legislative Reference Library<br />
as part of an ongoing digital archiving project. http://www.leg.state.mn.us/lrl/lrl.asp<br />
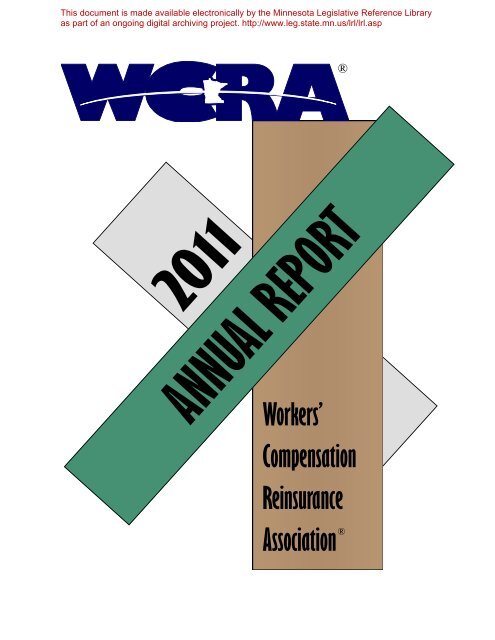
2011<br />
ANNUAL REPORT<br />
Workers’<br />
®<br />
<strong>Compensation</strong><br />
<strong>Reinsurance</strong><br />
<strong>Association</strong> ®
To Our Members<br />
The WCRA’s financial recovery continued in 2011.<br />
The <strong>Association</strong>’s 2010 year-end deficit of<br />
$59 million was reduced to $8 million as of<br />
December 31, 2011. Over the last three years, we<br />
have reduced our balance sheet deficit by<br />
$416 million. Three factors have contributed to our<br />
financial improvement: excellent investment returns,<br />
assessments, and reductions in loss reserves.<br />
Investments: While the <strong>Association</strong>’s investment<br />
portfolio earned a disappointing 1 percent return in<br />
2011, the annualized return for the last three years<br />
has been 14 percent. Our discount rate and annual<br />
assumed rate of return is 7 percent, so investment<br />
returns above that percentage improve the<br />
<strong>Association</strong>’s capital position. Since the cataclysmic<br />
market declines of 2008, our superior investment<br />
returns have contributed $169 million toward the<br />
reduction of our balance sheet deficit.<br />
Assessments: The Surplus Distribution Recovery<br />
Program (Program) of assessments was approved in<br />
2009 for the specific purpose of eliminating the<br />
<strong>Association</strong>’s deficit and rebuilding our capital base.<br />
It is doing so by recovering a portion of the<br />
$1.2 billion the WCRA previously distributed to<br />
members and workers’ compensation policyholders.<br />
Since the Program was approved, assessments have<br />
contributed $137 million toward reducing our deficit.<br />
Loss Reserve Reductions: Our actuaries are charged<br />
with projecting what our long-term claim liabilities will<br />
be decades into the future. Based on careful<br />
economic analysis and the recommendations of the<br />
WCRA Actuarial Committee, the Board of Directors<br />
establishes parameters for the work of the actuaries by<br />
regularly reviewing and adopting economic<br />
assumptions. For example, the discount rate is set at<br />
7 percent; the general inflation rate assumption is<br />
2.8 percent; and the medical escalation rate is<br />
7.5 percent. Variations from these assumptions can<br />
have a significant impact on our loss reserve<br />
requirements, which in turn can substantially affect<br />
our capital position. In recent years, medical costs<br />
have trended lower than our 7.5 percent medical<br />
escalation rate assumption, which has in turn reduced<br />
our reserve requirements. As a result, over the last<br />
three years, the Board has approved a reduction of<br />
$122 million in loss reserves, which produced a<br />
corresponding reduction in our deficit.<br />
Looking ahead, the Board of Directors has approved<br />
the continuation of the Program in 2012, which is<br />
expected to add $54 million to capital for the year.<br />
The Board will decide whether to continue the<br />
Program in 2013 and 2014 based on the<br />
<strong>Association</strong>’s future financial condition. Any<br />
investment returns that exceed the 7 percent assumed<br />
rate will also add to capital. Further, if reserve<br />
requirements continue to trend lower, any additional<br />
reserve reductions approved by the Board would also<br />
improve the WCRA’s capital position.<br />
During the process of considering the Program in<br />
2009, our members, as well as the Commissioner of<br />
Commerce, clearly indicated that the WCRA should<br />
build a strong enough capital base to withstand future<br />
financial shocks and avoid future assessments. The<br />
Board of Directors agrees and will continue to focus<br />
on strengthening the <strong>Association</strong>’s financial position.<br />
In addition, the annual premiums members will have<br />
to pay for the WCRA’s statutory unfunded liabilities<br />
are expected to dramatically accelerate in the coming<br />
years. If our capital position permits, the <strong>Association</strong><br />
intends to explore with its members, regulators, and<br />
the Legislature the possible elimination of the<br />
prefunded limit. Such an action would likely result in<br />
significant long-term benefit for WCRA members.<br />
During 2012, the <strong>Association</strong> will continue the<br />
process of upgrading its information systems. More<br />
tools will be developed to better enable WCRA<br />
members to manage their WCRA claims and premium<br />
transactions. For self-insurer members, new reference<br />
materials and tools will be developed to assist them<br />
with basic exposure-related reporting requirements.<br />
In addition, a new, more user-friendly website with<br />
increased content is expected to be in place by<br />
midyear.<br />
We look forward to working with all of our members<br />
into the future, and encourage you to contact us with<br />
any suggestions you have as to how we can better serve<br />
you.<br />
Carl W. Cummins III<br />
President and CEO<br />
Stuart C. Henderson<br />
Board Chair<br />
1
2<br />
Overview<br />
The WCRA experienced a third consecutive year of financial improvement in 2011. At<br />
December 31, 2011, the balance sheet deficit was $8 million, an improvement of $51 million<br />
from the December 31, 2010 deficit of $59 million. This continued financial improvement<br />
was due to a reduction in prior accident year funded loss reserves and the continuation of the<br />
Surplus Distribution Recovery Program of assessments approved in 2009. Prior accident year<br />
funded loss reserves were reduced by $100 million due primarily to favorable development on<br />
case reserves. In addition, the WCRA recorded a contribution to capital of $54 million from<br />
the assessment program.<br />
The WCRA’s cash flow from operating activities was $5 million in 2011, up from $4 million<br />
in 2010. This increase was due mainly to an increase in dividends from investments. The<br />
WCRA continues to have substantial liquidity and met all of its financial obligations on a timely<br />
basis in 2011.<br />
Operating Results and Comprehensive (Loss) Income<br />
PREMIUMS AND LOSSES<br />
2011 Financial Results<br />
Management’s Summary Analysis<br />
The WCRA earned $49 million in funded premiums in 2011, down from $50 million in<br />
2010. This decrease was due to a reduction in exposure base.<br />
Funded losses and loss expenses incurred for 2011 were $59 million, down significantly from<br />
$133 million in 2010. This decrease was due to actuarial adjustments of prior accident year<br />
losses. Prior accident year loss reserves were reduced by $100 million in 2011 compared to a<br />
reduction of $20 million in 2010. The reduction in prior accident year reserves in 2011 was<br />
due primarily to favorable development on case reserves which resulted in lower projected<br />
ultimate losses.<br />
The components of discounted funded losses and loss expenses are shown below.<br />
($ millions) 2011 2010<br />
Prior accident years:<br />
Present value update $108 $103<br />
Actuarial adjustments (100) (20)<br />
Total prior accident years 8 83<br />
Current accident year 51 50<br />
Total funded losses and loss expenses incurred $ 59 $133<br />
`
INVESTMENT PERFORMANCE<br />
For the year ended December 31, 2011, the investment portfolio returned 1 percent<br />
compared to a return of 13 percent in 2010. In both 2011 and 2010, the WCRA’s assumed<br />
rate of investment return was 7 percent. The decrease in 2011 investment return was due<br />
primarily to poor performance in the international and domestic equity markets. In 2011, the<br />
WCRA’s international equities lost 13 percent and US equities returned only 1 percent. In<br />
2010, the WCRA’s international equities returned 11 percent and domestic equities returned<br />
17 percent.<br />
The components of investment results are shown below.<br />
In 2011 and 2010, the WCRA Investment Policy included asset allocation targets of<br />
40 percent for domestic equities, 20 percent for international equities, and 40 percent for fixed<br />
income investments.<br />
COMPREHENSIVE (LOSS) INCOME<br />
The WCRA recorded a comprehensive loss of $3 million in 2011, compared to comprehensive<br />
income of $92 million in 2010. Comprehensive income consists of net income and the change<br />
in unrealized gains (losses) on investments, the impact of foreign currency translation<br />
adjustments on securities denominated in a currency other than U.S. dollars, and the change in<br />
the funded status of the defined benefit pension plan. In 2011, the comprehensive loss was due<br />
primarily to unrealized losses on investments. In 2010, the comprehensive income was due<br />
mainly to strong investment performance, including realized investment gains of $102 million.<br />
Balance Sheet<br />
($ millions) 2011 2010<br />
Investment income, net of related expenses $ 30 $ 27<br />
Net realized investment gains 7 102<br />
Change in unrealized (losses) gains on securities (28) 49<br />
Total investment results $ 9 $178<br />
ASSETS AND LIABILITIES<br />
Total assets were $1,854 million at December 31, 2011 compared with $1,923 million at the<br />
end of 2010. The decrease in total assets was due primarily to a decrease in invested assets.<br />
Total liabilities were $1,862 million at December 31, 2011 compared with liabilities of<br />
$1,982 million at December 31, 2010. The decrease in liabilities was due mainly to a<br />
decrease in the amount due to securities brokers for unsettled securities transactions and a<br />
decrease in the liabilities for losses and loss expenses.<br />
3
4<br />
The WCRA’s largest liability is the reserve for funded losses and loss expenses. This liability<br />
totaled $1,554 million at December 31, 2011 compared with $1,571 million at<br />
December 31, 2010. This liability represents the present value, discounted at 7 percent, of the<br />
total estimated obligation for losses and loss expenses for unpaid amounts up to the prefunded<br />
limit. Because this liability involves claims that will be paid out over a period of many years,<br />
judgments as to the ultimate exposure are an important component of the loss reserving process.<br />
Reserves are reviewed on a regular basis using a variety of actuarial techniques. They are<br />
adjusted based on loss experience and as new information becomes available.<br />
Changes in the discounted liability for funded losses and loss expenses are shown below.<br />
The components of prior accident year incurred losses and loss expenses are discussed above<br />
under “Operating Results and Comprehensive (Loss) Income.”<br />
The liability for unfunded losses and loss expenses totaled $167 million at December 31, 2011<br />
compared to $195 million at December 31, 2010. This liability represents the present value,<br />
discounted at 7 percent, of the total estimated obligation for losses and loss expenses for unpaid<br />
amounts in excess of the prefunded limit. The $28 million decrease in this liability in 2011 was<br />
due to a $42 million reduction in prior accident year loss reserves. This prior-year impact was<br />
due to favorable case reserve development. In 2010, the increase in this liability was driven by<br />
the present value update and reserves for the current accident year. Unfunded deferred<br />
premium revenue of negative $26 million was recognized in 2011, concurrent with incurred<br />
unfunded losses and loss expenses of negative $26 million. Loss payments in excess of<br />
prefunded limits totaled $1.8 million and $1.6 million in 2011 and 2010, respectively.<br />
DEFICIT<br />
($ millions) 2011 2010<br />
Funded reserves as of January 1 $1,571 $1,512<br />
Losses and loss expenses incurred:<br />
Prior accident years $ 8 $ 83<br />
Current accident year 51 50<br />
Total incurred 59 133<br />
Losses and loss expenses paid (76) (74)<br />
Funded reserves as of December 31 $1,554 $1,571<br />
At December 31, 2011, the WCRA had an accumulated balance sheet deficit of $8 million, an<br />
improvement of $51 million from the December 31, 2010 deficit of $59 million. This<br />
improvement was primarily due to a reduction in prior accident year funded loss reserves and<br />
the continuation of the assessment program. Prior accident year funded loss reserves were<br />
reduced by $100 million due primarily to favorable development on case reserves. In addition,<br />
the WCRA recorded a contribution to capital of $54 million from the assessment program.
In 2009, the Board of Directors adopted the Surplus Distribution Recovery Program, which<br />
declared deficient premium assessments of $178 million to members and deficiency assessments<br />
of $90 million to self-insurer members and workers’ compensation policyholders. The deficient<br />
premium assessments are payable in five equal annual installments. In both 2011 and 2010, the<br />
WCRA recorded an installment of $36 million of the deficient premium assessments as a<br />
contribution to capital. The deficient premium assessments are being recorded on an installment<br />
basis due to reasonable uncertainty regarding continuation of the assessments over the full five<br />
years. The deficiency assessments are prospective in nature, and are being determined on a yearto-year<br />
basis over the five-year period, 2010 through 2014. Deficiency assessments of<br />
$18 million and $12 million were recorded as a contribution to capital in 2011 and 2010,<br />
respectively.<br />
Cash Flow and Liquidity<br />
The WCRA’s cash flow from operating activities was $5 million in 2011, up from $4 million in<br />
2010. This increase was due primarily to an increase in dividends from investments. The<br />
WCRA continues to have substantial liquidity and met all of its financial obligations on a timely<br />
basis in 2011. In addition, the WCRA has a marketable investment portfolio that can provide<br />
significant liquidity. Management believes the WCRA has the liquidity necessary to continue to<br />
meet its financial obligations on a timely basis for the foreseeable future.<br />
OUR MISSION<br />
The WCRA ensures the availability of<br />
long-term reinsurance protection for<br />
serious <strong>Minnesota</strong> workers’ compensation<br />
claims. Our staff of innovative professionals<br />
is dedicated to achieving the highest<br />
standard of excellence through stable<br />
and reasonable rates, expert claims<br />
administration, and informational services.<br />
OUR VISION<br />
The WCRA will<br />
provide reinsurance<br />
services that are<br />
considered superior<br />
by its members and<br />
other participants<br />
in the workers’<br />
compensation system.<br />
5
6<br />
Board of Directors<br />
Chair<br />
Vice Chair<br />
Stuart Henderson<br />
Western National<br />
Insurance Group<br />
Robert Lund<br />
SFM<br />
Brian Melas<br />
Liberty Mutual<br />
Insurance Group<br />
David Hennes<br />
The Toro Company<br />
Sharyle Knutson<br />
<strong>Minnesota</strong> AFL-CIO<br />
Edward Reynoso<br />
Teamsters Joint<br />
Council 32 DRIVE<br />
Michael Thoma<br />
The Travelers<br />
Companies, Inc.<br />
Gary Nelson<br />
Medtronic, Inc.<br />
Wayne Simoneau<br />
Public Representative<br />
Howard Bicker<br />
<strong>Minnesota</strong> <strong>State</strong> Board of Investment<br />
Kristin Hanson<br />
<strong>Minnesota</strong> Management and Budget<br />
Michele Spencer<br />
Ecumen<br />
Allison Waggoner<br />
DCI, Inc.
Carl (Buzz) Cummins<br />
President and CEO<br />
Donald Swanson<br />
Vice President<br />
Senior Management<br />
James Heer<br />
Actuarial Vice President<br />
Elisabeth Skoglund<br />
Vice President<br />
Claims and Information Systems<br />
Cynthia Smith<br />
Vice President<br />
Finance and Investments<br />
Operations<br />
Treasurer Secretary<br />
ACTUARIAL<br />
Daniel Lovhaug, Actuarial Assistant<br />
Tony Tio, Actuary<br />
CLAIMS<br />
Staff<br />
Ann Dominik, <strong>Reinsurance</strong> Claims Specialist<br />
Mary Fraser, Administrative Assistant<br />
Dawn Gagnelius, <strong>Reinsurance</strong> Claims Examiner<br />
Natalie Haefner, Catastrophic Nurse Consultant<br />
Thor Haugen, <strong>Reinsurance</strong> Claims Specialist<br />
Gregory Jeans, Claims Account Manager<br />
Julie Olson, Claims Account Manager<br />
Sherry Staffa, <strong>Reinsurance</strong> Claims Specialist<br />
FINANCE<br />
Eva McClellan, Administrative Assistant<br />
Lori Thompson, Corporate Controller<br />
OPERATIONS<br />
Jodi Elleraas, Administrative Support<br />
Jeanne Mann, Administrative Assistant<br />
Dorraine Sullivan, Administrative Assistant<br />
INFORMATION SYSTEMS<br />
Christian King, Manager – Information Systems<br />
Thomas Reynen, Programmer<br />
Annie Whitney, Network Administrator<br />
PREMIUM AUDIT<br />
David Jerden, Premium Field Auditor<br />
Karen Newcom, Administrative Assistant<br />
James Sanem, Senior Premium Audit Specialist<br />
7
Workers’ <strong>Compensation</strong><br />
<strong>Reinsurance</strong> <strong>Association</strong><br />
Financial <strong>State</strong>ments<br />
December 31, 2011 and 2010<br />
8
To the Board of Directors and Members of<br />
Workers’ <strong>Compensation</strong> <strong>Reinsurance</strong> <strong>Association</strong><br />
In our opinion, the accompanying balance sheets and the related statements of operations,<br />
comprehensive income and accumulated deficit and of cash flows present fairly, in all material respects,<br />
the financial position of the Workers’ <strong>Compensation</strong> <strong>Reinsurance</strong> <strong>Association</strong> (the “<strong>Association</strong>”) at<br />
December 31, 2011 and 2010, and the results of its operations and its cash flows for the years then ended<br />
in conformity with accounting principles generally accepted in the United <strong>State</strong>s of America. These<br />
financial statements are the responsibility of the <strong>Association</strong>’s management. Our responsibility is to<br />
express an opinion on these financi financial al statements based on our audits. We conducted our audits of these<br />
statements in accordance with auditing standards generally accepted in the United <strong>State</strong>s of America.<br />
Those standards require that we plan and perform the audit to obtain reasonable assur assurance assur about<br />
whether the financial statements are free of material misstatement. An audit includes examining, on a test<br />
basis, evidence supporting the amounts and disclosures in the financial statements, assessing the<br />
accounting principles used and signific significant ant estimates made by management, and evaluating the overall<br />
financial statement presentation. We believe that our audits provide a reasonable basis for our opinion.<br />
February 29, 2012<br />
Report of Independent Auditors<br />
PricewaterhouseCoopers LLP, Suite 1400, 225 South Sixth Street, Minneapolis, MN 555402<br />
5402<br />
T: (612) 596 6000, F: (612) 373 7160, www.pwc.com/us<br />
9
Workers’ <strong>Compensation</strong> <strong>Reinsurance</strong> <strong>Association</strong><br />
Balance Sheets<br />
December 31, 2011 and 2010<br />
(in thousands of dollars)<br />
Assets<br />
Investments, at fair value<br />
Cash and cash equivalents $ 21,638 $ 59,884<br />
Short-term 4,300 46,841<br />
Common and preferred stock 918,503 978,250<br />
Bonds 672,390 581,350<br />
Total investments 1,616,831 1,666,325<br />
Uncollected reinsurance premiums<br />
Deferred for unfunded losses 168,229 194,726<br />
Total uncollected reinsurance premiums 168,229 194,726<br />
Assessments receivable 10,694 11,874<br />
Accrued investment income 5,689 4,598<br />
Due from securities brokers 51,688 45,326<br />
Prepaid expenses and other assets 365 421<br />
Property and equipment, less accumulated depreciation of $607<br />
and $708 at December 31, 2011 and 2010, respectively 271 116<br />
Total assets $ 1,853,767 $ 1,923,386<br />
Liabilities and Accumulated Deficit<br />
Liabilities<br />
Losses and loss expenses<br />
Funded $ 1,553,694 $ 1,571,289<br />
Unfunded 167,334 195,350<br />
Total losses and loss expenses 1,721,028 1,766,639<br />
Deferred assessments 46,411 67,004<br />
Due to securities brokers 92,155 147,297<br />
Accounts payable and other liabilities 2,569 1,528<br />
Total liabilities 1,862,163 1,982,468<br />
Accumulated deficit from operations (178,298) (257,443)<br />
Accumulated other comprehensive income 169,902 198,361<br />
Designated accumulated deficit (8,396) (59,082)<br />
Total liabilities and accumulated deficit $ 1,853,767 $ 1,923,386<br />
The accompanying notes are an integral part of these financial statements.<br />
10<br />
2011 2010
Workers’ <strong>Compensation</strong> <strong>Reinsurance</strong> <strong>Association</strong><br />
<strong>State</strong>ments of Operations, Comprehensive (Loss) Income and<br />
Accumulated Deficit<br />
Years Ended December 31, 2011 and 2010<br />
(in thousands of dollars)<br />
Revenues<br />
<strong>Reinsurance</strong> premiums<br />
Funded earned $ 49,125 $ 49,709<br />
Unfunded deferred (26,205) 16,973<br />
Investment income, net of related expenses 30,343 26,508<br />
Realized investment gains (losses)<br />
Net realized investment gains 26,650 106,162<br />
Net realized impairment (losses) (19,964) (4,596)<br />
Total revenues 59,949 194,756<br />
Expenses<br />
Losses and loss expenses<br />
Funded 58,559 133,302<br />
Unfunded (26,205) 16,973<br />
Losses and loss expenses incurred 32,354 150,275<br />
Operating and administrative expenses 2,058 1,978<br />
Total expenses 34,412 152,253<br />
Net income 25,537 42,503<br />
Other comprehensive (loss) income<br />
Change in net unrealized (losses) gains on securities and foreign<br />
currency translation adjustment (28,459) 49,441<br />
Comprehensive (loss) income (2,922) 91,944<br />
Assessments 53,608 47,552<br />
Accumulated deficit, beginning of year (59,082) (198,578)<br />
Accumulated deficit, end of year $ (8,396) $ (59,082)<br />
The accompanying notes are an integral part of these financial statements.<br />
11<br />
2011 2010
Workers’ <strong>Compensation</strong> <strong>Reinsurance</strong> <strong>Association</strong><br />
<strong>State</strong>ments of Cash Flows<br />
Years Ended December 31, 2011 and 2010<br />
(in thousands of dollars)<br />
Cash flows from operating activities<br />
Net premiums collected $ 49,416 $ 51,597<br />
Interest and dividends received, net of related expenses 35,161 29,781<br />
Losses and loss expenses paid (77,965) (75,497)<br />
Operating and administrative expenses paid (1,753) (1,953)<br />
Net cash provided by operating activities 4,859 3,928<br />
Cash flows from investing activities<br />
Sale and maturities of investments<br />
Short-term, net 42,541 -<br />
Common and preferred stocks 557,576 1,126,658<br />
Bonds 3,335,116 2,327,111<br />
Purchase of investments<br />
Short-term, net - (45,184)<br />
Common and preferred stocks (548,119) (1,168,990)<br />
Bonds (3,459,396) (2,285,737)<br />
Purchase of equipment (231) (77)<br />
Net cash used in investing activities (72,513) (46,219)<br />
Cash flows from financing activities<br />
Assessments 29,408 46,214<br />
Net cash provided by financing activities 29,408 46,214<br />
Net (decrease) increase in cash and cash equivalents (38,246) 3,923<br />
Cash and cash equivalents<br />
Beginning of year 59,884 55,961<br />
End of year $ 21,638 $ 59,884<br />
The accompanying notes are an integral part of these financial statements.<br />
12<br />
2011 2010
Workers’ <strong>Compensation</strong> <strong>Reinsurance</strong> <strong>Association</strong><br />
Notes to Financial <strong>State</strong>ments<br />
December 31, 2011 and 2010<br />
1. General Information<br />
Description of <strong>Association</strong><br />
In 1979, the <strong>Minnesota</strong> Legislature created the Workers’ <strong>Compensation</strong> <strong>Reinsurance</strong> <strong>Association</strong><br />
(the “<strong>Association</strong>”), a nonprofit, unincorporated association, to provide reinsurance protection for<br />
serious workers’ compensation losses to all primary workers’ compensation insurance providers<br />
and self-insured employers in the state of <strong>Minnesota</strong>. The <strong>Association</strong> provides full indemnification<br />
to its members for workers’ compensation losses paid in accordance with <strong>Minnesota</strong> Statutes<br />
Chapter 176 that exceed a member’s retention limit.<br />
Operating procedures are prescribed by <strong>Minnesota</strong> Statutes Section 79.34-79.40, as amended (the<br />
“Enabling Act”), and the <strong>Association</strong>’s Plan of Operation (the “Plan”). Amendments to the Plan<br />
must be approved by the Board of Directors of the <strong>Association</strong> (the “Board”) and the <strong>Minnesota</strong><br />
Commissioner of Labor and Industry.<br />
Membership<br />
All insurance carriers authorized to underwrite workers’ compensation risks in <strong>Minnesota</strong> and all<br />
employers, including political sub-divisions, authorized to self-insure their workers’ compensation<br />
liabilities in <strong>Minnesota</strong> are required to be members of the <strong>Association</strong>.<br />
Retention Limits<br />
For 2011 and 2010, members selected one of three maximum per-loss occurrence retention limits,<br />
which were $450,000, $900,000 or $1,800,000. Retention limits are determined annually based on<br />
a formula prescribed in the Enabling Act. <strong>Minnesota</strong> workers’ compensation losses incurred by<br />
members in excess of the retention limit selected are reinsured by the <strong>Association</strong>.<br />
Premiums<br />
The estimated aggregate annual reinsurance premium billed by the <strong>Association</strong> to members in<br />
each calendar year is calculated to cover the following estimated costs:<br />
The present value of the estimated ultimate liability for members’ incurred losses above the<br />
selected retention limit up to and including the prefunded limit of $9.0 million per occurrence for<br />
2011 and 2010, for funded losses reinsured by the <strong>Association</strong>.<br />
Loss payments expected to be made to members for claim amounts in excess of prefunded<br />
limits (unfunded losses).<br />
Operating and administrative expenses of the <strong>Association</strong>, and loss expenses incurred by the<br />
<strong>Association</strong>. (Loss expenses incurred by members on reinsured claims are not recoverable<br />
from the <strong>Association</strong>.)<br />
Charges for the current year or a prior year, as determined by the Board, for any reinsurance<br />
coverage purchased by the <strong>Association</strong>.<br />
Adjustments due to excess or deficient funded premiums, if any, for prior years as determined<br />
by the Board.<br />
Estimated reinsurance premiums for each year are billed to the individual members based on:<br />
(1) the funded rate for the member’s selected retention limit; (2) the rate for expected unfunded<br />
payments; and (3) the member’s most recent actual exposure base available at the beginning of<br />
the annual billing cycle, adjusted for a factor which represents the estimated difference between<br />
13
Workers’ <strong>Compensation</strong> <strong>Reinsurance</strong> <strong>Association</strong><br />
Notes to Financial <strong>State</strong>ments<br />
December 31, 2011 and 2010<br />
the member’s most recent actual exposure base and the actuarially projected exposure base. In<br />
the following year, reinsurance premium adjustments to bring the estimated premiums to actual are<br />
calculated and billed or credited to members.<br />
For insurer members, the exposure base is the earned premium at the WCRA standard earned<br />
premium reporting level reported in the WCRA Annual Financial Call multiplied by 1.20.<br />
Experience rating modifications of the insurers’ individual insured are reflected in the Annual Call<br />
data.<br />
For self-insurer members, the exposure base is calculated from <strong>Minnesota</strong>’s covered payroll,<br />
multiplied by pure premium base rates as published by the MWCIA, multiplied by 1.20, multiplied<br />
by an experience rating modification factor.<br />
2. Summary of Significant Accounting Policies<br />
Use of Estimates<br />
The preparation of financial statements in conformity with accounting principles generally accepted<br />
in the United <strong>State</strong>s of America requires management to make estimates and assumptions that<br />
affect the reported amounts of assets and liabilities and disclosure of contingent assets and<br />
liabilities at the date of the financial statements and the reported amounts of revenues and<br />
expenses during the reporting periods. Actual results could differ from those estimates.<br />
Risks and Uncertainties<br />
The <strong>Association</strong> invests in stocks and bonds of U.S. and foreign companies, U.S. government<br />
securities, and mortgage-backed securities. The investment viability and return of funds is<br />
dependent on, among other factors, the financial results of the underlying issuers. Due to the level<br />
of risk associated with certain investments, it is reasonably possible that changes in the values will<br />
occur in the near term and that such changes could materially affect future financial statements.<br />
The process of estimating the liability for losses and loss expenses, by its very nature, involves<br />
substantial uncertainty. The level of uncertainty is influenced by factors such as the economic<br />
assumptions associated with workers’ compensation reinsurance. Ultimate actual payments for<br />
losses and loss expenses could be significantly different from the estimates.<br />
The <strong>Association</strong> holds cash on deposit balances throughout the fiscal year that exceed the FDIC<br />
insurable limits for banking institutions.<br />
Comprehensive Income<br />
The <strong>Association</strong> follows the reporting concept of “Comprehensive Income” which requires the<br />
reporting of comprehensive income in addition to net income from operations. Comprehensive<br />
income is a more inclusive financial reporting methodology that includes disclosure of certain<br />
financial information that historically has not been recognized in the calculation of net income.<br />
Comprehensive income for the <strong>Association</strong> includes net income and other comprehensive income,<br />
which includes unrealized gains and losses on available-for-sale securities, the impact of foreign<br />
currency translation adjustments on securities denominated in a currency other than U.S. dollars,<br />
and the change in the funded status of the defined benefit pension plan.<br />
14
Workers’ <strong>Compensation</strong> <strong>Reinsurance</strong> <strong>Association</strong><br />
Notes to Financial <strong>State</strong>ments<br />
December 31, 2011 and 2010<br />
Cash Equivalents<br />
Cash on deposit, shares in money market funds, and short-term debt securities with original<br />
maturities of three months or less are classified as cash equivalents.<br />
Short-Term<br />
Debt securities with original maturities greater than three months and less than one year are<br />
classified as short term. Amortized cost approximates market value.<br />
Investments<br />
The <strong>Association</strong> has classified its investments as “available for sale” and carries such securities at<br />
fair value. Accordingly, the net unrealized gains or losses are included in other comprehensive<br />
income as a separate component of capital. In determining the realized gain or loss on sales of<br />
investments, cost is based on the average cost method. Interest income is recognized when<br />
earned. Dividend income is recognized on the ex-dividend date.<br />
Purchased premiums and discounts are amortized or accreted using the effective interest rate<br />
method over the terms of the respective issues.<br />
When a decline in value of an investment is determined to be other-than-temporary, the specific<br />
investment is carried at estimated fair value, and its original book value is reduced to reflect this<br />
impairment. Such reductions in book value are recognized in the period in which they were written<br />
down as either realized investment losses or as a component of other comprehensive income. See<br />
also “New Accounting Pronouncements” in Note 2.<br />
Effective January 1, 2008, the <strong>Association</strong> adopted Accounting Standards Codification<br />
(“ASC”) 820. This Standard defines fair value, establishes a framework for measuring fair value,<br />
and expands disclosures about fair value measurements. It describes three levels of inputs that<br />
may be used to measure fair value:<br />
Level 1: Quoted prices in active markets for identical assets or liabilities that the reporting entity<br />
has the ability to access at the measurement date.<br />
Level 2: Observable inputs other than quoted prices included within Level 1 that are observable<br />
for the asset or liability either directly or indirectly.<br />
Level 3: Unobservable inputs that are supported by little or no market activity and that are<br />
significant to the fair value of the assets or liabilities.<br />
Property and Equipment<br />
Property and equipment are stated at cost. Depreciation on property and equipment is calculated<br />
on the straight-line method over the estimated useful lives of the assets. Upon sale or retirement of<br />
property and equipment, the cost and related accumulated depreciation are removed from the<br />
accounts and any resulting gain or loss is credited or charged to operations.<br />
15
Workers’ <strong>Compensation</strong> <strong>Reinsurance</strong> <strong>Association</strong><br />
Notes to Financial <strong>State</strong>ments<br />
December 31, 2011 and 2010<br />
Determination of Required Capital<br />
After the close of each fiscal year or at such other times that it deems appropriate, the Board<br />
reports whether capital or a deficit exists based on the annual audited year-end financial<br />
statements. In determining whether or not to declare an excess surplus distribution or a deficiency<br />
assessment, the Board evaluates the capital or deficit relative to the reserves for discounted<br />
funded losses and loss expenses. The Board has determined that up to 60% of the liability for<br />
funded losses and loss expenses should be retained and reflected on the balance sheet as<br />
required capital. Required capital is needed to maintain sufficient assets to provide for variations<br />
between expected and actual investment returns, variations between expected and actual claims<br />
experience, and other unexpected financial developments. The Board may consider a deficiency<br />
assessment if the designated accumulated deficit exceeds 10% of the liability for funded losses<br />
and loss expenses.<br />
The Board may declare an excess surplus distribution or an assessment if no such distribution or<br />
assessment has been declared in the preceding four years, provided that distributions or<br />
assessments may be declared more or less frequently than every five years if the Board, at its sole<br />
discretion, determines that it is necessary and prudent to do so. Excess surplus distributions or<br />
assessments may be declared by the Board and distributed to or collected from members or<br />
policyholders pursuant to the provisions of The Enabling Act and applicable provisions of the Plan.<br />
In 2009, the Board declared deficient premium assessments and deficiency assessments. See<br />
also Note 9.<br />
<strong>Reinsurance</strong> Premiums<br />
Funded earned reinsurance premiums are for the calendar year coverage period for funded losses<br />
(losses up to and including the prefunded limit). These premiums are billed in the current period.<br />
The reinsurance premiums for the calendar year may also include a credit or charge to equitably<br />
distribute excess or deficient premiums for previous periods, including any excess or deficient<br />
premiums resulting from a retroactive change in the prefunded limit.<br />
Unfunded deferred reinsurance premiums are to be billed in future years for unfunded losses (loss<br />
amounts in excess of the prefunded limit) incurred during the calendar year coverage period and<br />
are recognized as earned revenue concurrent with the related unfunded losses and loss expenses.<br />
<strong>Reinsurance</strong> premiums for unfunded losses are billed to the members of the <strong>Association</strong> in the<br />
calendar year when payments in excess of prefunded limits are expected to be reimbursed by the<br />
<strong>Association</strong>. The <strong>Association</strong> began billing for losses in the unfunded layer in 2003. Premiums of<br />
$0.3 million and $1.9 million were billed in 2011 and 2010, respectively.<br />
Losses and Loss Expenses<br />
The liability for funded losses and loss expenses represents the present value, discounted using<br />
7% (this is the <strong>Association</strong>'s expected long term return on investments), of the estimated liability for<br />
losses and loss expenses of the <strong>Association</strong> for unpaid amounts up to and including the prefunded<br />
limit, as determined by actuarial projections using historical pricing model simulations and the<br />
payment and case reserve experience of the <strong>Association</strong>.<br />
The liability for unfunded losses and loss expenses represents the present value, discounted using<br />
7%, of the estimated liability for losses and loss expenses of the <strong>Association</strong> for unpaid amounts in<br />
excess of the prefunded limit, as determined by actuarial projections of the <strong>Association</strong>.<br />
The selection of the discount rate is based on a very long-term investment horizon, corresponding<br />
to the nature of the <strong>Association</strong>’s funded and unfunded losses and loss expenses liabilities.<br />
16
Workers’ <strong>Compensation</strong> <strong>Reinsurance</strong> <strong>Association</strong><br />
Notes to Financial <strong>State</strong>ments<br />
December 31, 2011 and 2010<br />
Subsequent Events<br />
The <strong>Association</strong> has evaluated events that have occurred subsequent to December 31, 2011,<br />
through February 29, 2012.<br />
New Accounting Pronouncements<br />
Effective January 1, 2010, the <strong>Association</strong> adopted FASB amended guidance on "Fair Value<br />
Measurements and Disclosures" which was intended to improve disclosures about fair value<br />
measurements by increasing transparency in financial reporting. The guidance provides for a<br />
greater level of disaggregated information and expanded disclosures of valuation techniques and<br />
inputs to fair value measurements. The adoption of this guidance had no impact on our financial<br />
condition and results of operations but resulted in additional disclosures.<br />
In June 2011, the FASB issued ASU No. 2011-05, “Comprehensive Income (Topic 220):<br />
Presentation of Comprehensive Income.” ASU No. 2011-05 eliminates the option to present the<br />
components of other comprehensive income as part of the statement of accumulated deficit. It<br />
requires an entity to present the total of comprehensive income, the components of net income,<br />
and the components of other comprehensive income either in a single continuous statement of<br />
comprehensive income or in two separate but consecutive statements.<br />
Regardless of whether one or two statements are presented, an entity is required to show<br />
reclassification adjustments on the face of the financial statements for items that are reclassified<br />
from other comprehensive income to net income. ASU No. 2011-05 is to be applied retrospectively<br />
and is effective for fiscal years, beginning after December 15, 2011. The WCRA will adopt this<br />
pronouncement in 2012.<br />
3. Investments<br />
The cost of common and preferred stocks, amortized cost of bonds, and estimated fair values at<br />
December 31, 2011 and 2010, are as follows:<br />
(in thousands of dollars)<br />
Cost/<br />
Amortized<br />
Cost<br />
Cash and Cash Equivalents $ 21,638 $ - $ - $ 21,638<br />
Short-term 4,300 - - 4,300<br />
Common stocks $ 772,735 $ 151,071 $ (11,805) $ 912,001<br />
Preferred stocks 4,989 1,514 (1) 6,502<br />
Total stocks $ 777,724 $ 152,585 $ (11,806) $ 918,503<br />
U.S. Treasury securities and<br />
obligations of U.S. government<br />
and agencies $ 274,376 $ 18,768 $ (121) $ 293,023<br />
Corporate debt securities 225,705 11,920 (3,752) 233,873<br />
Mortgage-backed securities 141,075 4,542 (123) 145,494<br />
Total bonds $ 641,156 $ 35,230 $ (3,996) $ 672,390<br />
17<br />
2011<br />
Gross Gross<br />
Unrealized Unrealized Estimated<br />
Gains Losses<br />
Fair Value
Workers’ <strong>Compensation</strong> <strong>Reinsurance</strong> <strong>Association</strong><br />
Notes to Financial <strong>State</strong>ments<br />
December 31, 2011 and 2010<br />
(in thousands of dollars)<br />
2010<br />
Cost/ Gross Gross<br />
Amortized Unrealized Unrealized Estimated<br />
Cost Gains Losses Fair Value<br />
Cash and Cash Equivalents $ 59,875 $ 9 - $ 59,884<br />
Short-term 46,838 3 $ - 46,841<br />
Common stocks $ 785,788 $ 191,489 $ (6,521) $ 970,756<br />
Preferred stocks 5,763 1,731 - 7,494<br />
Total stocks $ 791,551 $ 193,220 $ (6,521) $ 978,250<br />
U.S. Treasury securities and<br />
obligations of U.S. government<br />
and agencies $ 177,590 $ 2,094 $ (3,054) $ 176,630<br />
Corporate debt securities 215,831 13,977 (2,073) 227,735<br />
Mortgage-backed securities 175,036 2,671 (722) 176,985<br />
Total bonds $ 568,457 $ 18,742 $ (5,849) $ 581,350<br />
Total unrealized losses were $15.8 million and $12.4 million at December 31, 2011 and 2010,<br />
respectively. The following tables provide a breakdown of unrealized losses at December 31, 2011<br />
and 2010. The <strong>Association</strong> has reviewed the components and duration of these unrealized losses<br />
and concluded that the losses are temporary in nature. The unrealized losses are primarily on<br />
common stocks. The unrealized losses as of December 31, 2011 and 2010 are as follows:<br />
(in thousands of dollars)<br />
Short-term $ - $ - $ - $ - $ - $ -<br />
Common stocks $ 94,666 $ (11,327) $ 4,196 $ (478) $ 98,862 $ (11,805)<br />
Preferred stocks 491 (1) - - 491 (1)<br />
U.S. Treasury securities<br />
and obligations of U.S.<br />
Less than 12 months<br />
Estimated<br />
Fair Value<br />
Unrealized Holding Losses as of December 31, 2011<br />
Unrealized<br />
Losses<br />
Total stocks $ 95,157 $ (11,328) $ 4,196 $ (478) $ 99,353 $ (11,806)<br />
government and agencies $ 21,909 $ (109) $ 904 $ (5) $ 22,813 $ (114)<br />
Corporate debt securities 87,789 (2,856) 12,135 (903) 99,924 (3,759)<br />
Mortgage-backed securities (21,069) (123) - - (21,069) (123)<br />
Total bonds $ 88,629 $ (3,088) $ 13,039 $ (908) $ 101,668 $ (3,996)<br />
18<br />
12 months or more Total<br />
Estimated<br />
Fair Value<br />
Unrealized<br />
Losses<br />
Estimated<br />
Fair Value<br />
Unrealized<br />
Losses
Workers’ <strong>Compensation</strong> <strong>Reinsurance</strong> <strong>Association</strong><br />
Notes to Financial <strong>State</strong>ments<br />
December 31, 2011 and 2010<br />
(in thousands of dollars)<br />
Short-term $ - $ - $ - $ - $ - $ -<br />
Common stocks $ 69,508 $ (4,501) $ 16,677 $ (2,020) $ 86,185 $ (6,521)<br />
Preferred stocks - - - - - -<br />
U.S. Treasury securities<br />
and obligations of U.S.<br />
Less than 12 months<br />
Estimated<br />
Unrealized Holding Losses as of December 31, 2010<br />
Unrealized<br />
Fair Value Losses Fair Value Losses Fair Value<br />
Total stocks $ 69,508 $ (4,501) $ 16,677 $ (2,020) $ 86,185 $ (6,521)<br />
government and agencies $ 103,541 $ (3,054) $ - $ - $ 103,541 $ (3,054)<br />
Corporate debt securities 68,591 (1,361) 10,354 (712) 78,945 (2,073)<br />
Mortgage-backed securities 61,501 (691) 2,833 (31) 64,334 (722)<br />
Total bonds $ 233,633 $ (5,106) $ 13,187 $ (743) $ 246,820 $ (5,849)<br />
19<br />
12 months or more<br />
Estimated<br />
Unrealized Estimated<br />
The amortized cost and estimated fair value of debt securities at December 31, 2011, by<br />
contractual maturity, are shown below:<br />
(in thousands of dollars)<br />
Total<br />
Unrealized<br />
Losses<br />
Amortized Estimated<br />
Cost Fair Value<br />
Due in one year or less $ 16,440 $ 16,887<br />
Due after one year through five years 123,392 124,432<br />
Due after five years through ten years 185,533 196,107<br />
Due after ten years 315,791 334,964<br />
$ 641,156 $ 672,390<br />
Expected maturities will differ from contractual maturities because borrowers may have the right to<br />
call or prepay obligations with or without call or prepayment penalties.<br />
The <strong>Association</strong> evaluates its investment securities for other-than-temporary impairment on an<br />
annual basis. Factors considered in determining whether an impairment is other-than-temporary<br />
include: 1) the length of time and the extent to which fair value is less than cost, 2) the financial<br />
condition, industry, and near-term prospects of the issuer, 3) adverse changes or events impacting<br />
the issuer, and 4) for equity securities, the ability and intent of the <strong>Association</strong> to hold these<br />
investments until recovery.<br />
During 2011, the <strong>Association</strong> made a determination that the decline in the fair value of certain of its<br />
investments was other-than-temporary. As a result of this determination, the cost bases of the<br />
individual securities were written down to fair value as the new cost bases. For debt securities, the<br />
<strong>Association</strong> further determined that the decline in fair value that was other-than-temporary was<br />
entirely credit loss. In 2011, the total write-down for all investments was $19.9 million and this<br />
entire amount was recorded in earnings as a realized loss. The <strong>Association</strong> also wrote down<br />
$4.6 million of individual securities to fair value in 2010.
Workers’ <strong>Compensation</strong> <strong>Reinsurance</strong> <strong>Association</strong><br />
Notes to Financial <strong>State</strong>ments<br />
December 31, 2011 and 2010<br />
In 2011, net realized gains consisted of gains on securities of approximately $7.0 million and<br />
foreign currency translation loss of $0.3 million. In 2010, net realized gains consisted of gains on<br />
securities of approximately $101.7 million and foreign currency translation loss of $0.1 million.<br />
Gross gains of $92.4 million and $182.5 million, and gross losses of $65.8 million and $76.3 million,<br />
were realized on sales of investments during 2011 and 2010, respectively. Additional realized<br />
losses of $19.9 million and $4.6 million were recognized due to other-than-temporary impairment of<br />
securities during 2011 and 2010, respectively. Net investment income and net realized investment<br />
gains (losses) during the years ended December 31, 2011 and 2010 are summarized below:<br />
(in thousands of dollars)<br />
Net Investment<br />
Income<br />
2011 2010<br />
Cash and cash equivalents $ 218 $ 141 $ - $ -<br />
Common and preferred<br />
stocks 16,859 14,314 (4,459) 49,002<br />
Bonds 21,028 21,495 11,145 52,564<br />
Securities lending 15 1,164 - -<br />
Miscellaneous 1,236 - - -<br />
Investment expenses (4,226) (4,551)<br />
Interest expense on<br />
prepaid assessments (4,787) (6,055)<br />
39,356 37,114 $ 6,686 $ 101,566<br />
$ 30,343 $ 26,508<br />
20<br />
Net Realized<br />
Gains (Losses)<br />
2011 2010<br />
Other comprehensive income in 2011 and 2010 is comprised of the change in unrealized (losses)<br />
gains on available-for-sale securities arising during the year, the impact of foreign currency<br />
translation adjustments on securities denominated in currency other than U.S. dollars and the<br />
change in the funded status of the defined benefit pension plan as follows:<br />
(in thousands of dollars)<br />
2011 2010<br />
Change in net unrealized (losses) gains on securities $ (41,744) $ 42,135<br />
Adjustment of losses included in net income 19,964 4,596<br />
Foreign currency net translation (loss) gain (5,811) 3,070<br />
Pension benefit obligation (868) (360)<br />
Total other comprehensive (loss) income $ (28,459) $ 49,441<br />
(in thousands of dollars)<br />
2011 2010<br />
Accumulated other comprehensive income consists of<br />
Net unrealized gains on securities $ 170,831 $ 192,756<br />
Foreign currency translation gain 1,182 6,848<br />
Pension benefit obligation (2,111) (1,243)<br />
Total accumulated other comprehensive income $ 169,902 $ 198,361
Workers’ <strong>Compensation</strong> <strong>Reinsurance</strong> <strong>Association</strong><br />
Notes to Financial <strong>State</strong>ments<br />
December 31, 2011 and 2010<br />
The <strong>Association</strong> has entered into interest-rate future, stock index future, interest-rate options, and<br />
interest rate swap contracts. These derivatives are used for several purposes including the<br />
management of yield curve and duration on fixed income investments, and for the overlay of cash<br />
balances to maintain equity and fixed income exposure in accordance with asset allocation policy.<br />
Hedge accounting is not used for any derivative contracts. The primary risks of these derivative<br />
instruments are interest rate, credit, and equity market risk. By using certain derivative<br />
instruments, the <strong>Association</strong> is exposed to the counterparty’s credit risk i.e. the risk that derivative<br />
counterparties may not perform in accordance with the contractual provisions. The <strong>Association</strong>’s<br />
exposure to counterparty credit risk is limited to the unrealized gains on such transactions. As of<br />
December 31, 2011 and December 31, 2010, the total net liability of derivative instruments was<br />
$0.1 million and $0.3 million, respectively. In 2011, net realized losses and the change in net<br />
unrealized gains on derivatives totaled $(2.8) million and less than $0.1 million, respectively. The<br />
net realized losses from derivatives were primarily from interest-rate and stock-index futures. In<br />
2010, net realized gains and the change in net unrealized losses on derivatives totaled $4.0 million<br />
and $(0.2) million, respectively. The majority of this income from derivatives was net realized gains<br />
on interest-rate and stock-index futures.<br />
4. Fair Value Measurements<br />
Accounting Standards Codification 820 defines fair value as the exit price that would be received<br />
for an asset in the principal or most advantageous market for the asset. See Note 2 for the three<br />
levels of inputs that may be used in measuring fair value. We do not have any assets or liabilities<br />
measured at fair value on a nonrecurring basis at December 31, 2011 or December 31, 2010.<br />
There were no securities as of December 31, 2011 and 2010, respectively, where the fair value<br />
was determined using Level 3 inputs, i.e. unobservable inputs supported by little or no market<br />
activity.<br />
Assets measured at fair value on a recurring basis are summarized below:<br />
(in thousands of dollars)<br />
As of December 31, 2011<br />
Fair Value Measurement Using<br />
Level 1 Level 2 Level 3<br />
Total<br />
Fair Value<br />
Short-term $ 21,638 $ 4,300 $ - $ 25,938<br />
Common stocks $ 912,001 $ - $ - $ 912,001<br />
Preferred stocks - 6,502 - 6,502<br />
Total stocks $ 912,001 $ 6,502 $ - $ 918,503<br />
U.S. Treasury securities<br />
and obligations of U.S.<br />
government and agencies $ 285,906 $ 7,117 $ - $ 293,023<br />
Corporate debt securities - 233,873 - 233,873<br />
Mortgage-backed securities - 145,494 - 145,494<br />
Total bonds $ 285,906 $ 386,484 $ - $ 672,390<br />
21
Workers’ <strong>Compensation</strong> <strong>Reinsurance</strong> <strong>Association</strong><br />
Notes to Financial <strong>State</strong>ments<br />
December 31, 2011 and 2010<br />
(in thousands of dollars)<br />
As of December 31, 2010<br />
Fair Value Measurement Using<br />
Level 1 Level 2 Level 3<br />
Total<br />
Fair Value<br />
Short-term $ 45,220 $ 1,621 $ - $ 46,841<br />
Common stocks $ 970,756 $ - $ - $ 970,756<br />
Preferred stocks - 7,494 - 7,494<br />
Total stocks $ 970,756 $ 7,494 $ - $ 978,250<br />
U.S. Treasury securities<br />
and obligations of U.S.<br />
government and agencies $ 164,583 $ 12,047 $ - $ 176,630<br />
Corporate debt securities - 227,735 - 227,735<br />
Mortgage-backed securities - 176,985 - 176,985<br />
Total bonds $ 164,583 $ 416,767 $ - $ 581,350<br />
5. Liabilities for Losses and Loss Expenses<br />
The liability for losses and loss expenses at December 31, 2011 and 2010, is summarized as<br />
follows:<br />
(in thousands of dollars)<br />
Funded, undiscounted $ 6,894,306 $ 6,940,273<br />
Discount (5,340,612) (5,368,984)<br />
Funded, discounted 1,553,694 1,571,289<br />
Unfunded, undiscounted 1,472,256 1,737,537<br />
Discount (1,304,922) (1,542,187)<br />
Unfunded, discounted 167,334 195,350<br />
Total, discounted $ 1,721,028 $ 1,766,639<br />
22<br />
2011 2010
Workers’ <strong>Compensation</strong> <strong>Reinsurance</strong> <strong>Association</strong><br />
Notes to Financial <strong>State</strong>ments<br />
December 31, 2011 and 2010<br />
Funded Liabilities<br />
Activity in the funded liability for losses and loss expenses is summarized as follows:<br />
(in thousands of dollars)<br />
Balance at January 1<br />
Funded, undiscounted $ 6,940,273 $ 6,409,177<br />
Incurred related to<br />
Current year 395,388 396,017<br />
Prior years (365,202) 208,963<br />
Total incurred 30,186 604,980<br />
Paid related to<br />
Current year 56 32<br />
Prior years 76,097 73,852<br />
Total paid 76,153 73,884<br />
Balance at December 31<br />
Funded, undiscounted 6,894,306 6,940,273<br />
Discount (5,340,612) (5,368,984)<br />
Funded, discounted $ 1,553,694 $ 1,571,289<br />
23<br />
2011 2010<br />
Reserves are reviewed periodically and updated based on current claims experience, trends, and<br />
economic outlook.<br />
The following table compares the present value of the <strong>Association</strong>’s funded reserve changes during<br />
2011 with those of 2010.<br />
2011 2010<br />
Discount rate at year end 7.0% 7.0%<br />
(in thousands of dollars)<br />
2011 2010<br />
Funded reserves as of prior year end $ 1,571,289 $ 1,511,871<br />
Prior accident year impact of actuarial adjustments (100,000) (20,266)<br />
Payments on prior accident years (76,097) (73,852)<br />
Present value update 107,327 103,246<br />
Reserves for current accident year 51,176 50,290<br />
Total calendar year funded reserve changes (17,595) 59,418<br />
Funded reserves as of year end $ 1,553,694 $ 1,571,289<br />
In both 2011 and 2010, the reduction in prior year loss reserves was due primarily to favorable<br />
development on case-incurred losses, which resulted in lower projected ultimate losses.
Workers’ <strong>Compensation</strong> <strong>Reinsurance</strong> <strong>Association</strong><br />
Notes to Financial <strong>State</strong>ments<br />
December 31, 2011 and 2010<br />
Unfunded Liabilities<br />
Payments on prior accident years in excess of prefunded limits totaled $1.8 million and $1.6 million<br />
in 2011 and 2010, respectively. Anticipated payments in excess of prefunded limits are billed as<br />
premiums for the unfunded layer.<br />
The unfunded reserve methodology follows the funded analysis. Discount rates for unfunded<br />
reserves are the same as the funded reserves. The table below compares the present value<br />
unfunded reserve changes during 2011 with those of 2010.<br />
(in thousands of dollars)<br />
Unfunded reserves as of prior year end $ 195,350 $ 179,990<br />
Prior year changes<br />
Prior accident year impact of actuarial adjustments (42,096) -<br />
Payments on prior accident years (1,812) (1,613)<br />
Present value update 13,611 12,543<br />
Reserves for the current accident year 2,280 4,430<br />
Total calendar year unfunded reserve changes (28,016) 15,360<br />
Unfunded reserves as of year end $ 167,334 $ 195,350<br />
24<br />
2011 2010<br />
Reserve changes for the unfunded layer do not have an impact on accumulated deficit because on<br />
the statement of operations, unfunded losses incurred (which include reserve changes) are offset<br />
by an unfunded deferred premium.<br />
In 2011, the reduction in prior year loss reserves was due primarily to favorable development on<br />
case-incurred losses, which resulted in lower projected ultimate losses.<br />
6. Employee Benefit Plans<br />
Defined Benefit Pension Plan<br />
The <strong>Association</strong> has a noncontributory defined benefit pension plan that covers employees who<br />
meet eligibility and entry date requirements. The <strong>Association</strong> uses a December 31 measurement<br />
date. As of December 31, 2011, the plan's investment mix was 60% equities and 40% debt<br />
securities. The determination of the long-term rate of return on plan assets was based on historical<br />
rates of return and future estimated returns for the individual assets classes. Based on the target<br />
allocation, the overall expected long-term rate of return for the plan is 7.25%.
Workers’ <strong>Compensation</strong> <strong>Reinsurance</strong> <strong>Association</strong><br />
Notes to Financial <strong>State</strong>ments<br />
December 31, 2011 and 2010<br />
Benefits paid in 2011 and 2010 were $32,048 and $23,950, respectively. The estimated benefit<br />
payments for 2012 are $41,219.<br />
(in thousands of dollars)<br />
Benefit obligation, end of year $ 4,734 $ 3,529<br />
Plan assets at fair value, end of year 2,756 2,543<br />
Funded status (recognized as a component of accrued<br />
liabilities and accumulated comprehensive income) $ (1,978) $ (986)<br />
(in thousands of dollars)<br />
25<br />
2011 2010<br />
2011 2010<br />
Employer contributions $ 190 $ 186<br />
Discount rate 4.09% 5.06%<br />
Expected return on plan assets 7.25% 8.00%<br />
Rate of compensation increase 4.00% 4.00%<br />
The fair value of the plan’s assets was determined in accordance with ASC 820, Fair Value<br />
Measurements, using the three levels of inputs described in Note 2.<br />
The fair value of plan equities of $1.7 million was determined using Level 1 inputs consisting of<br />
quoted prices for identical securities in active markets. The fair value of plan debt securities of<br />
$1.1 million was determined using Level 2 inputs consisting of quoted prices for similar securities in<br />
active markets. There were no securities where the fair value was determined using Level 3<br />
inputs, i.e. unobservable inputs supported by little or no market activity.<br />
Defined Contribution Plan<br />
The <strong>Association</strong> sponsors a defined contribution plan, which covers employees who meet the<br />
plan's eligibility requirements and have completed the service requirements, under Section 401(k)<br />
of the Internal Revenue Code. Participants can contribute a certain percentage of their<br />
compensation (subject to annual contribution limits) to the plan. In 2011 and 2010, the <strong>Association</strong><br />
matched a maximum 4.0% of participant eligible compensation. The <strong>Association</strong>'s matching<br />
contribution to the plan was $0.1 million in both 2011 and 2010.<br />
7. Income Tax Status<br />
In 1996, the <strong>Association</strong> was granted an exemption from federal income taxes under<br />
Section 501(c)(27)(a) of the Internal Revenue Code. The <strong>Association</strong> received a tax-exempt<br />
determination letter from the Internal Revenue Service dated February 7, 1997. Therefore, no<br />
provision for income taxes is included in the <strong>Association</strong>’s financial statements.
Workers’ <strong>Compensation</strong> <strong>Reinsurance</strong> <strong>Association</strong><br />
Notes to Financial <strong>State</strong>ments<br />
December 31, 2011 and 2010<br />
8. Cash Flows<br />
A reconciliation of net income to net cash provided by operating activities for the years ended<br />
December 31, 2011 and 2010 is as follows:<br />
(in thousands of dollars)<br />
Net income $ 25,537 $ 42,503<br />
Adjustments to reconcile net loss to net cash provided by<br />
operating activities<br />
Net realized investment gains (6,686) (101,566)<br />
Decrease in funded uncollected reinsurance premiums,<br />
net of accrued premium adjustments 2 1,403<br />
(Decrease) increase in liability for funded losses and loss (17,595) 59,418<br />
expenses<br />
Other, net 3,601 2,170<br />
9. Assessments<br />
Total adjustments (20,678) (38,575)<br />
Net cash provided by operating activities $ 4,859 $ 3,928<br />
26<br />
2011 2010<br />
On May 19, 2009 the Board declared deficient premium assessments to members of $178 million<br />
and deficiency assessments to self-insurer members and workers’ compensation policyholders of<br />
$90 million.<br />
Deficient Premium Assessments<br />
The deficient premium assessments are retrospective in nature, and are based on members’<br />
historic WCRA exposures and selected coverage layers from 1979 to 2008. All insurers and selfinsurers<br />
who were members of the WCRA on December 31, 2008, are obligated to pay deficient<br />
premium assessments.<br />
The deficient premium assessments are payable in five equal annual installments, with the first<br />
installment due on July 15, 2010, and subsequent installments due on each February 1, 2011<br />
through 2014. Members were given the options of prepaying their entire five-year deficient<br />
premium assessment on December 1, 2009, July 15, 2010, February 1, 2011, 2012 or 2013, and<br />
having the assessment obligation discounted at an annual rate of 7%.<br />
The <strong>Association</strong> recorded installments of $35.6 million and $35.8 million of the deficient premium<br />
assessments as a contribution to capital in 2011 and 2010, respectively. The deficient premium<br />
assessments are being recorded on an installment basis due to reasonable uncertainty regarding<br />
continuation of the assessments over the full five years. The Board Resolution declaring the<br />
assessments provides that annually the Board will determine whether additional capital produced<br />
by earlier assessments, improved investment performance, and/or adjustments in loss reserve<br />
requirements warrant continuation of the assessments.
Workers’ <strong>Compensation</strong> <strong>Reinsurance</strong> <strong>Association</strong><br />
Notes to Financial <strong>State</strong>ments<br />
December 31, 2011 and 2010<br />
As of December 31, 2011 and 2010, members had prepaid discounted assessments totaling<br />
$106.3 million and $105.9 million, respectively. In 2011 and 2010, installments of the total<br />
undiscounted amount of the prepaid assessments were recorded as a contribution to capital. As of<br />
December 31, 2011 and 2010, the respective remaining portions of the prepaid assessments were<br />
recorded as deferred premium assessments. The prepayment discount is being amortized at an<br />
annual rate of 7%. Amortization of $4.8 million and $6.1 million was recorded as an offset to<br />
investment income in 2011 and 2010, respectively. As of December 31, 2011 and 2010, a deficient<br />
premium receivable was recorded for the respective portions of the 2011 and 2010 installments of<br />
the deficient premium assessments that were not prepaid.<br />
Deficiency Assessments<br />
The deficiency assessments are prospective in nature, and are being determined on a year-to-year<br />
basis over the five year period, 2010 through 2014. The exposure base for these deficiency<br />
assessments will be calculated in accordance with the policy year accumulated standard earned<br />
premium at Designated Statistical Reporting (DSR) level methodology as defined by the <strong>Minnesota</strong><br />
Workers’ <strong>Compensation</strong> Insurers <strong>Association</strong>. For each year of the deficiency assessments,<br />
self-insurers and policyholders will pay deficiency assessments based on their estimated DSR<br />
premium for the year, subject to subsequent true-up audit adjustments. Deficiency assessments of<br />
$18.0 million and $11.8 million were recorded as a contribution to capital in 2011 and 2010,<br />
respectively.<br />
10. Contingencies<br />
In October 2008, the <strong>Association</strong>, along with three other <strong>Minnesota</strong> nonprofit organizations, filed a<br />
lawsuit against Wells Fargo Bank, N.A., relating to its securities lending program. The lawsuit was<br />
filed in <strong>Minnesota</strong> District Court in Ramsey County (court). The trial was concluded in June 2010.<br />
The jury found that Wells Fargo Bank had breached its fiduciary duty to the plaintiffs and violated<br />
the <strong>Minnesota</strong> Consumer Fraud statute. Based on the jury verdict, the court entered judgment for<br />
the <strong>Association</strong> in the amount of $12 million. Subsequently, in a judgment entered in June 2011,<br />
the court found that the WCRA and the other plaintiffs are also entitled to an award of attorney's<br />
fees, litigation costs, forfeiture of certain fees by Wells Fargo, and pre-judgment interest. Wells<br />
Fargo has appealed the case to the <strong>Minnesota</strong> Court of Appeals (appeals court). Final briefs were<br />
filed with the appeals court in November 2011 and oral arguments were presented to the appeals<br />
court in February 2012. Because the legal proceedings are not concluded, the <strong>Association</strong> did not<br />
record a benefit from the lawsuit in either the 2011 or the 2010 financial statements.<br />
27
®<br />
Workers’ <strong>Compensation</strong> <strong>Reinsurance</strong> <strong>Association</strong> ®<br />
WEBSITE<br />
www.wcra.biz<br />
EMAIL<br />
wcra@wcra.biz<br />
FAX<br />
651-229-1848<br />
OFFICE<br />
Suite 1700<br />
400 Robert Street North<br />
Saint Paul, MN 55101-2026<br />
PHONE<br />
651-293-0999 or 800-293-8006


