chapter 36 - Vestibular Mechanics - KEMT FEI TUKE
chapter 36 - Vestibular Mechanics - KEMT FEI TUKE
chapter 36 - Vestibular Mechanics - KEMT FEI TUKE

You also want an ePaper? Increase the reach of your titles
YUMPU automatically turns print PDFs into web optimized ePapers that Google loves.
<strong>36</strong>.5 Otolith Frequency Response<br />
© 2000 by CRC Press LLC<br />
(<strong>36</strong>.10)<br />
This transfer function can now be studied in the frequency domain. It should be noted that these are<br />
linear partial differential equations and that the process of frequency domain analysis is appropriate. The<br />
range of values of ε = 0.01–0.2, M = 5–20, and R = 0.75 have been established by Grant and Cotton<br />
[1991] in a numerical finite difference solution of the governing equations. With these values established,<br />
the frequency response can be completed.<br />
In order to construct a magnitude- and phase-versus-frequency plot of the transfer function, the<br />
nondimensional time will be converted back to real time for use on the frequency axis. For the conversion<br />
to real time the following physical variables will be used: ρ o = 1.35 g/cm 3 , b = 15 µm, µ f = 0.85 mPa·s.<br />
The general frequency response is shown in Fig. <strong>36</strong>.4. The flat response from DC up to the first corner<br />
frequency establishes this system as an accelerometer. These are the range-of-motion frequencies encountered<br />
in normal motion environments where this transducer is expected to function.<br />
The range of flat response can be easily controlled with the two parameters ε and M. It is interesting<br />
to note that both the elastic term and the system damping are controlled by the gel layer, and thus an<br />
animal can easily control the system response by changing the parameters of this saccharide gel layer.<br />
The cross-linking of saccharide gels is extremely variable, yielding vastly different elastic and viscous<br />
properties of the resulting structure.<br />
The otoconial layer transfer function can be compared to recent data from single-fiber neural recording.<br />
The only discrepancy between the experimental data and theoretical model is a low-frequency phase lead<br />
and accompanying amplitude reduction. This has been observed in most experimental single-fiber<br />
recordings and has been attributed to the hair cell.<br />
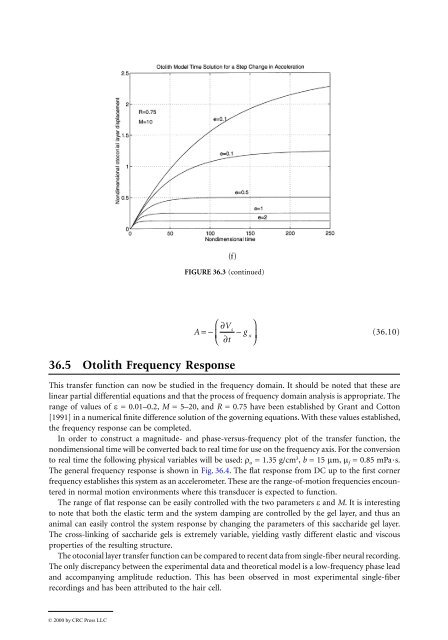
(f)<br />
FIGURE <strong>36</strong>.3 (continued)<br />
Vs<br />
A =− g x<br />
t<br />
∂<br />
∂ −<br />
⎛ ⎞<br />
⎜ ⎟<br />
⎝ ⎠