CHAPTER 4 Calculator Notes for the TI-89, TI-92 Plus, and Voyage ...
CHAPTER 4 Calculator Notes for the TI-89, TI-92 Plus, and Voyage ...
CHAPTER 4 Calculator Notes for the TI-89, TI-92 Plus, and Voyage ...

You also want an ePaper? Increase the reach of your titles
YUMPU automatically turns print PDFs into web optimized ePapers that Google loves.
<strong>CHAPTER</strong> 4 <strong>Calculator</strong> <strong>Notes</strong> <strong>for</strong> <strong>the</strong> <strong>TI</strong>-<strong>89</strong>, <strong>TI</strong>-<strong>92</strong> <strong>Plus</strong>,<br />
<strong>and</strong> <strong>Voyage</strong> 200<br />
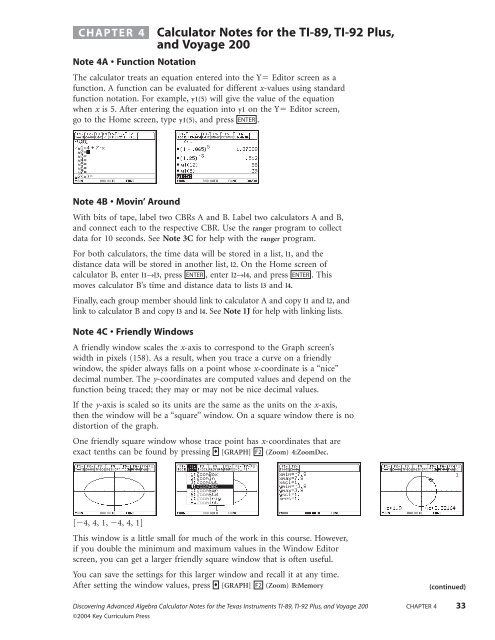
Note 4A • Function Notation<br />
The calculator treats an equation entered into <strong>the</strong> Y Editor screen as a<br />
function. A function can be evaluated <strong>for</strong> different x-values using st<strong>and</strong>ard<br />
function notation. For example, y1(5) will give <strong>the</strong> value of <strong>the</strong> equation<br />
when x is 5. After entering <strong>the</strong> equation into y1 on <strong>the</strong> Y Editor screen,<br />
go to <strong>the</strong> Home screen, type y1(5), <strong>and</strong> press ENTER .<br />
Note 4B • Movin’ Around<br />
With bits of tape, label two CBRs A <strong>and</strong> B. Label two calculators A <strong>and</strong> B,<br />
<strong>and</strong> connect each to <strong>the</strong> respective CBR. Use <strong>the</strong> ranger program to collect<br />
data <strong>for</strong> 10 seconds. See Note 3C <strong>for</strong> help with <strong>the</strong> ranger program.<br />
For both calculators, <strong>the</strong> time data will be stored in a list, l1, <strong>and</strong> <strong>the</strong><br />
distance data will be stored in ano<strong>the</strong>r list, l2. On <strong>the</strong> Home screen of<br />
calculator B, enter l1→l3, press ENTER , enter l2→l4, <strong>and</strong> press ENTER . This<br />
moves calculator B’s time <strong>and</strong> distance data to lists l3 <strong>and</strong> l4.<br />
Finally, each group member should link to calculator A <strong>and</strong> copy l1 <strong>and</strong> l2, <strong>and</strong><br />
link to calculator B <strong>and</strong> copy l3 <strong>and</strong> l4. SeeNote 1J <strong>for</strong> help with linking lists.<br />
Note 4C • Friendly Windows<br />
A friendly window scales <strong>the</strong> x-axis to correspond to <strong>the</strong> Graph screen’s<br />
width in pixels (158). As a result, when you trace a curve on a friendly<br />
window, <strong>the</strong> spider always falls on a point whose x-coordinate is a “nice”<br />
decimal number. The y-coordinates are computed values <strong>and</strong> depend on <strong>the</strong><br />
function being traced; <strong>the</strong>y may or may not be nice decimal values.<br />
If <strong>the</strong> y-axis is scaled so its units are <strong>the</strong> same as <strong>the</strong> units on <strong>the</strong> x-axis,<br />
<strong>the</strong>n <strong>the</strong> window will be a “square” window. On a square window <strong>the</strong>re is no<br />
distortion of <strong>the</strong> graph.<br />
One friendly square window whose trace point has x-coordinates that are<br />
exact tenths can be found by pressing ♦ [GRAPH] F2 (Zoom) 4:ZoomDec.<br />
[4, 4, 1, 4, 4, 1]<br />
This window is a little small <strong>for</strong> much of <strong>the</strong> work in this course. However,<br />
if you double <strong>the</strong> minimum <strong>and</strong> maximum values in <strong>the</strong> Window Editor<br />
screen, you can get a larger friendly square window that is often useful.<br />
You can save <strong>the</strong> settings <strong>for</strong> this larger window <strong>and</strong> recall it at any time.<br />
After setting <strong>the</strong> window values, press ♦ [GRAPH] F2 (Zoom) B:Memory<br />
Discovering Advanced Algebra <strong>Calculator</strong> <strong>Notes</strong> <strong>for</strong> <strong>the</strong> Texas Instruments <strong>TI</strong>-<strong>89</strong>, <strong>TI</strong>-<strong>92</strong> <strong>Plus</strong>, <strong>and</strong> <strong>Voyage</strong> 200 <strong>CHAPTER</strong> 4 33<br />
©2004 Key Curriculum Press<br />
(continued)
Note 4C • Friendly Windows (continued) <strong>TI</strong>-<strong>89</strong>/<strong>TI</strong>-<strong>92</strong> <strong>Plus</strong>/<strong>Voyage</strong> 200<br />
2:ZoomSto. Now when you want to use it again, press ♦ [GRAPH] F2 (Zoom)<br />
B:Memory 3:ZoomRcl. This particular window is often referred to as <strong>the</strong><br />
friendly window with a factor of 2.<br />
It is sometimes helpful to see <strong>the</strong> grid in <strong>the</strong> background of <strong>the</strong> screen<br />
display. To turn <strong>the</strong> grid on (or off), go to <strong>the</strong> Graph or Y Editor screen<br />
<strong>and</strong> press F1 (Tools) 9:Format..., <strong>and</strong> set Grid OFF or ON.<br />
[15.8, 15.8, 1, 7.6, 7.6, 1]<br />
Note 4D • Trans<strong>for</strong>mations <strong>and</strong> Compositions<br />
You can use functions entered into <strong>the</strong> Y Editor screen in o<strong>the</strong>r functions<br />
to show trans<strong>for</strong>mations <strong>and</strong> to construct compositions.<br />
Trans<strong>for</strong>mations of Functions<br />
You can enter an equation into <strong>the</strong> Y Editor screen <strong>and</strong> <strong>the</strong>n define a<br />
second equation as a trans<strong>for</strong>mation of <strong>the</strong> first. For example, enter 4x 2<br />
into y1 <strong>and</strong> define y2 as y23*y1(x4)2. y2 is <strong>the</strong> image of y1 after being<br />
stretched vertically by a factor of 3, translated right 4 units <strong>and</strong> up 2 units.<br />
[15.8, 15.8, 1, 3.8, 15.2, 1]<br />
Compositions of Functions<br />
If you enter two (or more) equations into <strong>the</strong> Y Editor screen, you can<br />
define ano<strong>the</strong>r equation as <strong>the</strong> composition of <strong>the</strong> equations you have<br />
entered. For example, enter 4x 2 into y1 <strong>and</strong> x5 into y3. Define y4 as <strong>the</strong><br />
composition of y1 <strong>and</strong> y3 by entering y4 y1(y3(x)).<br />
[15.8, 15.8, 1, 7.6, 7.6, 1]<br />
(continued)<br />
34 <strong>CHAPTER</strong> 4 Discovering Advanced Algebra <strong>Calculator</strong> <strong>Notes</strong> <strong>for</strong> <strong>the</strong> Texas Instruments <strong>TI</strong>-<strong>89</strong>, <strong>TI</strong>-<strong>92</strong> <strong>Plus</strong>, <strong>and</strong> <strong>Voyage</strong> 200<br />
©2004 Key Curriculum Press
Note 4D • Trans<strong>for</strong>mations <strong>and</strong> Compositions (continued) <strong>TI</strong>-<strong>89</strong>/<strong>TI</strong>-<strong>92</strong> <strong>Plus</strong>/<strong>Voyage</strong> 200<br />
You can use <strong>the</strong> Home screen recursive loop y1(x)→x to evaluate <strong>the</strong> repeated<br />
composition of a function with itself. Store a starting value in x, <strong>the</strong>n type<br />
y1(x), press STOÍ , enter x, <strong>the</strong>n press ENTER ENTER ENTER , <strong>and</strong> so on. (See<br />
Note 1B <strong>for</strong> more on Home screen recursion.)<br />
Note 4E • TRANSFRM Program<br />
The program transfrm gives you practice finding equations <strong>for</strong> given<br />
graphs. You have a choice of 1:Parabola (translations of parabolas),<br />
2:Above or Sq Root (reflections <strong>and</strong> translations of square root functions <strong>and</strong><br />
parabolas), 3:Above or Abs Val (stretches, shrinks, reflections, <strong>and</strong> translations of<br />
absolute values, roots, <strong>and</strong> parabolas), or 4:Above or Semicircle (<strong>the</strong> same <strong>for</strong><br />
semicircles).<br />
After you select your option, <strong>the</strong> calculator will display a graph <strong>and</strong> stop.<br />
Study <strong>the</strong> graph <strong>and</strong> determine its equation. When you have decided on<br />
an equation, press ENTER ALPHA , type your equation into <strong>the</strong> box, <strong>and</strong><br />
press ENTER ENTER . If your equation is correct, you’ll have a match <strong>and</strong><br />
nothing new will appear on <strong>the</strong> screen. If your equation is not correct,<br />
<strong>the</strong> graphs will not match. In that case, press ENTER <strong>and</strong> try again.<br />
When you are finished with one graph, press ENTER Y ENTER ENTER to run <strong>the</strong><br />
program again.<br />
[15.8, 15.8, 1, 7.6, 7.6, 1] [15.8, 15.8, 1, 7.6, 7.6, 1]<br />
The option 5:Generic will draw <strong>the</strong> graph of a generic function using a thick<br />
line <strong>and</strong> <strong>the</strong> graph of its image after a trans<strong>for</strong>mation using <strong>the</strong> regular style.<br />
Type <strong>the</strong> equation of <strong>the</strong> image into <strong>the</strong> box. Use y8(x) to represent <strong>the</strong><br />
original function.<br />
[15.8, 15.8, 1, 7.6, 7.6, 1] [15.8, 15.8, 1, 7.6, 7.6, 1]<br />
Clean-Up<br />
After you quit <strong>the</strong> program, you may want to go to <strong>the</strong> Y Editor screen<br />
<strong>and</strong> clear <strong>the</strong> functions so <strong>the</strong>y don’t interfere with future work.<br />
Discovering Advanced Algebra <strong>Calculator</strong> <strong>Notes</strong> <strong>for</strong> <strong>the</strong> Texas Instruments <strong>TI</strong>-<strong>89</strong>, <strong>TI</strong>-<strong>92</strong> <strong>Plus</strong>, <strong>and</strong> <strong>Voyage</strong> 200 <strong>CHAPTER</strong> 4 35<br />
©2004 Key Curriculum Press<br />
(continued)
Note 4E • TRANSFRM Program (continued) <strong>TI</strong>-<strong>89</strong>/<strong>TI</strong>-<strong>92</strong> <strong>Plus</strong>/<strong>Voyage</strong> 200<br />
transfrm()<br />
Prgm<br />
© Initialize<br />
setMode("Graph","Function")<br />
-15.8áxmin:15.8áxmax<br />
-7.6áymin:7.6áymax<br />
1áyscl:1áxscl<br />
setGraph("Grid","On")<br />
setGraph("Axes","On")<br />
PlotsOff<br />
ClrDraw<br />
DelVar a,b,h,k,x<br />
© Set up generic functions in Y3-Y8<br />
ClrGraph<br />
Define y3(x)=k+(b*((x-h)/a))^2 ©parabola<br />
Define y4(x)=k+b*√((x-h)/a) ©square root<br />
Define y5(x)=k+b*abs((x-h)/a) ©absolute value<br />
Define y6(x)=k+b*√(1-((x-h)/a)^2) ©Semicircle<br />
Define y7(x)=k+b*y8((x-h)/a) © trans<strong>for</strong>mation of Y8<br />
Define y8(x)=when(x≥-3,when(x≥-1,when(x≥2,when(x>3,undef,<br />
-5+2*x),1-x),2),undef)<br />
Style 8,"thick"<br />
©Display<br />
ClrIO<br />
instructions<br />
Disp "Choose a type of graph"<br />
Disp "(or quit) from F1. ENTER"<br />
Disp "when ready to type a"<br />
Disp "<strong>for</strong>mula <strong>for</strong> <strong>the</strong> graph."<br />
Loop ©main loop<br />
DelVar a,b,h,k,x<br />
3áf © beginning value of f <strong>for</strong> later choices<br />
ToolBar<br />
Title "Types"<br />
Item "Parabola",lbl1<br />
Item "Above or Sq Root",lbl2<br />
Item "Above or Abs Val",lbl3<br />
Item "Above or Semicirc",lbl4<br />
Item "Generic",lbl5<br />
Item<br />
EndTBar<br />
"Quit",lbl6<br />
©Set up values of F <strong>for</strong> later choices<br />
Lbl lbl5:f+1áf<br />
Lbl lbl4:f+1áf<br />
(continued)<br />
36 <strong>CHAPTER</strong> 4 Discovering Advanced Algebra <strong>Calculator</strong> <strong>Notes</strong> <strong>for</strong> <strong>the</strong> Texas Instruments <strong>TI</strong>-<strong>89</strong>, <strong>TI</strong>-<strong>92</strong> <strong>Plus</strong>, <strong>and</strong> <strong>Voyage</strong> 200<br />
©2004 Key Curriculum Press
Note 4E • TRANSFRM Program (continued) <strong>TI</strong>-<strong>89</strong>/<strong>TI</strong>-<strong>92</strong> <strong>Plus</strong>/<strong>Voyage</strong> 200<br />
(PROGRAM: TRANSFRM continued)<br />
Lbl lbl3:f+1áf<br />
Lbl lbl2:f+1áf<br />
©Set up parameters according to function choice<br />
Lbl lbl1<br />
round(-7.5+15*r<strong>and</strong>(),0)áh ©r<strong>and</strong>om integer -7 to 7<br />
round(-4.5+9*r<strong>and</strong>(),0)ák ©r<strong>and</strong>om integer -4 to 4<br />
1áa :1áb<br />
If f>3 Then<br />
If r<strong>and</strong>()
Note 4F • Graphing Absolute-Value Functions<br />
To use <strong>the</strong> absolute-value function, press 2nd [MATH] 1:Number 2:abs(. For<br />
example, to graph y ⏐x 3⏐ enter y1abs(x3) into <strong>the</strong> Y Editor screen,<br />
set an appropriate window, <strong>and</strong> press ♦ [GRAPH].<br />
Note 4G • Boolean Expressions<br />
[15.8, 15.8, 1, 7.6, 7.6, 1]<br />
You can use Boolean expressions to define a piecewise function. Boolean<br />
expressions are statements using , , , , , or that are ei<strong>the</strong>r true<br />
or false. To find <strong>the</strong>se symbols, press [MATH] 8:Test. (You can also<br />
press [] or [].)<br />
As an example of a piecewise function, on <strong>the</strong> Y Editor screen enter<br />
y1when(x1,2x2 2nd<br />
2nd<br />
2nd<br />
,0). Get <strong>the</strong> when( comm<strong>and</strong> from <strong>the</strong> catalog, or type it.<br />
The when( comm<strong>and</strong> requires three parameters: first <strong>the</strong> Boolean expression,<br />
second <strong>the</strong> value when <strong>the</strong> expression is true, <strong>and</strong> third <strong>the</strong> value when <strong>the</strong><br />
expression is false. You can evaluate <strong>the</strong> function <strong>for</strong> particular values of x<br />
on <strong>the</strong> Home screen <strong>and</strong> it can be graphed.<br />
[15.8, 15.8, 1, 7.6, 7.6, 1]<br />
By nesting when( comm<strong>and</strong>s, you can link any number of functions toge<strong>the</strong>r<br />
in a piecewise fashion.<br />
[15.8, 15.8, 1, 7.6, 7.6, 1]<br />
With repeated nesting you can also limit <strong>the</strong> domain by designating<br />
undefined x-values. Enter this equation into <strong>the</strong> Y Editor screen:<br />
y1when(x3,when(x1,when(x2,undef,2x2 ),4x),undef). The graph<br />
is undefined <strong>for</strong> x-values less than 3 <strong>and</strong> x-values greater than 2.<br />
<strong>TI</strong>-<strong>89</strong>/<strong>TI</strong>-<strong>92</strong> <strong>Plus</strong>/<strong>Voyage</strong> 200<br />
(continued)<br />
38 <strong>CHAPTER</strong> 4 Discovering Advanced Algebra <strong>Calculator</strong> <strong>Notes</strong> <strong>for</strong> <strong>the</strong> Texas Instruments <strong>TI</strong>-<strong>89</strong>, <strong>TI</strong>-<strong>92</strong> <strong>Plus</strong>, <strong>and</strong> <strong>Voyage</strong> 200<br />
©2004 Key Curriculum Press
Note 4G • Boolean Expressions (continued) <strong>TI</strong>-<strong>89</strong>/<strong>TI</strong>-<strong>92</strong> <strong>Plus</strong>/<strong>Voyage</strong> 200<br />
For 3 x 1 <strong>the</strong> defined function is 4 x, <strong>and</strong> <strong>for</strong> 1 x 2 <strong>the</strong><br />
defined function is 2 x 2 .<br />
Note 4H • Drawing Segments<br />
[15.8, 15.8, 1, 7.6, 7.6, 1]<br />
On <strong>the</strong> Graph screen you can draw an overlay on top of <strong>the</strong> graph.<br />
Follow <strong>the</strong>se steps to draw a segment:<br />
a. Press 2nd [F7] (Pen) 3:Line. (On a <strong>TI</strong>-<strong>92</strong> <strong>Plus</strong> or a <strong>Voyage</strong> 200, press F7 .)<br />
b. Arrow to one endpoint of <strong>the</strong> segment you want <strong>and</strong> press ENTER .<br />
c. Arrow to <strong>the</strong> o<strong>the</strong>r endpoint <strong>and</strong> press ENTER again.<br />
Pressing ENTER twice ends one segment <strong>and</strong> begins ano<strong>the</strong>r at <strong>the</strong> same<br />
point, so you can make a closed figure.<br />
[15.8, 15.8, 1, 7.6, 7.6, 1]<br />
[15.8, 15.8, 1, 7.6, 7.6, 1] [15.8, 15.8, 1, 7.6, 7.6, 1]<br />
You can also draw segments by entering instructions into <strong>the</strong> Home screen.<br />
To draw a segment between (4, 1) <strong>and</strong> (5, 3), enter Line 4,1,5,3. Find Line<br />
in <strong>the</strong> catalog or type it.<br />
[15.8, 15.8, 1, 7.6, 7.6, 1]<br />
To erase all drawings, on <strong>the</strong> Graph screen press 2nd [F4] (Regraph). To erase<br />
part of a drawing, on <strong>the</strong> Graph screen press 2nd [F7] (Pen) 2:Eraser.<br />
Discovering Advanced Algebra <strong>Calculator</strong> <strong>Notes</strong> <strong>for</strong> <strong>the</strong> Texas Instruments <strong>TI</strong>-<strong>89</strong>, <strong>TI</strong>-<strong>92</strong> <strong>Plus</strong>, <strong>and</strong> <strong>Voyage</strong> 200 <strong>CHAPTER</strong> 4 39<br />
©2004 Key Curriculum Press