Chapter 19 Thermal Properties
Chapter 19 Thermal Properties
Chapter 19 Thermal Properties

You also want an ePaper? Increase the reach of your titles
YUMPU automatically turns print PDFs into web optimized ePapers that Google loves.
W6 • <strong>Chapter</strong> <strong>19</strong> / <strong>Thermal</strong> <strong>Properties</strong><br />
Potential energy<br />
Vibrational energies<br />
0<br />
E 5<br />
E 4<br />
E 3<br />
E 2<br />
E 1<br />
r 1 r2<br />
r 3r4 r 5<br />
r 0<br />
Interatomic distance<br />
Potential energy<br />
Vibrational energies<br />
(a)<br />
(b)<br />
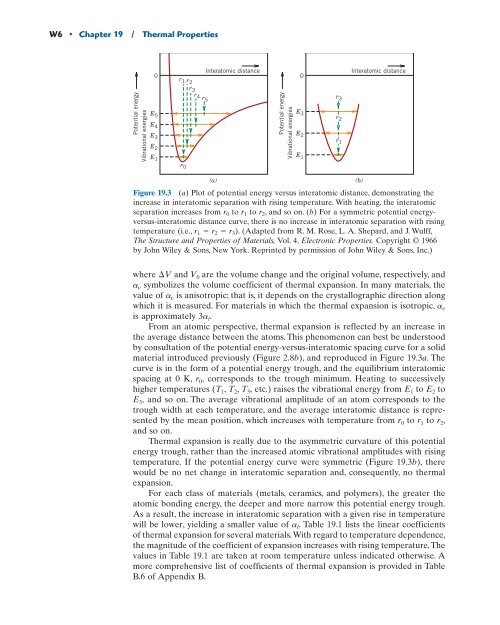
Figure <strong>19</strong>.3 (a) Plot of potential energy versus interatomic distance, demonstrating the<br />
increase in interatomic separation with rising temperature. With heating, the interatomic<br />
separation increases from r0 to r1 to r2, and so on. (b) For a symmetric potential energyversus-interatomic<br />
distance curve, there is no increase in interatomic separation with rising<br />
temperature (i.e., r1 r2 r3). (Adapted from R. M. Rose, L. A. Shepard, and J. Wulff,<br />
The Structure and <strong>Properties</strong> of Materials, Vol. 4, Electronic <strong>Properties</strong>. Copyright © <strong>19</strong>66<br />
by John Wiley & Sons, New York. Reprinted by permission of John Wiley & Sons, Inc.)<br />
where ¢V and V0 are the volume change and the original volume, respectively, and<br />
av symbolizes the volume coefficient of thermal expansion. In many materials, the<br />
value of av is anisotropic; that is, it depends on the crystallographic direction along<br />
which it is measured. For materials in which the thermal expansion is isotropic, av is approximately 3al. From an atomic perspective, thermal expansion is reflected by an increase in<br />
the average distance between the atoms. This phenomenon can best be understood<br />
by consultation of the potential energy-versus-interatomic spacing curve for a solid<br />
material introduced previously (Figure 2.8b), and reproduced in Figure <strong>19</strong>.3a.The<br />
curve is in the form of a potential energy trough, and the equilibrium interatomic<br />
spacing at 0 K, r0, corresponds to the trough minimum. Heating to successively<br />
higher temperatures ( T1, T2, T3, etc.) raises the vibrational energy from E1 to E2 to<br />
E3, and so on. The average vibrational amplitude of an atom corresponds to the<br />
trough width at each temperature, and the average interatomic distance is represented<br />
by the mean position, which increases with temperature from r0 to r1 to r2, and so on.<br />
<strong>Thermal</strong> expansion is really due to the asymmetric curvature of this potential<br />
energy trough, rather than the increased atomic vibrational amplitudes with rising<br />
temperature. If the potential energy curve were symmetric (Figure <strong>19</strong>.3b), there<br />
would be no net change in interatomic separation and, consequently, no thermal<br />
expansion.<br />
For each class of materials (metals, ceramics, and polymers), the greater the<br />
atomic bonding energy, the deeper and more narrow this potential energy trough.<br />
As a result, the increase in interatomic separation with a given rise in temperature<br />
will be lower, yielding a smaller value of al. Table <strong>19</strong>.1 lists the linear coefficients<br />
of thermal expansion for several materials.With regard to temperature dependence,<br />
the magnitude of the coefficient of expansion increases with rising temperature.The<br />
values in Table <strong>19</strong>.1 are taken at room temperature unless indicated otherwise. A<br />
more comprehensive list of coefficients of thermal expansion is provided in Table<br />
B.6 of Appendix B.<br />
0<br />
E 3<br />
E 2<br />
E 1<br />
r 3<br />
r 2<br />
r 1<br />
Interatomic distance