Ionospheric Scintillation Monitoring - ESA Space Weather Web Server
Ionospheric Scintillation Monitoring - ESA Space Weather Web Server
Ionospheric Scintillation Monitoring - ESA Space Weather Web Server

You also want an ePaper? Increase the reach of your titles
YUMPU automatically turns print PDFs into web optimized ePapers that Google loves.
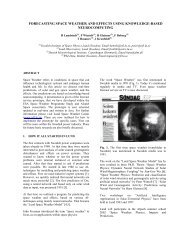
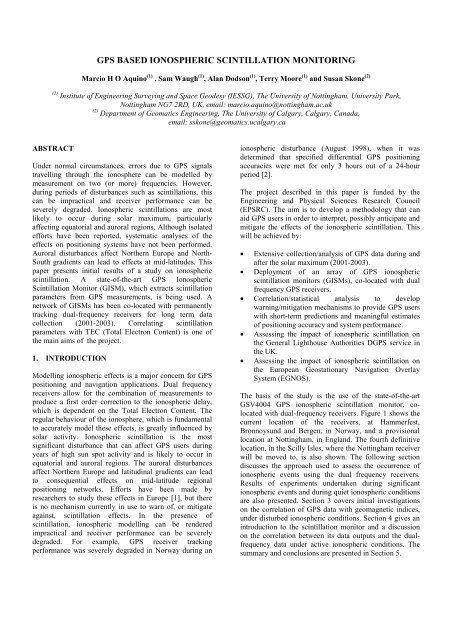
GPS BASED IONOSPHERIC SCINTILLATION MONITORING<br />
Marcio H O Aquino (1) , Sam Waugh (1) , Alan Dodson (1) , Terry Moore (1) and Susan Skone (2)<br />
(1) Institute of Engineering Surveying and <strong>Space</strong> Geodesy (IESSG), The University of Nottingham, University Park,<br />
Nottingham NG7 2RD, UK, email: marcio.aquino@nottingham.ac.uk<br />
(2) Department of Geomatics Engineering, The University of Calgary, Calgary, Canada,<br />
email: sskone@geomatics.ucalgary.ca<br />
ABSTRACT<br />
Under normal circumstances, errors due to GPS signals<br />
travelling through the ionosphere can be modelled by<br />
measurement on two (or more) frequencies. However,<br />
during periods of disturbances such as scintillations, this<br />
can be impractical and receiver performance can be<br />
severely degraded. <strong>Ionospheric</strong> scintillations are most<br />
likely to occur during solar maximum, particularly<br />
affecting equatorial and auroral regions. Although isolated<br />
efforts have been reported, systematic analyses of the<br />
effects on positioning systems have not been performed.<br />
Auroral disturbances affect Northern Europe and North-<br />
South gradients can lead to effects at mid-latitudes. This<br />
paper presents initial results of a study on ionospheric<br />
scintillation. A state-of-the-art GPS <strong>Ionospheric</strong><br />
<strong>Scintillation</strong> Monitor (GISM), which extracts scintillation<br />
parameters from GPS measurements, is being used. A<br />
network of GISMs has been co-located with permanently<br />
tracking dual-frequency receivers for long term data<br />
collection (2001-2003). Correlating scintillation<br />
parameters with TEC (Total Electron Content) is one of<br />
the main aims of the project.<br />
1. INTRODUCTION<br />
Modelling ionospheric effects is a major concern for GPS<br />
positioning and navigation applications. Dual frequency<br />
receivers allow for the combination of measurements to<br />
produce a first order correction to the ionospheric delay,<br />
which is dependent on the Total Electron Content. The<br />
regular behaviour of the ionosphere, which is fundamental<br />
to accurately model these effects, is greatly influenced by<br />
solar activity. <strong>Ionospheric</strong> scintillation is the most<br />
significant disturbance that can affect GPS users during<br />
years of high sun spot activity and is likely to occur in<br />
equatorial and auroral regions. The auroral disturbances<br />
affect Northern Europe and latitudinal gradients can lead<br />
to consequential effects on mid-latitude regional<br />
positioning networks. Efforts have been made by<br />
researchers to study these effects in Europe [1], but there<br />
is no mechanism currently in use to warn of, or mitigate<br />
against, scintillation effects. In the presence of<br />
scintillation, ionospheric modelling can be rendered<br />
impractical and receiver performance can be severely<br />
degraded. For example, GPS receiver tracking<br />
performance was severely degraded in Norway during an<br />
ionospheric disturbance (August 1998), when it was<br />
determined that specified differential GPS positioning<br />
accuracies were met for only 3 hours out of a 24-hour<br />
period [2].<br />
The project described in this paper is funded by the<br />
Engineering and Physical Sciences Research Council<br />
(EPSRC). The aim is to develop a methodology that can<br />
aid GPS users in order to interpret, possibly anticipate and<br />
mitigate the effects of the ionospheric scintillation. This<br />
will be achieved by:<br />
• Extensive collection/analysis of GPS data during and<br />
after the solar maximum (2001-2003).<br />
• Deployment of an array of GPS ionospheric<br />
scintillation monitors (GISMs), co-located with dual<br />
frequency GPS receivers.<br />
• Correlation/statistical analysis to develop<br />
warning/mitigation mechanisms to provide GPS users<br />
with short-term predictions and meaningful estimates<br />
of positioning accuracy and system performance.<br />
• Assessing the impact of ionospheric scintillation on<br />
the General Lighthouse Authorities DGPS service in<br />
the UK.<br />
• Assessing the impact of ionospheric scintillation on<br />
the European Geostationary Navigation Overlay<br />
System (EGNOS).<br />
The basis of the study is the use of the state-of-the-art<br />
GSV4004 GPS ionospheric scintillation monitor, colocated<br />
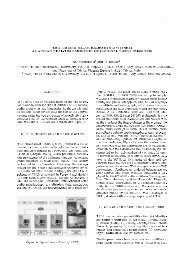
with dual-frequency receivers. Figure 1 shows the<br />
current location of the receivers, at Hammerfest,<br />
Bronnoysund and Bergen, in Norway, and a provisional<br />
location at Nottingham, in England. The fourth definitive<br />
location, in the Scilly Isles, where the Nottingham receiver<br />
will be moved to, is also shown. The following section<br />
discusses the approach used to assess the occurrence of<br />
ionospheric events using the dual frequency receivers.<br />
Results of experiments undertaken during significant<br />
ionospheric events and during quiet ionospheric conditions<br />
are also presented. Section 3 covers initial investigations<br />
on the correlation of GPS data with geomagnetic indices,<br />
under disturbed ionospheric conditions. Section 4 gives an<br />
introduction to the scintillation monitor and a discussion<br />
on the correlation between its data outputs and the dualfrequency<br />
data under active ionospheric conditions. The<br />
summary and conclusions are presented in Section 5.
NOTTINGHAM<br />
Figure 1 – The tracking network<br />
2. THE DUAL-FREQUENCY APPROACH<br />
<strong>Scintillation</strong>s can make the phase of both L1 and L2 GPS<br />
signals change suddenly by several cycles, leading to<br />
temporary loss of signal (cycle slips). This type of<br />
scintillation can be detected by using L1 and L2<br />
measurements to derive the gradient of ionospheric<br />
refraction. Dual frequency GPS data collected globally are<br />
currently being used to detect and measure ionospheric<br />
irregularities and scintillation effects, for example as part<br />
of the US National <strong>Space</strong> <strong>Weather</strong> Program (NSWP). The<br />
IGS (International GPS Service) is also engaged in<br />
monitoring high solar activities through dual frequency<br />
data collected from its global GPS network.<br />
Our initial approach to model TEC using the co-located<br />
dual-frequency receivers is based on the analysis of the<br />
undifferenced form of the ‘geometry-free’ carrier phase<br />
observable [3]. When this observable is analysed within a<br />
limited period of time, for example a two-hour session, the<br />
remaining effects, such as carrier phase multipath and<br />
interfrequency biases, are assumed to be absorbed by the<br />
phase ambiguity in the solution. The ionospheric delay is<br />
modelled deterministically, using a single layer model,<br />
assuming that all free-electrons are concentrated in an<br />
infinitesimally thin shell of the ionosphere.<br />
Initial experiments were based on the analysis of data from<br />
individual stations, so that correlation between TEC<br />
variations and scintillation data from the co-located<br />
GSV4004 could be directly investigated. For that purpose,<br />
TEC representation was given by a two-dimensional<br />
Taylor series expansion. This deterministic model is<br />
available in version 4.2 of the Bernese GPS software [3],<br />
which was used for the analysis. This approach is<br />
particularly suitable for analysis of the residuals when the<br />
model is fit to a short session, such as the proposed two<br />
hours of data. Irregularities in the residuals may be<br />
associated with scintillation. The corresponding TEC<br />
results are realistic, provided that one solely uses the phase<br />
observable. However, associated with the TEC<br />
parameterisation, discontinuities may occur at the session<br />
boundaries [4].<br />
The model was initially applied to a series of two-hour<br />
sessions, covering three different days, using data from the<br />
IGS station Tromso, in Norway. One day at the low of the<br />
solar cycle (25 August 1996) and another two days at the<br />
peak of the cycle, the first when the ionosphere was not<br />
especially active (20 August 2000) and the second when a<br />
major geomagnetic storm occurred (02 April 2001) were<br />
selected. Figure 2 depicts the residuals for all satellites,<br />
when the two-hour sessions are plotted together in a 24<br />
hours time span, for each of the three days. The residuals<br />
are represented in millimetres on the vertical axis. The<br />
difference in the state of the ionosphere can be clearly seen<br />
by the residuals time series. The longer wavelengths and<br />
smaller amplitudes are visible during the quieter periods,<br />
while mostly shorter wavelengths and larger amplitudes<br />
occurred during the geomagnetic storm.<br />
+ 1000 mm<br />
0 mm<br />
- 750 mm<br />
+ 1000 mm<br />
0 mm<br />
- 750 mm<br />
+ 1000 mm<br />
0 mm<br />
- 750 mm<br />
25 Aug 96<br />
20 Aug 00<br />
02 Apr 01<br />
Time - 24 hours (12 two-hour sessions)<br />
Figure 2: Residual analysis – Tromso<br />
Another approach to assess the presence of irregularities<br />
such as scintillation is by analysing the time series of TEC<br />
variations at a specific station. Figure 3 shows the analysis<br />
of a more recent ionospheric event, which occurred<br />
between the 5 th and the 7 th November 2001. In this figure<br />
TEC variations observed at three different latitudes are<br />
presented. The series at the top corresponds to Tromso, at<br />
a latitude of approximately 70 o north, followed by<br />
Lerwick, at approximately 60 o and at the bottom by<br />
Nottingham, at approximately 53 o . The data rate is 30<br />
seconds and the TEC changes for all satellites are<br />
represented in the vertical axis in TEC units. The total<br />
time span (horizontal axis of the time series) is 72 hours<br />
(from 5 th to 7 th November). A latitudinal gradient is clearly<br />
seen. Also visible is the correspondence in time between<br />
noticeable activity at the three different sites.
Lat 70 o N<br />
Long 19 o E<br />
Lat 60 o N<br />
Long 01 o W<br />
Lat 53 o N<br />
Long 01 o W<br />
Tromso<br />
Lerwick<br />
Nottingham<br />
Time - 72 hours (36 two-hour sessions)<br />
Figure 3: scatter plot of TEC variations at varying latitudes<br />
during ionospheric storm on 6 th November 2001<br />
3. CORRELATION WITH GEOMAGNETIC<br />
INDICES<br />
Many researchers have discussed the correlation between<br />
the Kp magnetic activity index and the occurrence of<br />
ionospheric scintillation [5] [6]. This index is computed<br />
from the K index of a number of magnetic observatories<br />
globally distributed around auroral latitudes. The K index<br />
gives a local measure of geomagnetic activity relative to a<br />
quiet day for each participating site. Both Kp and K vary<br />
from 0 to 9, with a value of 9 indicating a very high level<br />
of magnetic activity.<br />
A three hourly K index, obtained from a magnetometer<br />
situated at the British Geological Survey's Lerwick<br />
observatory, was compared with the time series of dualfrequency<br />
residuals from a permanent GPS receiver<br />
located in Lerwick, on the Shetland Islands. A 24 hours<br />
time period on 15 July 2000 was chosen for the analysis,<br />
when one of the greatest geomagnetic storms ever<br />
recorded occurred. The result is shown in the plot of figure<br />
4, where the suggested correlation can be clearly seen. The<br />
advantage of establishing this correlation is that the K<br />
index can be predicted and may be potentially used in a<br />
warning mechanism.<br />
K index<br />
10<br />
9<br />
8<br />
7<br />
6<br />
5<br />
4<br />
3<br />
2<br />
1<br />
0<br />
Time - 24 hours (12 two-hour sessions), 15 July 2000<br />
Figure 4: Correlation between residuals and the K index<br />
for Lerwick<br />
Figure 5 shows an additional correlation analysis,<br />
involving data from the same station (Lerwick) on 31<br />
800<br />
600<br />
400<br />
200<br />
0<br />
-200<br />
-400<br />
-600<br />
-800<br />
TEC residuals (mm)<br />
March 2001, when another significant ionospheric event<br />
took place. In this figure the K index standard deviation,<br />
the GPS pseudorange-based 3D positioning errors and<br />
TEC variations are compared. The purpose of the figure is<br />
to establish the correspondence in time of the<br />
irregularities, which show a high degree of correlation.<br />
K Index Stdev<br />
GPS 3D<br />
Positioning Errors<br />
TEC Variations<br />
4 0 0 . 0<br />
3 5 0 . 0<br />
3 0 0 . 0<br />
2 5 0 . 0<br />
2 0 0 . 0<br />
1 5 0 . 0<br />
1 0 0 . 0<br />
5 0 . 0<br />
0 . 0<br />
1 2 0 . 0<br />
1 0 0 . 0<br />
8 0 . 0<br />
6 0 . 0<br />
4 0 . 0<br />
2 0 . 0<br />
0 . 0<br />
L e r w ic k K in d e x H o u r ly S t a n d a r d D e v ia t io n 3 1 M a r c h 2 0 0 1<br />
L erw ic k - 3D P o s itio n E rro r - 31 M a rch 20 0 1<br />
Time - 24 hours on 31 March 2001<br />
Figure 5: correlation between K index standard deviation,<br />
GPS 3D positioning errors and TEC variations during<br />
ionospheric storm on 31 March 2001<br />
4. THE SCINTILLATION MONITOR AND<br />
CORRELATION WITH THE DUAL-FREQUENCY<br />
RECEIVERS<br />
The dual-frequency GSV4004 GPS <strong>Ionospheric</strong><br />
<strong>Scintillation</strong> Monitor has been chosen for use in the<br />
project. The GSV4004 is less expensive than the geodetic<br />
receivers currently being used to monitor TEC world-wide<br />
and may prove to be of the same practical use. The<br />
GSV4004 estimates amplitude and phase scintillation<br />
parameters and code/carrier divergence from the L1<br />
signals. It also computes TEC from combined L1 and L2<br />
pseudoranges and carrier phase. TEC changes are also<br />
output, computed from the carrier phase. The GSV4004<br />
uses wide bandwidth tracking loops and an internal phase<br />
stable ovenised crystal oscillator to compare phase<br />
measurements with actual carrier phase GPS observations<br />
[7]. It continues tracking under scintillation and<br />
computes/outputs these parameters, rather than sensing the<br />
effects of the scintillation through performance<br />
degradation. Other receivers of this family have been<br />
deployed elsewhere for the purpose of investigating the<br />
ionospheric scintillations. Currently only a limited amount<br />
of results, of analyses based on their use, have been<br />
published (e.g. [6]).<br />
The following sequence of figures (Figures 6, 7 and 8)<br />
show the correlation in time between output data from the<br />
GSV4004 and the co-located dual-frequency receiver for a<br />
typical satellite, during the ionospheric event of<br />
March/April 2001. All figures have the horizontal axis to<br />
the same scale to allow a direct comparison of the time<br />
series. Figure 8 has a shorter axis because the dualfrequency<br />
data session ended about 30 minutes earlier.
Phase Smoothed TEC (TECU)<br />
25<br />
20<br />
15<br />
10<br />
5<br />
0<br />
-5<br />
-10<br />
-15<br />
-20<br />
22 23 0 1 2<br />
Time Of Day (Hours): 01 - 02 April 2001<br />
Phase Smoothed TEC<br />
dTEC dt0<br />
dTEC dt15<br />
dTEC dt30<br />
dTEC dt45<br />
Figure 6: TEC changes from the GSV4004<br />
Phase Sigma (Radians)<br />
0.3<br />
0.25<br />
0.2<br />
0.15<br />
0.1<br />
0.05<br />
Phase Sigma 1s<br />
Phase Sigma 3s<br />
Phase Sigma 10s<br />
Phase Sigma 30s<br />
Phase Sigma 60s<br />
Elevation angle<br />
0<br />
22 23 0<br />
Time of Day (hours): 01 - 02 April 2001<br />
1 2<br />
Figure 7: Phase scintillation from the GSV4004<br />
1<br />
0.5<br />
0<br />
-0.5<br />
-1<br />
-1.5<br />
-2<br />
22 23<br />
Residuals in TECU<br />
0<br />
Time of Day (hours): 01 - 02 April 2001<br />
Figure 8: Residuals from the dual-frequency receiver<br />
Figure 6 gives the phase smoothed TEC (smoother curve<br />
with a low near midnight) and TEC change time series for<br />
PRN 10, ranging from 22:00 UT on 01 April 2001 to<br />
about 02:30 UT on 02 April 2001. The GSV4004 output<br />
carrier phase based TEC changes (dTEC) at every 15<br />
seconds, giving four different values within any one<br />
minute (curves showing more activity before midnight).<br />
All values are plotted simultaneously. Figure 7 shows the<br />
standard deviation of the carrier phase output. The receiver<br />
collects 50 raw phase measurements a second and for<br />
every minute the statistics of the residuals are computed<br />
over periods of 1 second, 3 seconds, 10 seconds, 30<br />
seconds and 60 seconds [8]. All values are plotted in<br />
Figure 7. Figure 8 is the plot of the residuals for satellite<br />
PRN 10, as given by the Bernese dual-frequency model.<br />
The correlation between the scintillation and TEC data<br />
given by the GSV4004 and the dual-frequency residuals is<br />
encouraging.<br />
5. SUMMARY AND CONCLUSIONS<br />
The IESSG at the University of Nottingham is engaged in<br />
the first large scale European initiative to study and<br />
monitor ionospheric scintillation in Northern Europe using<br />
GPS measurements. Four scintillation monitors, co-located<br />
1<br />
2<br />
0<br />
1<br />
0.8<br />
0.6<br />
0.4<br />
0.2<br />
0<br />
-0.2<br />
-0.4<br />
-0.6<br />
-0.8<br />
-1<br />
80<br />
70<br />
60<br />
50<br />
40<br />
30<br />
20<br />
10<br />
Elevation Angle (Degrees<br />
Delta TEC (TECU)<br />
with dual-frequency GPS receivers, have been deployed in<br />
Northern Norway and Nottingham, and are continuously<br />
logging data. In this paper we presented our initial<br />
approach to correlating scintillation data with the TEC<br />
behaviour given by dual-frequency data. The aim is to<br />
validate the use of the scintillation monitor in a regional<br />
scheme to monitor ionospheric scintillation and possibly<br />
warn GPS users of its occurrence. During the time span of<br />
the project an extensive archive of data will be gathered,<br />
which will be valuable for future research on ionospheric<br />
scintillation.<br />
An analysis technique based on dual-frequency GPS data<br />
has demonstrated it can provide an indication of the<br />
occurrence of scintillation. The analysis also provided<br />
good correlation with the scintillation monitor data output<br />
and with the geomagnetic K index. These are just initial<br />
steps on the way to achieving the wider goals of the<br />
project.<br />
6. REFERENCES<br />
1. Warnant R and Pottiaux E (1999) - The Increase of the<br />
<strong>Ionospheric</strong> Activity and its Effect on GPS, Proceedings<br />
International Symposium on GPS, GPS 99, Tsukuba,<br />
Japan, October 1999.<br />
2. Skone, S and deJong, M (1999) - Impact and<br />
Observations of Geomagnetic Substorms in a GPS<br />
Network, University of Calgary, Canada, 1999<br />
3. Hugentobler, U, Schaer, S and Fridez, P (2001) –<br />
Bernese GPS Software Version 4.2 User Manual,<br />
Astronomical Institute, University of Bern, Switzerland.<br />
4. Schaer, S – Personal communication (e-mail), 2001<br />
5. Skone, S and Knudsen, K (2001) – GPS Receiver<br />
Tracking Performance under Equatorial and High latitude<br />
<strong>Ionospheric</strong> <strong>Scintillation</strong>s, Proceedings of the 3 rd<br />
International Symposyum Mobile Mapping Technology,<br />
Cairo, Egypt, Jan 2001<br />
6. Doherty, P H, Delay, S H, Valladares, C E and<br />
Klobuchar, J (2000) – <strong>Ionospheric</strong> <strong>Scintillation</strong> Effects in<br />
the Equatorial and Auroral Regions, Proceedings of ION<br />
GPS 2000, Salt Lake City, USA, Sep 2000.<br />
7. Van Dierendonck, A J (1999) - Measuring <strong>Ionospheric</strong><br />
<strong>Scintillation</strong> Effects from GPS Signals, GPS Silicon<br />
Valley, California, USA, 1999<br />
8. GPS Silicon Valley (2001) – GSV4004 <strong>Ionospheric</strong><br />
<strong>Scintillation</strong> and TEC Monitor User’s Manual, California,<br />
USA, 2001