Ionospheric Scintillation Monitoring - ESA Space Weather Web Server
Ionospheric Scintillation Monitoring - ESA Space Weather Web Server
Ionospheric Scintillation Monitoring - ESA Space Weather Web Server

Create successful ePaper yourself
Turn your PDF publications into a flip-book with our unique Google optimized e-Paper software.
Lat 70 o N<br />
Long 19 o E<br />
Lat 60 o N<br />
Long 01 o W<br />
Lat 53 o N<br />
Long 01 o W<br />
Tromso<br />
Lerwick<br />
Nottingham<br />
Time - 72 hours (36 two-hour sessions)<br />
Figure 3: scatter plot of TEC variations at varying latitudes<br />
during ionospheric storm on 6 th November 2001<br />
3. CORRELATION WITH GEOMAGNETIC<br />
INDICES<br />
Many researchers have discussed the correlation between<br />
the Kp magnetic activity index and the occurrence of<br />
ionospheric scintillation [5] [6]. This index is computed<br />
from the K index of a number of magnetic observatories<br />
globally distributed around auroral latitudes. The K index<br />
gives a local measure of geomagnetic activity relative to a<br />
quiet day for each participating site. Both Kp and K vary<br />
from 0 to 9, with a value of 9 indicating a very high level<br />
of magnetic activity.<br />
A three hourly K index, obtained from a magnetometer<br />
situated at the British Geological Survey's Lerwick<br />
observatory, was compared with the time series of dualfrequency<br />
residuals from a permanent GPS receiver<br />
located in Lerwick, on the Shetland Islands. A 24 hours<br />
time period on 15 July 2000 was chosen for the analysis,<br />
when one of the greatest geomagnetic storms ever<br />
recorded occurred. The result is shown in the plot of figure<br />
4, where the suggested correlation can be clearly seen. The<br />
advantage of establishing this correlation is that the K<br />
index can be predicted and may be potentially used in a<br />
warning mechanism.<br />
K index<br />
10<br />
9<br />
8<br />
7<br />
6<br />
5<br />
4<br />
3<br />
2<br />
1<br />
0<br />
Time - 24 hours (12 two-hour sessions), 15 July 2000<br />
Figure 4: Correlation between residuals and the K index<br />
for Lerwick<br />
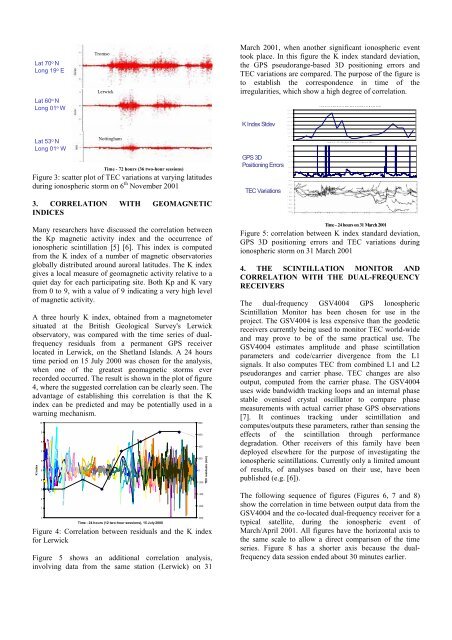
Figure 5 shows an additional correlation analysis,<br />
involving data from the same station (Lerwick) on 31<br />
800<br />
600<br />
400<br />
200<br />
0<br />
-200<br />
-400<br />
-600<br />
-800<br />
TEC residuals (mm)<br />
March 2001, when another significant ionospheric event<br />
took place. In this figure the K index standard deviation,<br />
the GPS pseudorange-based 3D positioning errors and<br />
TEC variations are compared. The purpose of the figure is<br />
to establish the correspondence in time of the<br />
irregularities, which show a high degree of correlation.<br />
K Index Stdev<br />
GPS 3D<br />
Positioning Errors<br />
TEC Variations<br />
4 0 0 . 0<br />
3 5 0 . 0<br />
3 0 0 . 0<br />
2 5 0 . 0<br />
2 0 0 . 0<br />
1 5 0 . 0<br />
1 0 0 . 0<br />
5 0 . 0<br />
0 . 0<br />
1 2 0 . 0<br />
1 0 0 . 0<br />
8 0 . 0<br />
6 0 . 0<br />
4 0 . 0<br />
2 0 . 0<br />
0 . 0<br />
L e r w ic k K in d e x H o u r ly S t a n d a r d D e v ia t io n 3 1 M a r c h 2 0 0 1<br />
L erw ic k - 3D P o s itio n E rro r - 31 M a rch 20 0 1<br />
Time - 24 hours on 31 March 2001<br />
Figure 5: correlation between K index standard deviation,<br />
GPS 3D positioning errors and TEC variations during<br />
ionospheric storm on 31 March 2001<br />
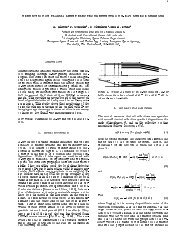
4. THE SCINTILLATION MONITOR AND<br />
CORRELATION WITH THE DUAL-FREQUENCY<br />
RECEIVERS<br />
The dual-frequency GSV4004 GPS <strong>Ionospheric</strong><br />
<strong>Scintillation</strong> Monitor has been chosen for use in the<br />
project. The GSV4004 is less expensive than the geodetic<br />
receivers currently being used to monitor TEC world-wide<br />
and may prove to be of the same practical use. The<br />
GSV4004 estimates amplitude and phase scintillation<br />
parameters and code/carrier divergence from the L1<br />
signals. It also computes TEC from combined L1 and L2<br />
pseudoranges and carrier phase. TEC changes are also<br />
output, computed from the carrier phase. The GSV4004<br />
uses wide bandwidth tracking loops and an internal phase<br />
stable ovenised crystal oscillator to compare phase<br />
measurements with actual carrier phase GPS observations<br />
[7]. It continues tracking under scintillation and<br />
computes/outputs these parameters, rather than sensing the<br />
effects of the scintillation through performance<br />
degradation. Other receivers of this family have been<br />
deployed elsewhere for the purpose of investigating the<br />
ionospheric scintillations. Currently only a limited amount<br />
of results, of analyses based on their use, have been<br />
published (e.g. [6]).<br />
The following sequence of figures (Figures 6, 7 and 8)<br />
show the correlation in time between output data from the<br />
GSV4004 and the co-located dual-frequency receiver for a<br />
typical satellite, during the ionospheric event of<br />
March/April 2001. All figures have the horizontal axis to<br />
the same scale to allow a direct comparison of the time<br />
series. Figure 8 has a shorter axis because the dualfrequency<br />
data session ended about 30 minutes earlier.