The CES EduPack Eco Audit Tool ? A White Paper - MAELabs UCSD
The CES EduPack Eco Audit Tool ? A White Paper - MAELabs UCSD
The CES EduPack Eco Audit Tool ? A White Paper - MAELabs UCSD

You also want an ePaper? Increase the reach of your titles
YUMPU automatically turns print PDFs into web optimized ePapers that Google loves.
5. Case studies<br />
An eco audit is a fast initial assessment. It identifies the<br />
phases of life – material, manufacture, transport and use<br />
– that carry the highest demand for energy or create the<br />
greatest burden of emissions. It points the finger, so to<br />
speak, identifying where the greatest gains might be<br />
made. Often, one phase of life is, in eco terms,<br />
overwhelmingly dominant, accounting for 60% or more<br />
of the energy and carbon totals. This difference is so<br />
large that the imprecision in the data and the<br />
ambiguities in the modeling, are not an issue; the<br />
dominance remains even when the most extreme values<br />
are used. It then makes sense to focus first on this<br />
dominant phase, since it is here that the potential<br />
innovative material choice to reduce energy and carbon<br />
are greatest. As we shall see later, material substitution<br />
has more complex aspects – there are trade-offs to be<br />
considered – but for now we focus on the simple audit.<br />
This section outlines case studies that bring out the<br />
strengths and weaknesses of the <strong>Eco</strong> <strong>Audit</strong> <strong>Tool</strong>. Its use<br />
is best illustrated by a case study of extreme simplicity –<br />
that of a PET drink bottle – since this allows the inputs<br />
and outputs to be shown in detail. <strong>The</strong> case studies that<br />
follow it are presented in less detail.<br />
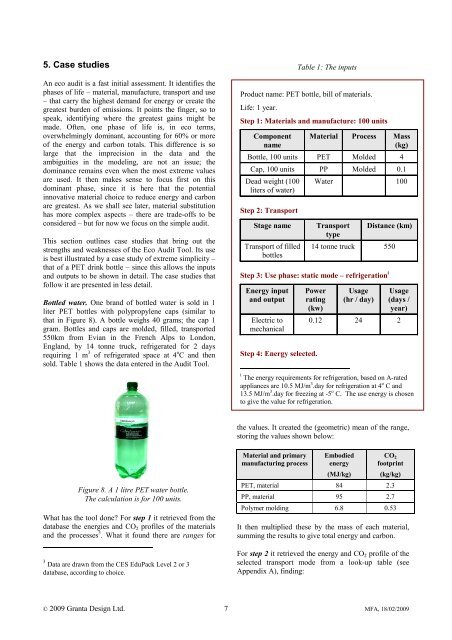
Bottled water. One brand of bottled water is sold in 1<br />
liter PET bottles with polypropylene caps (similar to<br />
that in Figure 8). A bottle weighs 40 grams; the cap 1<br />
gram. Bottles and caps are molded, filled, transported<br />
550km from Evian in the French Alps to London,<br />
England, by 14 tonne truck, refrigerated for 2 days<br />
requiring 1 m 3 of refrigerated space at 4 o C and then<br />
sold. Table 1 shows the data entered in the <strong>Audit</strong> <strong>Tool</strong>.<br />
Figure 8. A 1 litre PET water bottle.<br />
<strong>The</strong> calculation is for 100 units.<br />
What has the tool done? For step 1 it retrieved from the<br />
database the energies and CO2 profiles of the materials<br />
and the processes 3 . What it found there are ranges for<br />
3 Data are drawn from the <strong>CES</strong> <strong>EduPack</strong> Level 2 or 3<br />
database, according to choice.<br />
the values. It created the (geometric) mean of the range,<br />
storing the values shown below:<br />
Material and primary<br />
manufacturing process<br />
Table 1: <strong>The</strong> inputs<br />
Product name: PET bottle, bill of materials.<br />
Life: 1 year.<br />
Step 1: Materials and manufacture: 100 units<br />
Component<br />
name<br />
Material Process Mass<br />
(kg)<br />
Bottle, 100 units PET Molded 4<br />
Cap, 100 units PP Molded 0.1<br />
Dead weight (100<br />
liters of water)<br />
Step 2: Transport<br />
Stage name Transport<br />
type<br />
Transport of filled<br />
bottles<br />
Water 100<br />
Embodied<br />
energy<br />
(MJ/kg)<br />
Distance (km)<br />
14 tonne truck 550<br />
Step 3: Use phase: static mode – refrigeration i<br />
Energy input<br />
and output<br />
Electric to<br />
mechanical<br />
Power<br />
rating<br />
(kw)<br />
Step 4: Energy selected.<br />
Usage<br />
(hr / day)<br />
CO 2<br />
footprint<br />
(kg/kg)<br />
PET, material 84 2.3<br />
PP, material 95 2.7<br />
Polymer molding 6.8 0.53<br />
Usage<br />
(days /<br />
year)<br />
0.12 24 2<br />
i <strong>The</strong> energy requirements for refrigeration, based on A-rated<br />
appliances are 10.5 MJ/m 3 .day for refrigeration at 4 o C and<br />
13.5 MJ/m 3 .day for freezing at -5 o C. <strong>The</strong> use energy is chosen<br />
to give the value for refrigeration.<br />
It then multiplied these by the mass of each material,<br />
summing the results to give total energy and carbon.<br />
For step 2 it retrieved the energy and CO2 profile of the<br />
selected transport mode from a look-up table (see<br />
Appendix A), finding:<br />
© 2009 Granta Design Ltd. 7 MFA, 18/02/2009