Neutrino Mixing - Particle Data Group - CERN
Neutrino Mixing - Particle Data Group - CERN
Neutrino Mixing - Particle Data Group - CERN

Create successful ePaper yourself
Turn your PDF publications into a flip-book with our unique Google optimized e-Paper software.
Citation: K. Nakamura et al. (<strong>Particle</strong> <strong>Data</strong> <strong>Group</strong>), JP G 37, 075021 (2010) and 2011 partial update for the 2012 edition (URL: http://pdg.lbl.gov)<br />
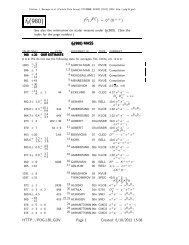
10 AMBROSIO 04 obtained this result, without using the absolute normalization of the<br />
neutrino flux, by combining the angular distribution of upward through-going muon tracks<br />
with Eμ > 1GeV,Nlow and Nhigh , and the numbers of InDown + UpStop and InUp<br />
events. Here, Nlow and Nhigh are the number of events with reconstructed neutrino<br />
energies < 30 GeV and > 130 GeV, respectively. InDown and InUp represent events<br />
with downward and upward-going tracks starting inside the detector due to neutrino<br />
interactions, while UpStop represents entering upward-going tracks which stop in the<br />
detector. The best fit is for maximal mixing.<br />
11 ASHIE 04 obtained this result from the L(flight length)/E(estimated neutrino energy)<br />
distribution of νμ disappearance probability, using the Super-Kamiokande-I 1489 live-day<br />
atmospheric neutrino data.<br />
12 There are several islands of allowed region from this K2K analysis, extending to high<br />
values of Δm2 . We only include the one that overlaps atmospheric neutrino analyses.<br />
Thebestfitisformaximalmixing.<br />
13 AMBROSIO 03 obtained this result on the basis of the ratio R = Nlow /Nhigh ,where<br />
Nlow and Nhigh are the number of upward through-going muon events with reconstructed<br />
neutrino energy < 30 GeV and > 130 GeV, respectively. The data came from<br />
the full detector run started in 1994. The method of FELDMAN 98 is used to obtain<br />
the limits.<br />
14 AMBROSIO 03 obtained this result by using the ratio R and the angular distribution<br />
of the upward through-going muons. R is given in the previous note and the angular<br />
distribution is reported in AMBROSIO 01. The method of FELDMAN 98 is used to<br />
obtain the limits. The best fit is to maximal mixing.<br />
15 SANCHEZ 03 is based on an exposure of 5.9 kton yr. The result is obtained using a<br />
likelihood analysis of the neutrino L/E distribution for a selection μ flavor sample while<br />
the e-flavor sample provides flux normalization. The method of FELDMAN 98 is used<br />
to obtain the allowed region. The best fit is sin2 (2θ) = 0.97.<br />
16 AMBROSIO 01 result is based on the angular distribution of upward through-going muon<br />
tracks with Eμ > 1 GeV. The data came from three different detector configurations, but<br />
the statistics is largely dominated by the full detector run, from May 1994 to December<br />
2000. The total live time, normalized to the full detector configuration is 6.17 years.<br />
The best fit is obtained outside the physical region. The method of FELDMAN 98 is<br />
used to obtain the limits. The best fit is for maximal mixing.<br />
17 AMBROSIO 01 result is based on the angular distribution and normalization of upward<br />
through-going muon tracks with Eμ > 1 GeV. See the previous footnote.<br />
18 FUKUDA 99C obtained this result from a total of 537 live days of upward through-going<br />
muon data in Super-Kamiokande between April 1996 to January 1998. With a threshold<br />
of Eμ > 1.6 GeV, the observed flux is (1.74 ± 0.07 ± 0.02) × 10−13 cm−2s−1sr−1 .<br />
Thebestfitissin2 (2θ) = 0.95.<br />
19 FUKUDA 99D obtained this result from a simultaneous fitting to zenith angle distributions<br />
of upward-stopping and through-going muons. The flux of upward-stopping muons of<br />
minimum energy of 1.6 GeV measured between April 1996 and January 1998 is (0.39 ±<br />
0.04 ± 0.02) × 10−13 cm−2s−1sr−1 . This is compared to the expected flux of (0.73 ±<br />
0.16 (theoretical error)) × 10−13 cm−2s−1sr−1 . The best fit is to maximal mixing.<br />
20 FUKUDA 99D obtained this result from the zenith dependence of the upwardstopping/through-going<br />
flux ratio. The best fit is to maximal mixing.<br />
21 FUKUDA 98C obtained this result by an analysis of 33.0 kton yr atmospheric neutrino<br />
data. The best fit is for maximal mixing.<br />
22 HATAKEYAMA 98 obtained this result from a total of 2456 live days of upward-going<br />
muon data in Kamiokande between December 1985 and May 1995. With a threshold of<br />
Eμ > 1.6 GeV, the observed flux of upward through-going muons is (1.94±0.10 +0.07<br />
−0.06 )×<br />
10−13 cm−2s−1sr−1 . This is compared to the expected flux of (2.46 ± 0.54 (theoretical<br />
error)) × 10−13 cm−2s−1sr−1 . The best fit is for maximal mixing.<br />
HTTP://PDG.LBL.GOV Page 18 Created: 6/16/2011 12:06