Neutrino Mixing - Particle Data Group - CERN
Neutrino Mixing - Particle Data Group - CERN
Neutrino Mixing - Particle Data Group - CERN

Create successful ePaper yourself
Turn your PDF publications into a flip-book with our unique Google optimized e-Paper software.
Citation: K. Nakamura et al. (<strong>Particle</strong> <strong>Data</strong> <strong>Group</strong>), JP G 37, 075021 (2010) and 2011 partial update for the 2012 edition (URL: http://pdg.lbl.gov)<br />
the 25% theoretical error in the rate (20% in the flux and 15% in the cross section, added<br />
in quadrature). Within statistics, the observed deficit is uniform over the zenith angle.<br />
4 AMBROSIO 00 result is based on the combined samples of downgoing partially contained<br />
events and upgoing stopping events. These two subsamples could not be distinguished<br />
due to the lack of timing information. The result came from 4.1 live years of data<br />
taking with the full detector, from April 1994 to February 1999. The average energy<br />
of atmospheric muon neutrinos corresponding to this sample is 4 GeV. The first error is<br />
statistical, the second is the systematic error, dominated by the 25% theoretical error in<br />
the rate (20% in the flux and 15% in the cross section, added in quadrature). Within<br />
statistics, the observed deficit is uniform over the zenith angle.<br />
5 AMBROSIO 98 result is for all nadir angles and updates AHLEN 95 result. The lower<br />
cutoff on the muon energy is 1 GeV. In addition to the statistical and systematic errors,<br />
there is a Monte Carlo flux error (theoretical error) of ±0.13. With a neutrino oscillation<br />
hypothesis, the fit either to the flux or zenith distribution independently yields<br />
sin22θ=1.0 andΔ(m2 ) ∼ afewtimes10−3eV2 . However, the fit to the observed<br />
zenith distribution gives a maximum probability for χ2 of only 5% for the best oscillation<br />
hypothesis.<br />
6 CASPER 91 correlates showering/nonshowering signature of single-ring events with parent<br />
atmospheric-neutrino flavor. They find nonshowering (≈ νμ induced) fraction is<br />
0.41 ± 0.03 ± 0.02, as compared with expected 0.51 ± 0.05 (syst).<br />
7 AGLIETTA 89 finds no evidence for any anomaly in the neutrino flux. They define<br />
ρ = (measured number of νe ’s)/(measured number of νμ ’s). They report<br />
ρ(measured)=ρ(expected) = 0.96 +0.32<br />
−0.28 .<br />
8 From this data BOLIEV 81 obtain the limit Δ(m2 ) ≤ 6 × 10⁻³ eV2 for maximal<br />
mixing, νμ → νμ type oscillation.<br />
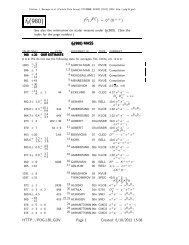
R(μ/total) R(μ/total) = = (Measured (Measured Ratio Ratio μ/total) μ/total) / / (Expected (Expected Ratio Ratio μ/total)<br />
μ/total)<br />
VALUE DOCUMENT ID TECN COMMENT<br />
•••We do not use the following data for averages, fits, limits, etc. •••<br />
1.1 +0.07<br />
−0.12 ±0.11 1 CLARK 97 IMB multi-GeV<br />
1 CLARK 97 obtained this result by an analysis of fully contained and partially contained<br />
events in the IMB water-Cherenkov detector with visible energy > 0.95 GeV.<br />
N N up(μ)/N up(μ)/N down(μ) down(μ)<br />
VALUE DOCUMENT ID TECN COMMENT<br />
•••We do not use the following data for averages, fits, limits, etc. •••<br />
0.551 +0.035<br />
−0.033 ±0.004 1 ASHIE 05 SKAM multi-GeV<br />
1 ASHIE 05 results are based on an exposure of 92 kton yr during the complete Super-<br />
Kamiokande I running period. The analyzed data sample consists of fully-contained<br />
single-ring μ-like events with visible energy > 1.33 GeV and partially-contained events.<br />
All partially-contained events are classified as μ-like. Upward-going events are those<br />
with −1 < cos(zenith angle) < −0.2 and downward-going events are those with 0.2<<br />
cos(zenith angle)