Neutrino Mixing - Particle Data Group - CERN
Neutrino Mixing - Particle Data Group - CERN
Neutrino Mixing - Particle Data Group - CERN

Create successful ePaper yourself
Turn your PDF publications into a flip-book with our unique Google optimized e-Paper software.
Citation: K. Nakamura et al. (<strong>Particle</strong> <strong>Data</strong> <strong>Group</strong>), JP G 37, 075021 (2010) and 2011 partial update for the 2012 edition (URL: http://pdg.lbl.gov)<br />
<strong>Neutrino</strong> <strong>Mixing</strong><br />
A REVIEW GOES HERE – Check our WWW List of Reviews<br />
(A) <strong>Neutrino</strong> fluxes and event ratios<br />
Events Events (observed/expected) (observed/expected) from from accelerator accelerator ν ν μ experiments.<br />
Some neutrino oscillation experiments compare the flux in two or more detectors. This<br />
is usually quoted as the ratio of the event rate in the far detector to the expected rate<br />
based on an extrapolation from the near detector in the absence of oscillations.<br />
VALUE DOCUMENT ID TECN COMMENT<br />
•••We do not use the following data for averages, fits, limits, etc. •••<br />
0.71±0.08<br />
0.64±0.05<br />
1 AHN<br />
2 MICHAEL<br />
06A<br />
06<br />
K2K<br />
MINS<br />
K2K to Super-K<br />
All charged current events<br />
0.71 +0.08<br />
−0.09<br />
3 ALIU 05 K2K KEK to Super-K<br />
0.70 +0.10<br />
−0.11<br />
4 AHN 03 K2K KEK to Super-K<br />
1 Based on the observation of 112 events when 158.1<br />
+9.2<br />
−8.6<br />
were expected without oscillations.<br />
Including not only the number of events but also the shape of the energy<br />
distribution, the evidence for oscillation is at the level of about 4.3 σ. Supersedes<br />
ALIU 05.<br />
2 This ratio is based on the observation of 215 events compared to an expectation of<br />
336 ± 14 without oscillations. See also ADAMSON 08.<br />
3 This ratio is based on the observation of 107 events at the far detector 250 km away<br />
from KEK, and an expectation of 151 +12<br />
−10 .<br />
4 This ratio is based on the observation of 56 events with an expectation of 80.1<br />
+6.2<br />
−5.4 .<br />
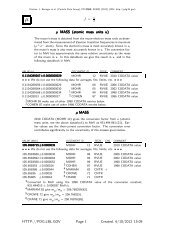
Events Events (observed/expected) (observed/expected) from from reactor reactor ν e experiments.<br />
The quoted values are the ratios of the measured reactor ν e event rate at the quoted<br />
distances, and the rate expected without oscillations. The expected rate is based on<br />
the experimental data for the most significant reactor fuels ( 235 U, 239 Pu, 241 Pu)<br />
andoncalculationsfor 238 U.<br />
VALUE DOCUMENT ID TECN COMMENT<br />
•••We do not use the following data for averages, fits, limits, etc. •••<br />
1.08 ±0.21 ±0.16 1 DENIZ 10 TEXO Kuo-Sheng reactor, 28 m<br />
0.658±0.044±0.047 2 ARAKI 05 KLND Japanese react. ∼ 180 km<br />
0.611±0.085±0.041 3 EGUCHI 03 KLND Japanese react. ∼ 180 km<br />
1.01 ±0.024±0.053 4 BOEHM 01 Palo Verde react. 0.75–0.89 km<br />
1.01 ±0.028±0.027 5 APOLLONIO 99 CHOZ Chooz reactors 1 km<br />
0.987±0.006±0.037 6 GREENWOOD 96 Savannah River, 18.2m<br />
0.988±0.004±0.05 ACHKAR 95 CNTR Bugey reactor, 15 m<br />
0.994±0.010±0.05 ACHKAR 95 CNTR Bugey reactor, 40 m<br />
0.915±0.132±0.05 ACHKAR 95 CNTR Bugey reactor, 95 m<br />
0.987±0.014±0.027 7 DECLAIS 94 CNTR Bugey reactor, 15 m<br />
0.985±0.018±0.034 KUVSHINN... 91 CNTR Rovno reactor<br />
1.05 ±0.02 ±0.05 VUILLEUMIER 82 Gösgen reactor<br />
0.955±0.035±0.110 8 KWON 81 νe p → e + n<br />
0.89 ±0.15 8 BOEHM 80 νe p → e + n<br />
HTTP://PDG.LBL.GOV Page 1 Created: 6/16/2011 12:06
Citation: K. Nakamura et al. (<strong>Particle</strong> <strong>Data</strong> <strong>Group</strong>), JP G 37, 075021 (2010) and 2011 partial update for the 2012 edition (URL: http://pdg.lbl.gov)<br />
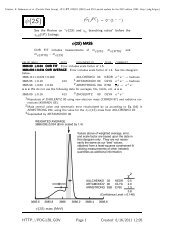
1 DENIZ 10 observe reactor νe e scattering with recoil kinetic energies 3–8 MeV using<br />
CsI(Tl) detectors. The observed rate is consistent with the Standard Model prediction,<br />
leading to a constraint on sin 2 θ W =0.251 ± 0.031(stat)±0.024(sys).<br />
2 Updated result of KamLAND, including the data used in EGUCHI 03. Note that the<br />
survival probabilities for different periods are not directly comparable because the effective<br />
baseline varies with power output of the reactor sources involved, and there were large<br />
variations in the reactor power production in Japan in 2003.<br />
3 EGUCHI 03 observe reactor neutrino disappearance at ∼ 180 km baseline to various<br />
Japanese nuclear power reactors.<br />
4 BOEHM 01 search for neutrino oscillations at 0.75 and 0.89 km distance from the Palo<br />
Verde reactors.<br />
5 APOLLONIO 99, APOLLONIO 98 search for neutrino oscillations at 1.1km fixed distance<br />
from Chooz reactors. They use ν e p → e + n in Gd-loaded scintillator target.<br />
APOLLONIO 99 supersedes APOLLONIO 98. See also APOLLONIO 03 for detailed<br />
description.<br />
6 GREENWOOD 96 search for neutrino oscillations at 18 m and 24 m from the reactor at<br />
Savannah River.<br />
7 DECLAIS 94 result based on integral measurement of neutrons only. Result is ratio<br />
of measured cross section to that expected in standard V-A theory. Replaced by<br />
ACHKAR 95.<br />
8 KWON 81 represents an analysis of a larger set of data from the same experiment as<br />
BOEHM 80.<br />
Atmospheric neutrinos<br />
<strong>Neutrino</strong>s and antineutrinos produced in the atmosphere induce μ-like and<br />
e-like events in underground detectors. The ratio of the numbers of the<br />
two kinds of events is defined as μ/e. It has the advantage that systematic<br />
effects, such as flux uncertainty, tend to cancel, for both experimental and<br />
theoretical values of the ratio. The “ratio of the ratios” of experimental<br />
to theoretical μ/e, R(μ/e), or that of experimental to theoretical μ/total,<br />
R(μ/total) with total = μ+e, is reported below. If the actual value is<br />
not unity, the value obtained in a given experiment may depend on the<br />
experimental conditions. In addition, the measured “up-down asymmetry”<br />
for μ (N up (μ)/N down (μ)) or e (N up (e)/N down (e)) is reported.<br />
The expected “up-down asymmetry” is nearly unity if there is no neutrino<br />
oscillation.<br />
R(μ/e) R(μ/e) =(MeasuredRatioμ/e) =(MeasuredRatioμ/e) / / (Expected (Expected Ratio Ratio μ/e)<br />
μ/e)<br />
VALUE DOCUMENT ID TECN COMMENT<br />
•••We do not use the following data for averages, fits, limits, etc. •••<br />
0.658±0.016±0.035 1 ASHIE 05 SKAM sub-GeV<br />
0.702 +0.032<br />
−0.030 ±0.101 0.69 ±0.10 ±0.06<br />
1.00 ±0.15 ±0.08<br />
2 ASHIE<br />
3 SANCHEZ<br />
4 FUKUDA<br />
5 DAUM<br />
05<br />
03<br />
96B<br />
95<br />
SKAM multi-GeV<br />
SOU2 Calorimeter raw data<br />
KAMI Water Cherenkov<br />
FREJ Calorimeter<br />
0.60 +0.06<br />
−0.05 ±0.05 6 FUKUDA 94 KAMI sub-GeV<br />
0.57 +0.08<br />
−0.07 ±0.07 7 FUKUDA 94<br />
8 BECKER-SZ... 92B<br />
KAMI<br />
IMB<br />
multi-Gev<br />
Water Cherenkov<br />
HTTP://PDG.LBL.GOV Page 2 Created: 6/16/2011 12:06
Citation: K. Nakamura et al. (<strong>Particle</strong> <strong>Data</strong> <strong>Group</strong>), JP G 37, 075021 (2010) and 2011 partial update for the 2012 edition (URL: http://pdg.lbl.gov)<br />
1 ASHIE 05 results are based on an exposure of 92 kton yr during the complete Super-<br />
Kamiokande I running period. The analyzed data sample consists of fully-contained<br />
single-ring e-like events with 0.1 GeV/c < p e and μ-like events 0.2 GeV/c < p μ ,<br />
both having a visible energy < 1.33 GeV. These criteria match the definition used by<br />
FUKUDA 94.<br />
2 ASHIE 05 results are based on an exposure of 92 kton yr during the complete Super-<br />
Kamiokande I running period. The analyzed data sample consists of fully-contained<br />
single-ring events with visible energy > 1.33 GeV and partially-contained events. All<br />
partially-contained events are classified as μ-like.<br />
3 SANCHEZ 03 result is based on an exposure of 5.9 kton yr, and updates ALLISON 99<br />
result. The analyzed data sample consists of fully-contained e-flavor and μ-flavor events<br />
having lepton momentum > 0.3 GeV/c.<br />
4 FUKUDA 96B studied neutron background in the atmospheric neutrino sample observed<br />
in the Kamiokande detector. No evidence for the background contamination was found.<br />
5 DAUM 95 results are based on an exposure of 2.0 kton yr which includes the data used<br />
by BERGER 90B. This ratio is for the contained and semicontained events. DAUM 95<br />
also report R(μ/e) =0.99 ± 0.13 ± 0.08 for the total neutrino induced data sample<br />
which includes upward going stopping muons and horizontal muons in addition to the<br />
contained and semicontained events.<br />
6 FUKUDA 94 result is based on an exposure of 7.7 kton yr and updates the HIRATA 92<br />
result. The analyzed data sample consists of fully-contained e-like events with 0.1 <<br />
p e < 1.33 GeV/c and fully-contained μ-like events with 0.2 < p μ < 1.5 GeV/c.<br />
7 FUKUDA 94 analyzed the data sample consisting of fully contained events with visible<br />
energy > 1.33 GeV and partially contained μ-like events.<br />
8 BECKER-SZENDY 92B reports the fraction of nonshowering events (mostly muons from<br />
atmospheric neutrinos) as 0.36 ± 0.02 ± 0.02, as compared with expected fraction 0.51 ±<br />
0.01 ± 0.05. After cutting the energy range to the Kamiokande limits, BEIER 92 finds<br />
R(μ/e) very close to the Kamiokande value.<br />
R(ν R(ν μ)=(MeasuredFluxofν μ)=(MeasuredFluxofν μ) μ) / (Expected Flux of ν μ) μ)<br />
VALUE DOCUMENT ID TECN COMMENT<br />
•••We do not use the following data for averages, fits, limits, etc. •••<br />
0.84±0.12 1 ADAMSON 06 MINS MINOS atmospheric<br />
0.72±0.026±0.13 2 AMBROSIO 01 MCRO upward through-going<br />
0.57±0.05 ±0.15 3 AMBROSIO 00 MCRO upgoing partially contained<br />
0.71±0.05 ±0.19 4 AMBROSIO 00 MCRO downgoing partially contained<br />
+ upgoing stopping<br />
0.74±0.036±0.046 5 AMBROSIO 98 MCRO Streamer tubes<br />
6 CASPER 91 IMB Water Cherenkov<br />
7 AGLIETTA 89 NUSX<br />
0.95±0.22 8 BOLIEV 81 Baksan<br />
0.62±0.17 CROUCH 78 Case Western/UCI<br />
1 ADAMSON 06 uses a measurement of 107 total neutrinos compared to an expected rate<br />
of 127 ± 13 without oscillations.<br />
2 AMBROSIO 01 result is based on the upward through-going muon tracks with Eμ > 1<br />
GeV. The data came from three different detector configurations, but the statistics is<br />
largely dominated by the full detector run, from May 1994 to December 2000. The total<br />
live time, normalized to the full detector configuration, is 6.17 years. The first error is<br />
the statistical error, the second is the systematic error, dominated by the theoretical error<br />
in the predicted flux.<br />
3 AMBROSIO 00 result is based on the upgoing partially contained event sample. It came<br />
from 4.1 live years of data taking with the full detector, from April 1994 to February<br />
1999. The average energy of atmospheric muon neutrinos corresponding to this sample<br />
is 4 GeV. The first error is statistical, the second is the systematic error, dominated by<br />
HTTP://PDG.LBL.GOV Page 3 Created: 6/16/2011 12:06
Citation: K. Nakamura et al. (<strong>Particle</strong> <strong>Data</strong> <strong>Group</strong>), JP G 37, 075021 (2010) and 2011 partial update for the 2012 edition (URL: http://pdg.lbl.gov)<br />
the 25% theoretical error in the rate (20% in the flux and 15% in the cross section, added<br />
in quadrature). Within statistics, the observed deficit is uniform over the zenith angle.<br />
4 AMBROSIO 00 result is based on the combined samples of downgoing partially contained<br />
events and upgoing stopping events. These two subsamples could not be distinguished<br />
due to the lack of timing information. The result came from 4.1 live years of data<br />
taking with the full detector, from April 1994 to February 1999. The average energy<br />
of atmospheric muon neutrinos corresponding to this sample is 4 GeV. The first error is<br />
statistical, the second is the systematic error, dominated by the 25% theoretical error in<br />
the rate (20% in the flux and 15% in the cross section, added in quadrature). Within<br />
statistics, the observed deficit is uniform over the zenith angle.<br />
5 AMBROSIO 98 result is for all nadir angles and updates AHLEN 95 result. The lower<br />
cutoff on the muon energy is 1 GeV. In addition to the statistical and systematic errors,<br />
there is a Monte Carlo flux error (theoretical error) of ±0.13. With a neutrino oscillation<br />
hypothesis, the fit either to the flux or zenith distribution independently yields<br />
sin22θ=1.0 andΔ(m2 ) ∼ afewtimes10−3eV2 . However, the fit to the observed<br />
zenith distribution gives a maximum probability for χ2 of only 5% for the best oscillation<br />
hypothesis.<br />
6 CASPER 91 correlates showering/nonshowering signature of single-ring events with parent<br />
atmospheric-neutrino flavor. They find nonshowering (≈ νμ induced) fraction is<br />
0.41 ± 0.03 ± 0.02, as compared with expected 0.51 ± 0.05 (syst).<br />
7 AGLIETTA 89 finds no evidence for any anomaly in the neutrino flux. They define<br />
ρ = (measured number of νe ’s)/(measured number of νμ ’s). They report<br />
ρ(measured)=ρ(expected) = 0.96 +0.32<br />
−0.28 .<br />
8 From this data BOLIEV 81 obtain the limit Δ(m2 ) ≤ 6 × 10⁻³ eV2 for maximal<br />
mixing, νμ → νμ type oscillation.<br />
R(μ/total) R(μ/total) = = (Measured (Measured Ratio Ratio μ/total) μ/total) / / (Expected (Expected Ratio Ratio μ/total)<br />
μ/total)<br />
VALUE DOCUMENT ID TECN COMMENT<br />
•••We do not use the following data for averages, fits, limits, etc. •••<br />
1.1 +0.07<br />
−0.12 ±0.11 1 CLARK 97 IMB multi-GeV<br />
1 CLARK 97 obtained this result by an analysis of fully contained and partially contained<br />
events in the IMB water-Cherenkov detector with visible energy > 0.95 GeV.<br />
N N up(μ)/N up(μ)/N down(μ) down(μ)<br />
VALUE DOCUMENT ID TECN COMMENT<br />
•••We do not use the following data for averages, fits, limits, etc. •••<br />
0.551 +0.035<br />
−0.033 ±0.004 1 ASHIE 05 SKAM multi-GeV<br />
1 ASHIE 05 results are based on an exposure of 92 kton yr during the complete Super-<br />
Kamiokande I running period. The analyzed data sample consists of fully-contained<br />
single-ring μ-like events with visible energy > 1.33 GeV and partially-contained events.<br />
All partially-contained events are classified as μ-like. Upward-going events are those<br />
with −1 < cos(zenith angle) < −0.2 and downward-going events are those with 0.2<<br />
cos(zenith angle)
Citation: K. Nakamura et al. (<strong>Particle</strong> <strong>Data</strong> <strong>Group</strong>), JP G 37, 075021 (2010) and 2011 partial update for the 2012 edition (URL: http://pdg.lbl.gov)<br />
1 ASHIE 05 results are based on an exposure of 92 kton yr during the complete Super-<br />
Kamiokande I running period. The analyzed data sample consists of fully-contained<br />
single-ring e-like events with visible energy > 1.33 GeV. Upward-going events are those<br />
with −1 < cos(zenith angle) < −0.2 and downward-going events are those with 0.2<br />
< cos(zenith angle) < 1. The e-like up-down ratio for the multi-GeV data is consistent<br />
with 1 (the expectation for no atmospheric ν e oscillations).<br />
R(up/down; R(up/down; μ) μ) = = (Measured (Measured up/down; up/down; μ) μ) / / (Expected (Expected up/down; up/down; μ)<br />
μ)<br />
VALUE DOCUMENT ID TECN COMMENT<br />
•••We do not use the following data for averages, fits, limits, etc. •••<br />
0.62 +0.19<br />
−0.14 ±0.02 1 ADAMSON 06 MINS atmospheric ν with far detector<br />
1 ADAMSON 06 result is obtained with the MINOS far detector with an exposure of 4.54<br />
kton yr. The expected ratio is calculated with no neutrino oscillation.<br />
R(μ + /μ− )=(MeasuredN(μ + )/N(μ− )) / (Expected N(μ + )/N(μ− R(μ ))<br />
+ /μ− )=(MeasuredN(μ + )/N(μ− )) / (Expected N(μ + )/N(μ− R(μ ))<br />
+ /μ− )=(MeasuredN(μ + )/N(μ− )) / (Expected N(μ + )/N(μ− R(μ ))<br />
+ /μ− )=(MeasuredN(μ + )/N(μ− )) / (Expected N(μ + )/N(μ− ))<br />
VALUE DOCUMENT ID TECN COMMENT<br />
•••We do not use the following data for averages, fits, limits, etc. •••<br />
1.39 +0.35<br />
−0.46 +0.08<br />
−0.14<br />
1 ADAMSON 07 MINS Upward and horizontal μ with<br />
far detector<br />
0.96 +0.38<br />
−0.27 ±0.15 2 ADAMSON 06 MINS atmospheric ν with far detector<br />
1 ADAMSON 07 result is obtained with the MINOS far detector in 854.24 live days, based<br />
on neutrino-induced upward-going and horizontal muons. This result is consistent with<br />
CPT conservation.<br />
2 ADAMSON 06 result is obtained with the MINOS far detector with an exposure of 4.54<br />
kton yr, based on contained events. The expected ratio is calculated by assuming the<br />
same oscillation parameters for neutrinos and antineutrinos.<br />
Solar neutrinos<br />
Solar neutrinos are produced by thermonuclear fusion reactions in the<br />
Sun. Radiochemical experiments measure particular combinations of fluxes<br />
from various neutrino-producing reactions, whereas water-Cherenkov experiments<br />
mainly measure a flux of neutrinos from decay of 8 B. Solar<br />
neutrino fluxes are composed of all active neutrino species, ν e , ν μ ,and<br />
ν τ . In addition, some other mechanisms may cause antineutrino components<br />
in solar neutrino fluxes. Each measurement method is sensitive to<br />
a particular component or a combination of components of solar neutrino<br />
fluxes. For details, see Section 13.4 of Reviews, Tables, and Plots.<br />
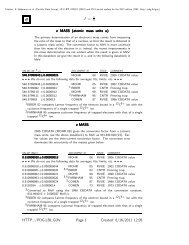
ν e Capture Rates from Radiochemical Experiments<br />
1 SNU (Solar <strong>Neutrino</strong> Unit) = 10 −36 captures per atom per second.<br />
VALUE (SNU) DOCUMENT ID TECN COMMENT<br />
•••We do not use the following data for averages, fits, limits, etc. •••<br />
73.4 +6.1<br />
−6.0 +3.7<br />
−4.1<br />
1 KAETHER 10 GALX reanalysis<br />
HTTP://PDG.LBL.GOV Page 5 Created: 6/16/2011 12:06
Citation: K. Nakamura et al. (<strong>Particle</strong> <strong>Data</strong> <strong>Group</strong>), JP G 37, 075021 (2010) and 2011 partial update for the 2012 edition (URL: http://pdg.lbl.gov)<br />
67.6 ±4.0 ±3.2 2 KAETHER 10 GNO+GALX reanalysis combined<br />
65.4 +3.1<br />
−3.0 +2.6 3<br />
−2.8<br />
ABDURASHI... 09 SAGE 71Ga → 71Ge 62.9 +5.5<br />
−5.3 ±2.5 4 ALTMANN 05 GNO 71Ga → 71Ge 69.3 ±4.1 ±3.6 5 ALTMANN 05 GNO GNO + GALX combined<br />
77.5 ±6.2 +4.3 6<br />
−4.7<br />
HAMPEL 99 GALX 71Ga → 71Ge 2.56±0.16±0.16 7 CLEVELAND 98 HOME 37Cl → 37Ar 1 KAETHER 10 reports the reanalysis results of a complete GALLEX data (GALLEX<br />
I+II+III+IV, reported in HAMPEL 99) based on the event selection with a new pulse<br />
shape analysis, which provides a better background reduction than the rise time analysis<br />
adopted in HAMPEL 99.<br />
2 Combined result of GALLEX I+II+III+IV reanalysis and GNO I+II+III (ALTMANN 05).<br />
3 ABDURASHITOV 09 reports a combined analysis of 168 extractions of the SAGE solar<br />
neutrino experiment during the period January 1990 through December 2007, and updates<br />
the ABDURASHITOV 02 result. The data are consistent with the assumption that<br />
the solar neutrino production rate is constant in time. Note that a ∼ 15% systematic<br />
uncertainty in the overall normalization may be added to the ABDURASHITOV 09 result,<br />
because calibration experiments for gallium solar neutrino measurements using intense<br />
51Cr (twice by GALLEX and once by SAGE) and 37Ar (by SAGE) result in an average<br />
ratio of 0.87 ± 0.05 of the observed to calculated rates.<br />
4 ALTMANN 05 reports the complete result from the GNO solar neutrino experiment<br />
(GNO I+II+III), which is the successor project of GALLEX. Experimental technique of<br />
GNO is essentially the same as that of GALLEX. The run data cover the period 20 May<br />
1998 through 9 April 2003.<br />
5 Combined result of GALLEX I+II+III+IV (HAMPEL 99) and GNO I+II+III.<br />
6 HAMPEL 99 report the combined result for GALLEX I+II+III+IV (65 runs in total),<br />
which update the HAMPEL 96 result. The GALLEX IV result (12 runs) is 118.4 ±<br />
17.8 ± 6.6 SNU. (HAMPEL 99 discuss the consistency of partial results with the mean.)<br />
The GALLEX experimental program has been completed with these runs. The total run<br />
data cover the period 14 May 1991 through 23 January 1997. A total of 300 71Ge events<br />
were observed. Note that a ∼ 15% systematic uncertainty in the overall normalization<br />
may be added to the HAMPEL 99 result, because calibration experiments for gallium<br />
solar neutrino measurements using intense 51Cr (twice by GALLEX and once by SAGE)<br />
and 37Ar (by SAGE) result in an average ratio of 0.87 ± 0.05 of the observed to calculated<br />
rates.<br />
7 CLEVELAND 98 is a detailed report of the 37Cl experiment at the Homestake Mine.<br />
The average solar neutrino-induced 37Ar production rate from 108 runs between 1970<br />
and 1994 updates the DAVIS 89 result.<br />
φES ( 8 φES ( B)<br />
8 φES ( B) 8 φES ( B)<br />
8B) 8B solar-neutrino flux measured via ν e elastic scattering. This process is sensitive to<br />
all active neutrino flavors, but with reduced sensitivity to νμ , ντ due to the crosssection<br />
difference, σ(ν μ,τ e) ∼ 0.16σ(νe e). If the 8B solar-neutrino flux involves<br />
nonelectron flavor active neutrinos, their contribution to the flux is ∼ 0.16 times of<br />
νe .<br />
VALUE (10 6 cm −2 s −1 ) DOCUMENT ID TECN COMMENT<br />
•••We do not use the following data for averages, fits, limits, etc. •••<br />
HTTP://PDG.LBL.GOV Page 6 Created: 6/16/2011 12:06
Citation: K. Nakamura et al. (<strong>Particle</strong> <strong>Data</strong> <strong>Group</strong>), JP G 37, 075021 (2010) and 2011 partial update for the 2012 edition (URL: http://pdg.lbl.gov)<br />
2.4 ±0.4 ±0.1 1 BELLINI 10A BORX average flux<br />
1.77 +0.24<br />
−0.21 +0.09 2<br />
−0.10<br />
AHARMIM 08 SNO Phase III<br />
2.38±0.05 +0.16 3<br />
−0.15<br />
CRAVENS 08 SKAM average flux<br />
2.35±0.02±0.08 4 HOSAKA 06 SKAM average flux<br />
2.35±0.22±0.15 5 AHARMIM 05A SNO Salty D2O; 8B shape not constrained<br />
2.34±0.23 +0.15 5<br />
−0.14<br />
AHARMIM 05A SNO Salty D2O; 8B shape constrained<br />
2.39 +0.24<br />
−0.23 ±0.12 6 AHMAD 02 SNO average flux<br />
2.39±0.34 +0.16 7<br />
−0.14<br />
AHMAD 01 SNO average flux<br />
2.80±0.19±0.33 8 FUKUDA 96 KAMI average flux<br />
2.70±0.27 8 FUKUDA 96 KAMI day flux<br />
2.87 +0.27<br />
8<br />
−0.26<br />
FUKUDA 96 KAMI night flux<br />
1 BELLINI 10A reports the Borexino result with 3 MeV energy threshold for scattered<br />
electrons. The data correspond to 345.3 live days with a target mass of 100 t, between<br />
July 15, 2007 and August 23, 2009.<br />
2 AHARMIM 08 reports the results from SNO Phase III measurement using an array of<br />
3He proportional counters to measure the rate of NC interactions in heavy water, over<br />
the period between November 27, 2004 and November 28, 2006, corresponding to 385.17<br />
live days. A simultaneous fit was made for the number of NC events detected by the<br />
proportional counters and the numbers of NC, CC, and ES events detected by the PMTs,<br />
where the spectral distributions of the ES and CC events were not constrained to the 8B shape.<br />
3 CRAVENS 08 reports the Super-Kamiokande-II results for 791 live days from December<br />
2002 to October 2005. The photocathode coverage of the detector is 19% (reduced from<br />
40% of that of Super-Kamiokande-I due to an accident in 2001). The analysis threshold<br />
for the average flux is 7 MeV.<br />
4 HOSAKA 06 reports the final results for 1496 live days with Super-Kamiokande-I between<br />
May 31, 1996 and July 15, 2001, and replace FUKUDA 02 results. The analysis threshold<br />
is 5 MeV except for the first 280 live days (6.5 MeV).<br />
5 AHARMIM 05A measurements were made with dissolved NaCl (0.195% by weight) in<br />
heavy water over the period between July 26, 2001 and August 28, 2003, corresponding<br />
to 391.4 live days, and update AHMED 04A. TheCC, ES, andNC events were statistically<br />
separated. In one method, the 8B energy spectrum was not constrained. In the other<br />
method, the constraint of an undistorted 8B energy spectrum was added for comparison<br />
with AHMAD 02 results.<br />
6 AHMAD 02 reports the 8B solar-neutrino flux measured via ν e elastic scattering above<br />
the kinetic energy threshold of 5 MeV. The data correspond to 306.4 live days with SNO<br />
between November 2, 1999 and May 28, 2001, and updates AHMAD 01 results.<br />
7 AHMAD 01 reports the 8B solar-neutrino flux measured via ν e elastic scattering above<br />
the kinetic energy threshold of 6.75 MeV. The data correspond to 241 live days with<br />
SNO between November 2, 1999 and January 15, 2001.<br />
8 FUKUDA 96 results are for a total of 2079 live days with Kamiokande II and III from<br />
January 1987 through February 1995, covering the entire solar cycle 22, with threshold<br />
Ee > 9.3 MeV (first 449 days), > 7.5 MeV (middle 794 days), and > 7.0 MeV (last 836<br />
days). These results update the HIRATA 90 result for the average 8Bsolar-neutrinoflux and HIRATA 91 result for the day-night variation in the 8B solar-neutrino flux. The total<br />
data sample was also analyzed for short-term variations: within experimental errors, no<br />
strong correlation of the solar-neutrino flux with the sunspot numbers was found.<br />
HTTP://PDG.LBL.GOV Page 7 Created: 6/16/2011 12:06
Citation: K. Nakamura et al. (<strong>Particle</strong> <strong>Data</strong> <strong>Group</strong>), JP G 37, 075021 (2010) and 2011 partial update for the 2012 edition (URL: http://pdg.lbl.gov)<br />
φCC ( 8 φCC ( B)<br />
8 φCC ( B) 8 φCC ( B)<br />
8B) 8B solar-neutrino flux measured with charged-current reaction which is sensitive exclusively<br />
to νe .<br />
VALUE (10 6 cm −2 s −1 ) DOCUMENT ID TECN COMMENT<br />
•••We do not use the following data for averages, fits, limits, etc. •••<br />
1.67 +0.05<br />
−0.04 +0.07<br />
1<br />
−0.08<br />
AHARMIM 08 SNO Phase III<br />
1.68±0.06 +0.08<br />
2<br />
−0.09<br />
AHARMIM 05A SNO Salty D2O; 8Bshape not const.<br />
1.72±0.05±0.11 2 AHARMIM 05A SNO Salty D2O; 8Bshape constrained<br />
1.76 +0.06<br />
−0.05 ±0.09 3 AHMAD 02 SNO average flux<br />
1.75 ± 0.07 +0.12<br />
−0.11 ± 0.05 4 AHMAD 01 SNO average flux<br />
1 AHARMIM 08 reports the results from SNO Phase III measurement using an array of<br />
3He proportional counters to measure the rate of NC interactions in heavy water, over<br />
the period between November 27, 2004 and November 28, 2006, corresponding to 385.17<br />
live days. A simultaneous fit was made for the number of NC events detected by the<br />
proportional counters and the numbers of NC, CC, and ES events detected by the PMTs,<br />
where the spectral distributions of the ES and CC events were not constrained to the 8B shape.<br />
2 AHARMIM 05A measurements were made with dissolved NaCl (0.195% by weight) in<br />
heavy water over the period between July 26, 2001 and August 28, 2003, corresponding<br />
to 391.4 live days, and update AHMED 04A. TheCC, ES, andNC events were statistically<br />
separated. In one method, the 8B energy spectrum was not constrained. In the other<br />
method, the constraint of an undistorted 8B energy spectrum was added for comparison<br />
with AHMAD 02 results.<br />
3 AHMAD 02 reports the SNO result of the 8B solar-neutrino flux measured with chargedcurrent<br />
reaction on deuterium, νe d → ppe− , above the kinetic energy threshold of<br />
5 MeV. The data correspond to 306.4 live days with SNO between November 2, 1999<br />
and May 28, 2001, and updates AHMAD 01 results. The complete description of the<br />
SNO Phase I data set is given in AHARMIM 07.<br />
4 AHMAD 01 reports the first SNO result of the 8B solar-neutrino flux measured with the<br />
charged-current reaction on deuterium, νe d → ppe− , above the kinetic energy threshold<br />
of 6.75 MeV. The data correspond to 241 live days with SNO between November 2,<br />
1999 and January 15, 2001.<br />
φNC ( 8 φNC ( B)<br />
8 φNC ( B) 8 φNC ( B)<br />
8B) 8B solar neutrino flux measured with neutral-current reaction, which is equally sensitive<br />
to νe , νμ ,andντ .<br />
VALUE (10 6 cm −2 s −1 ) DOCUMENT ID TECN COMMENT<br />
•••We do not use the following data for averages, fits, limits, etc. •••<br />
5.140 +0.160<br />
−0.158 +0.132<br />
−0.117<br />
5.54 +0.33<br />
−0.31 +0.36<br />
−0.34<br />
4.94 ±0.21 +0.38<br />
−0.34<br />
4.81 ±0.19 +0.28<br />
−0.27<br />
5.09 +0.44<br />
−0.43 +0.46<br />
−0.43<br />
6.42 ±1.57 +0.55<br />
−0.58<br />
1 AHARMIM 10 SNO Phase I+II, low threshold<br />
2 AHARMIM 08 SNO Phase III, prop. counter + PMT<br />
3 AHARMIM 05A SNO Salty D2 O; 8 B shape not const.<br />
3 AHARMIM 05A SNO Salty D2 O; 8 B shape constrained<br />
4 AHMAD 02 SNO average flux; 8 B shape const.<br />
4 AHMAD 02 SNO average flux; 8 B shape not const.<br />
HTTP://PDG.LBL.GOV Page 8 Created: 6/16/2011 12:06
Citation: K. Nakamura et al. (<strong>Particle</strong> <strong>Data</strong> <strong>Group</strong>), JP G 37, 075021 (2010) and 2011 partial update for the 2012 edition (URL: http://pdg.lbl.gov)<br />
1 AHARMIM 10 reports this result from a joint analysis of SNO Phase I+II data with the<br />
”effective electron kinetic energy” threshold of 3.5 MeV. This result is obtained with a<br />
”binned-histogram unconstrained fit” where binned probability distribution functions of<br />
the neutrino signal observables were used without any model constraints on the shape<br />
of the neutrino spectrum.<br />
2 AHARMIM 08 reports the results from SNO Phase III measurement using an array of<br />
3 He proportional counters to measure the rate of NC interactions in heavy water, over<br />
the period between November 27, 2004 and November 28, 2006, corresponding to 385.17<br />
live days. A simultaneous fit was made for the number of NC events detected by the<br />
proportional counters and the numbers of NC, CC, and ES events detected by the PMTs,<br />
where the spectral distributions of the ES and CC events were not constrained to the 8 B<br />
shape.<br />
3 AHARMIM 05A measurements were made with dissolved NaCl (0.195% by weight) in<br />
heavy water over the period between July 26, 2001 and August 28, 2003, corresponding<br />
to 391.4 live days, and update AHMED 04A. TheCC, ES, andNC events were statistically<br />
separated. In one method, the 8 B energy spectrum was not constrained. In the other<br />
method, the constraint of an undistorted 8 B energy spectrum was added for comparison<br />
with AHMAD 02 results.<br />
4 AHMAD 02 reports the first SNO result of the 8 B solar-neutrino flux measured with<br />
the neutral-current reaction on deuterium, ν ℓ d → npν ℓ , above the neutral-current<br />
reaction threshold of 2.2 MeV. The data correspond to 306.4 live days with SNO between<br />
November 2, 1999 and May 28, 2001. The complete description of the SNO Phase I<br />
data set is given in AHARMIM 07.<br />
φνμ +ν (<br />
τ 8 φνμ +ν ( B) τ 8 φνμ +ν ( B)<br />
τ 8 φνμ +ν ( B) τ 8B) Nonelectron-flavor active neutrino component (ν μ and ν τ )inthe 8 Bsolar-neutrino<br />
flux.<br />
VALUE (10 6 cm −2 s −1 ) DOCUMENT ID TECN COMMENT<br />
•••We do not use the following data for averages, fits, limits, etc. •••<br />
3.26±0.25 +0.40<br />
−0.35<br />
3.09±0.22 +0.30<br />
−0.27<br />
1 AHARMIM 05A SNO From φNC , φ CC ,andφ ES ;<br />
8 B shape not const.<br />
1 AHARMIM 05A SNO From φNC , φ CC ,andφ ES ;<br />
8 B shape constrained<br />
3.41±0.45 +0.48 2<br />
−0.45<br />
AHMAD 02 SNO From φNC , φCC ,andφES 3.69±1.13 3 AHMAD 01 Derived from SNO+SuperKam,<br />
water Cherenkov<br />
1 AHARMIM 05A measurements were made with dissolved NaCl (0.195% by weight) in<br />
heavy water over the period between July 26, 2001 and August 28, 2003, corresponding<br />
to 391.4 live days, and update AHMED 04A. TheCC, ES, andNC events were statistically<br />
separated. In one method, the 8B energy spectrum was not constrained. In the other<br />
method, the constraint of an undistorted 8B energy spectrum was added for comparison<br />
with AHMAD 02 results.<br />
2 AHMAD 02 deduced the nonelectron-flavor active neutrino component (νμ and ντ )<br />
in the 8B solar-neutrino flux, by combining the charged-current result, the ν e elasticscattering<br />
result and the neutral-current result. The complete description of the SNO<br />
Phase I data set is given in AHARMIM 07.<br />
3 AHMAD 01 deduced the nonelectron-flavor active neutrino component (νμ and ντ )in<br />
the 8B solar-neutrino flux, by combining the SNO charged-current result (AHMAD 01)<br />
and the Super-Kamiokande ν e elastic-scattering result (FUKUDA 01).<br />
HTTP://PDG.LBL.GOV Page 9 Created: 6/16/2011 12:06
Citation: K. Nakamura et al. (<strong>Particle</strong> <strong>Data</strong> <strong>Group</strong>), JP G 37, 075021 (2010) and 2011 partial update for the 2012 edition (URL: http://pdg.lbl.gov)<br />
Total Flux of Active 8 Total Flux of Active B Solar <strong>Neutrino</strong>s<br />
8 Total Flux of Active B Solar <strong>Neutrino</strong>s<br />
8 Total Flux of Active B Solar <strong>Neutrino</strong>s<br />
8B Solar <strong>Neutrino</strong>s<br />
Total flux of active neutrinos (ν e , ν μ ,andν τ ).<br />
VALUE (10 6 cm −2 s −1 ) DOCUMENT ID TECN COMMENT<br />
•••We do not use the following data for averages, fits, limits, etc. •••<br />
5.046 +0.159<br />
−0.152 +0.107 1<br />
−0.123<br />
AHARMIM 10 SNO From φNC in Phase III<br />
5.54 +0.33<br />
−0.31 +0.36 2<br />
−0.34<br />
AHARMIM 08 SNO φNC in Phase III<br />
4.94 ±0.21 +0.38 3<br />
−0.34<br />
AHARMIM 05A SNO From φNC ; 8B shape not const.<br />
4.81 ±0.19 +0.28 3<br />
−0.27<br />
AHARMIM 05A SNO From φNC ; 8B shape constrained<br />
5.09 +0.44<br />
−0.43 +0.46 4<br />
−0.43<br />
AHMAD 02 SNO Direct measurement from φNC<br />
5.44 ±0.99 5 AHMAD 01 Derived from SNO+SuperKam,<br />
water Cherenkov<br />
1 AHARMIM 10 reports this result from a joint analysis of SNO Phase I+II data with<br />
the ”effective electron kinetic energy” threshold of 3.5 MeV. This result is obtained<br />
with the assumption of unitarity, which relates the NC, CC, and ES rates. The data<br />
were fit with the free parameters directly describing the total 8B neutrino flux and the<br />
energy-dependent νe survival probability.<br />
2 AHARMIM 08 reports the results from SNO Phase III measurement using an array of<br />
3He proportional counters to measure the rate of NC interactions in heavy water, over<br />
the period between November 27, 2004 and November 28, 2006, corresponding to 385.17<br />
live days. A simultaneous fit was made for the number of NC events detected by the<br />
proportional counters and the numbers of NC, CC, and ES events detected by the PMTs,<br />
where the spectral distributions of the ES and CC events were not constrained to the 8B shape.<br />
3 AHARMIM 05A measurements were made with dissolved NaCl (0.195% by weight) in<br />
heavy water over the period between July 26, 2001 and August 28, 2003, corresponding<br />
to 391.4 live days, and update AHMED 04A. The CC, ES, and NC events were statistically<br />
separated. In one method, the 8B energy spectrum was not constrained. In the other<br />
method, the constraint of an undistorted 8B energy spectrum was added for comparison<br />
with AHMAD 02 results.<br />
4 AHMAD 02 determined the total flux of active 8B solar neutrinos by directly measuring<br />
the neutral-current reaction, νℓ d → npνℓ , which is equally sensitive to νe , νμ ,andντ .<br />
The complete description of the SNO Phase I data set is given in AHARMIM 07.<br />
5 AHMAD 01 deduced the total flux of active 8B solar neutrinos by combining the SNO<br />
charged-current result (AHMAD 01) and the Super-Kamiokande ν e elastic-scattering<br />
result (FUKUDA 01).<br />
Day-Night Asymmetry ( 8 Day-Night Asymmetry ( B)<br />
8 Day-Night Asymmetry ( B) 8 Day-Night Asymmetry ( B)<br />
8B) A =(φ night − φ day )/φ average<br />
VALUE DOCUMENT ID TECN COMMENT<br />
•••We do not use the following data for averages, fits, limits, etc. •••<br />
0.063±0.042±0.037<br />
0.021±0.020<br />
1 CRAVENS 08 SKAM Based on φES<br />
+0.012<br />
−0.013<br />
2 HOSAKA 06 SKAM Based on φES<br />
0.017±0.016 +0.012<br />
−0.013<br />
−0.056±0.074±0.053<br />
3 HOSAKA<br />
4 AHARMIM<br />
06<br />
05A<br />
SKAM Fitted in the LMA region<br />
SNO From salty SNO φCC<br />
HTTP://PDG.LBL.GOV Page 10 Created: 6/16/2011 12:06
Citation: K. Nakamura et al. (<strong>Particle</strong> <strong>Data</strong> <strong>Group</strong>), JP G 37, 075021 (2010) and 2011 partial update for the 2012 edition (URL: http://pdg.lbl.gov)<br />
−0.037±0.063±0.032 4 AHARMIM 05A SNO From salty SNO φCC ;const.<br />
of no φNC asymmetry<br />
0.14 ±0.063 +0.015 5<br />
−0.014<br />
AHMAD 02B SNO Derived from SNO φCC<br />
0.07 ±0.049 +0.013 6<br />
−0.012<br />
AHMAD 02B SNO Const. of no φNC asymmetry<br />
1 CRAVENS 08 reports the Super-Kamiokande-II results for 791 live days from December<br />
2002 to October 2005. The photocathode coverage of the detector is 19% (reduced from<br />
40% of that of Super-Kamiokande-I due to an accident in 2001). The analysis threshold<br />
for the day and night fluxes is 7.5 MeV.<br />
2 HOSAKA 06 reports the final results for 1496 live days with Super-Kamiokande-I between<br />
May 31, 1996 and July 15, 2001, and replace FUKUDA 02 results. The analysis threshold<br />
is 5 MeV except for the first 280 live days (6.5 MeV).<br />
3 This result with reduced statistical uncertainty is obtained by assuming two-neutrino<br />
oscillations within the LMA (large mixing angle) region and by fitting the time variation of<br />
the solar neutrino flux measured via νe elastic scattering to the variations expected from<br />
neutrino oscillations. For details, see SMY 04. There is an additional small systematic<br />
error of ±0.0004 coming from uncertainty of oscillation parameters.<br />
4 AHARMIM 05A measurements were made with dissolved NaCl (0.195% by weight) in<br />
heavy water over the period between July 26, 2001 and August 28, 2003, with 176.5<br />
days of the live time recorded during the day and 214.9 days during the night. This<br />
result is obtained with the spectral distribution of the CC events not constrained to the<br />
8Bshape. 5 AHMAD 02B results are based on the charged-current interactions recorded between<br />
November 2, 1999 and May 28, 2001, with the day and night live times of 128.5 and<br />
177.9 days, respectively. The complete description of the SNO Phase I data set is given<br />
in AHARMIM 07.<br />
6 AHMAD 02B results are derived from the charged-current interactions, neutral-current<br />
interactions, and ν e elastic scattering, with the total flux of active neutrinos constrained<br />
to have no asymmetry. The data were recorded between November 2, 1999 and May<br />
28, 2001, with the day and night live times of 128.5 and 177.9 days, respectively. The<br />
complete description of the SNO Phase I data set is given in AHARMIM 07.<br />
φES ( 7 φES ( Be)<br />
7 φES ( Be) 7 φES ( Be)<br />
7Be) 7Be solar-neutrino flux measured via νe elastic scattering. This process is sensitive<br />
to all active neutrino flavors, but with reduced sensitivity to νμ , ντ due to the crosssection<br />
difference, σ(ν μ,τ e) ∼ 0.2 σ(νe e). If the 7Be solar-neutrino flux involves<br />
nonelectron flavor active neutrinos, their contribution to the flux is ∼ 0.2 timesthat<br />
of νe .<br />
VALUE (10 9 cm −2 s −1 ) DOCUMENT ID TECN<br />
•••We do not use the following data for averages, fits, limits, etc. •••<br />
3.36±0.34 1 ARPESELLA 08A BORX<br />
1 ARPESELLA 08A reports the 0.862 MeV 7Be solar-neutrino flux measured via ν elastic<br />
scattering. The data correspond to 192 live days with BOREXINO (41.3 ton·yr fiducial<br />
exposure) between May 16, 2007 and April 12, 2008. The measured flux is calculated<br />
from the ratio of the measured rate to the rate expected from the non-oscillated solar ν<br />
in the high metallicity SSM PENA-GARAY 09.<br />
HTTP://PDG.LBL.GOV Page 11 Created: 6/16/2011 12:06
Citation: K. Nakamura et al. (<strong>Particle</strong> <strong>Data</strong> <strong>Group</strong>), JP G 37, 075021 (2010) and 2011 partial update for the 2012 edition (URL: http://pdg.lbl.gov)<br />
φ CC(pp) CC(pp)<br />
pp solar-neutrino flux measured with charged-current reaction which is sensitive exclusively<br />
to ν e .<br />
VALUE (10 10 cm −2 s −1 ) DOCUMENT ID TECN COMMENT<br />
•••We do not use the following data for averages, fits, limits, etc. •••<br />
3.38±0.47 1 ABDURASHI... 09 FIT Fit existing solar-ν data<br />
1 ABDURASHITOV 09 reports the pp solar-neutrino flux derived from the Ga solar neutrino<br />
capture rate by subtracting contributions from 8B, 7Be, pep and CNO solar neutrino<br />
fluxes determined by other solar neutrino experiments as well as neutrino oscillation<br />
parameters determined from available world neutrino oscillation data.<br />
φ φ ES (hep)<br />
hep solar-neutrino flux measured via ν e elastic scattering. This process is sensitive<br />
to all active neutrino flavors, but with reduced sensitivity to ν μ , ν τ due to the crosssection<br />
difference, σ(ν μ,τ e) ∼ 0.16σ(ν e e). If the hep solar-neutrino flux involves<br />
nonelectron flavor active neutrinos, their contribution to the flux is ∼ 0.16 times of<br />
ν e .<br />
VALUE (10 3 cm −2 s −1 ) CL% DOCUMENT ID TECN<br />
•••We do not use the following data for averages, fits, limits, etc. •••<br />
Citation: K. Nakamura et al. (<strong>Particle</strong> <strong>Data</strong> <strong>Group</strong>), JP G 37, 075021 (2010) and 2011 partial update for the 2012 edition (URL: http://pdg.lbl.gov)<br />
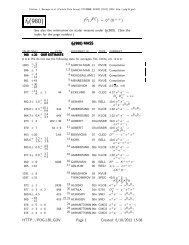
sin2 sin (2θ12) 2 sin (2θ12) 2 sin (2θ12) 2 (2θ12) VALUE DOCUMENT ID TECN COMMENT<br />
0.861 +0.026<br />
0.861<br />
−0.022<br />
+0.026<br />
0.861<br />
−0.022<br />
+0.026<br />
0.861<br />
−0.022<br />
+0.026<br />
−0.022<br />
1,2 AHARMIM 10 FIT KamLAND + global solar: 2ν<br />
•••We do not use the following data for averages, fits, limits, etc. •••<br />
0.861 +0.024<br />
−0.031<br />
1,3 AHARMIM 10 FIT global solar: 2ν<br />
0.869 +0.026<br />
−0.024<br />
1,4 AHARMIM 10 FIT KamLAND + global solar: 3ν<br />
0.869 +0.031<br />
−0.037<br />
0.92 ±0.05<br />
0.87 ±0.04<br />
0.87 ±0.03<br />
1,5 AHARMIM<br />
6 ABE<br />
7 ABE<br />
8 AHARMIM<br />
10<br />
08A<br />
08A<br />
08<br />
FIT<br />
FIT<br />
FIT<br />
FIT<br />
global solar: 3ν<br />
KamLAND<br />
KamLAND + global fit<br />
KamLAND + global solar<br />
0.85 +0.04<br />
−0.06<br />
9 HOSAKA 06 FIT KamLAND + global solar<br />
0.85 +0.06<br />
−0.05<br />
10 HOSAKA 06 FIT SKAM+SNO+KamLAND<br />
0.86 +0.05<br />
−0.07<br />
11 HOSAKA 06 FIT SKAM+SNO<br />
0.86 +0.03<br />
−0.04<br />
0.75–0.95<br />
0.82 ±0.05<br />
0.82 ±0.04<br />
0.71–0.93<br />
12 AHARMIM<br />
13 AHARMIM<br />
14 ARAKI<br />
15 AHMED<br />
16 AHMED<br />
05A<br />
05A<br />
05<br />
04A<br />
04A<br />
FIT<br />
FIT<br />
FIT<br />
FIT<br />
FIT<br />
KamLAND + global solar<br />
global solar<br />
KamLAND + global solar<br />
KamLAND + global solar<br />
global solar<br />
0.85 +0.05<br />
−0.07<br />
17 SMY 04 FIT KamLAND + global solar<br />
0.83 +0.06<br />
−0.08<br />
18 SMY 04 FIT global solar<br />
0.87 +0.07<br />
−0.08<br />
0.62–0.88<br />
0.62–0.95<br />
19 SMY<br />
20 AHMAD<br />
21 FUKUDA<br />
04<br />
02B<br />
02<br />
FIT<br />
FIT<br />
FIT<br />
SKAM + SNO<br />
global solar<br />
global solar<br />
1 AHARMIM 10 global solar neutrino data include SNO’s low-energy-threshold analysis<br />
survival probability day/night curves, SNO Phase III integral rates (AHARMIM 08), Cl<br />
(CLEVELAND 98), SAGE (ABDURASHITOV 09), Gallex/GNO (HAMPEL 99, ALT-<br />
MANN 05), Borexino (ARPESELLA 08A), SK-I zenith (HOSAKA 06), and SK-II<br />
day/night spectra (CRAVENS 08).<br />
2 AHARMIM 10 obtained this result by a two-neutrino oscillation analysis using global<br />
solar neutrino data and KamLAND data (ABE 08A). CPT invariance is assumed.<br />
3 AHARMIM 10 obtained this result by a two-neutrino oscillation analysis using global<br />
solar neutrino data.<br />
4 AHARMIM 10 obtained this result by a three-neutrino oscillation analysis with the value<br />
of Δm2 31 fixed to 2.3 × 10⁻³ eV2 , using global solar neutrino data and KamLAND data<br />
(ABE 08A). CPT invariance is assumed.<br />
5 AHARMIM 10 obtained this result by a three-neutrino oscillation analysis with the value<br />
of Δm2 31 fixed to 2.3 × 10⁻³ eV2 , using global solar neutrino data.<br />
6 ABE 08A obtained this result by a rate + shape + time combined geoneutrino and reactor<br />
two-neutrino fit for Δm2 21 and tan2θ12 , using KamLAND data only.<br />
7 ABE 08A obtained this result by means of a two-neutrino fit using KamLAND, Homestake,<br />
SAGE, GALLEX, GNO, SK (zenith angle and E-spectrum), the SNO χ2-map, and solar<br />
flux data. CPT invariance is assumed.<br />
HTTP://PDG.LBL.GOV Page 13 Created: 6/16/2011 12:06
Citation: K. Nakamura et al. (<strong>Particle</strong> <strong>Data</strong> <strong>Group</strong>), JP G 37, 075021 (2010) and 2011 partial update for the 2012 edition (URL: http://pdg.lbl.gov)<br />
8 The result given by AHARMIM 08 is θ = (34.4<br />
+1.3<br />
−1.2 )◦ . This result is obtained by<br />
a two-neutrino oscillation analysis using solar neutrino data including those of Borexino<br />
(ARPESELLA 08A) and Super-Kamiokande-I (HOSAKA 06), and KamLAND data<br />
(ABE 08A). CPT invariance is assumed.<br />
9 HOSAKA 06 obtained this result by a two-neutrino oscillation analysis using SK νe data,<br />
CC data from other solar neutrino experiments, and KamLAND data (ARAKI 05). CPT<br />
invariance is assumed.<br />
10 HOSAKA 06 obtained this result by a two-neutrino oscillation analysis using the data from<br />
Super-Kamiokande, SNO (AHMAD 02 and AHMAD 02B), and KamLAND (ARAKI 05)<br />
experiments. CPT invariance is assumed.<br />
11 HOSAKA 06 obtained this result by a two-neutrino oscillation analysis using the Super-<br />
Kamiokande and SNO (AHMAD 02 and AHMAD 02B) solar neutrino data.<br />
12 The result given by AHARMIM 05A is θ =(33.9 ± 1.6) ◦ . This result is obtained by<br />
a two-neutrino oscillation analysis using SNO pure deuteron and salt phase data, SK<br />
νe data, Cl and Ga CC data, and KamLAND data (ARAKI 05). CPT invariance is<br />
assumed. AHARMIM 05A also quotes θ =(33.9 +2.4<br />
−2.2 )◦ as the error enveloping the 68%<br />
CL two-dimensional region. This translates into sin22 θ =0.86 +0.05<br />
−0.06 .<br />
13 AHARMIM 05A obtained this result by a two-neutrino oscillation analysis using the data<br />
from all solar neutrino experiments. The listed range of the parameter envelops the 95%<br />
CL two-dimensional region shown in figure 35a of AHARMIM 05A. AHARMIM05Aalso quotes tan2θ =0.45 +0.09<br />
−0.08<br />
as the error enveloping the 68% CL two-dimensional region.<br />
This translates into sin22 θ =0.86 +0.05<br />
−0.07 .<br />
14 ARAKI 05 obtained this result by a two-neutrino oscillation analysis using KamLAND and<br />
solar neutrino data. CPT invariance is assumed. The 1σ error shown here is translated<br />
from the number provided by the KamLAND collaboration, tan2θ =0.40 +0.07<br />
−0.05<br />
. The<br />
corresponding number quoted in ARAKI 05 is tan2θ =0.40 +0.10<br />
−0.07 (sin22 θ =0.82 ±<br />
0.07), which envelops the 68% CL two-dimensional region.<br />
15 The result given by AHMED 04A is θ =(32.5<br />
+1.7<br />
−1.6 )◦ . This result is obtained by a twoneutrino<br />
oscillation analysis using solar neutrino and KamLAND data (EGUCHI 03). CPT<br />
invariance is assumed. AHMED 04A also quotes θ =(32.5 +2.4<br />
−2.3 )◦ as the error enveloping<br />
the 68% CL two-dimensional region. This translates into sin22 θ =0.82 ± 0.06.<br />
16 AHMED 04A obtained this result by a two-neutrino oscillation analysis using the data<br />
from all solar neutrino experiments. The listed range of the parameter envelops the 95%<br />
CL two-dimensional region shown in Fig. 5(a) of AHMED 04A. The best-fit point is<br />
Δ(m2 )=6.5 × 10⁻⁵ eV2 ,tan2θ =0.40 (sin22 θ =0.82).<br />
17 The result given by SMY 04 is tan2θ =0.44 ± 0.08. This result is obtained by a twoneutrino<br />
oscillation analysis using solar neutrino and KamLAND data (IANNI 03). CPT<br />
invariance is assumed.<br />
18 SMY 04 obtained this result by a two-neutrino oscillation analysis using the data from<br />
all solar neutrino experiments. The 1σ errors are read from Fig. 6(a) of SMY 04.<br />
19 SMY 04 obtained this result by a two-neutrino oscillation analysis using the Super-<br />
Kamiokande and SNO (AHMAD 02 and AHMAD 02B) solar neutrino data. The 1σ<br />
errors are read from Fig. 6(a) of SMY 04.<br />
20 AHMAD 02B obtained this result by a two-neutrino oscillation analysis using the data<br />
from all solar neutrino experiments. The listed range of the parameter envelops the 95%<br />
CL two-dimensional region shown in Fig. 4(b) of AHMAD 02B. The best fit point is<br />
Δ(m2 )=5.0 × 10⁻⁵ eV2 and tanθ =0.34 (sin22 θ = 0.76).<br />
21 FUKUDA 02 obtained this result by a two-neutrino oscillation analysis using the data<br />
from all solar neutrino experiments. The listed range of the parameter envelops the 95%<br />
CL two-dimensional region shown in Fig. 4 of FUKUDA 02. The best fit point is Δ(m2 )<br />
=6.9 × 10⁻⁵ eV2 and tan2θ =0.38 (sin22 θ = 0.80).<br />
HTTP://PDG.LBL.GOV Page 14 Created: 6/16/2011 12:06
Citation: K. Nakamura et al. (<strong>Particle</strong> <strong>Data</strong> <strong>Group</strong>), JP G 37, 075021 (2010) and 2011 partial update for the 2012 edition (URL: http://pdg.lbl.gov)<br />
Δm2 Δm<br />
21<br />
2 Δm21 2 Δm<br />
21<br />
2 21<br />
VALUE (10−5 eV2 ) DOCUMENT ID TECN COMMENT<br />
7.59 +0.20 7.59<br />
−0.21<br />
+0.20<br />
7.59<br />
−0.21<br />
+0.20 7.59<br />
−0.21<br />
+0.20<br />
−0.21<br />
1,2 AHARMIM 10 FIT KamLAND + global solar: 2ν<br />
•••We do not use the following data for averages, fits, limits, etc. •••<br />
5.89 +2.13<br />
−2.16<br />
7.59±0.21<br />
1,3 AHARMIM<br />
1,4 AHARMIM<br />
10<br />
10<br />
FIT<br />
FIT<br />
global solar: 2ν<br />
KamLAND + global solar: 3ν<br />
6.31 +2.49<br />
−2.58<br />
1,5 AHARMIM 10 FIT global solar: 3ν<br />
7.58 +0.14<br />
−0.13 ±0.15 7.59±0.21<br />
6 ABE<br />
7 ABE<br />
08A<br />
08A<br />
FIT<br />
FIT<br />
KamLAND<br />
KamLAND + global solar<br />
7.59 +0.19<br />
−0.21<br />
8.0 ±0.3<br />
8.0 ±0.3<br />
8 AHARMIM<br />
9 HOSAKA<br />
10 HOSAKA<br />
08<br />
06<br />
06<br />
FIT<br />
FIT<br />
FIT<br />
KamLAND + global solar<br />
KamLAND + global solar<br />
SKAM+SNO+KamLAND<br />
6.3 +3.7<br />
−1.5<br />
5–12<br />
11 HOSAKA<br />
12 HOSAKA<br />
06<br />
06<br />
FIT<br />
FIT<br />
SKAM+SNO<br />
SKAM day/night in the LMA region<br />
8.0 +0.4<br />
−0.3<br />
3.3–14.4<br />
13 AHARMIM<br />
14 AHARMIM<br />
05A<br />
05A<br />
FIT<br />
FIT<br />
KamLAND + global solar LMA<br />
global solar<br />
7.9 +0.4<br />
−0.3<br />
15 ARAKI 05 FIT KamLAND + global solar<br />
7.1 +1.0<br />
−0.3<br />
3.2–13.7<br />
16 AHMED<br />
17 AHMED<br />
04A<br />
04A<br />
FIT<br />
FIT<br />
KamLAND + global solar<br />
global solar<br />
7.1 +0.6<br />
−0.5<br />
18 SMY 04 FIT KamLAND + global solar<br />
6.0 +1.7<br />
−1.6<br />
19 SMY 04 FIT global solar<br />
6.0 +2.5<br />
−1.6<br />
2.8–12.0<br />
3.2–19.1<br />
20 SMY<br />
21 AHMAD<br />
22 FUKUDA<br />
04<br />
02B<br />
02<br />
FIT<br />
FIT<br />
FIT<br />
SKAM + SNO<br />
global solar<br />
global solar<br />
1 AHARMIM 10 global solar neutrino data include SNO’s low-energy-threshold analysis<br />
survival probability day/night curves, SNO Phase III integral rates (AHARMIM 08), Cl<br />
(CLEVELAND 98), SAGE (ABDURASHITOV 09), Gallex/GNO (HAMPEL 99, ALT-<br />
MANN 05), Borexino (ARPESELLA 08A), SK-I zenith (HOSAKA 06), and SK-II<br />
day/night spectra (CRAVENS 08).<br />
2 AHARMIM 10 obtained this result by a two-neutrino oscillation analysis using global<br />
solar neutrino data and KamLAND data (ABE 08A). CPT invariance is assumed.<br />
3 AHARMIM 10 obtained this result by a two-neutrino oscillation analysis using global<br />
solar neutrino data.<br />
4 AHARMIM 10 obtained this result by a three-neutrino oscillation analysis with the value<br />
of Δm2 31 fixed to 2.3 × 10⁻³ eV2 , using global solar neutrino data and KamLAND data<br />
(ABE 08A). CPT invariance is assumed.<br />
5 AHARMIM 10 obtained this result by a three-neutrino oscillation analysis with the value<br />
of Δm2 31 fixed to 2.3 × 10⁻³ eV2 , using global solar neutrino data.<br />
6 ABE 08A obtained this result by a rate + shape + time combined geoneutrino and reactor<br />
two-neutrino fit for Δm2 21 and tan2θ12 , using KamLAND data only.<br />
HTTP://PDG.LBL.GOV Page 15 Created: 6/16/2011 12:06
Citation: K. Nakamura et al. (<strong>Particle</strong> <strong>Data</strong> <strong>Group</strong>), JP G 37, 075021 (2010) and 2011 partial update for the 2012 edition (URL: http://pdg.lbl.gov)<br />
7 ABE 08A obtained this result by means of a two-neutrino fit using KamLAND, Homestake,<br />
SAGE, GALLEX, GNO, SK (zenith angle and E-spectrum), the SNO χ 2 -map, and solar<br />
flux data. CPT invariance is assumed.<br />
8 AHARMIM 08 obtained this result by a two-neutrino oscillation analysis using all solar<br />
neutrino data including those of Borexino (ARPESELLA 08A) and Super-Kamiokande-I<br />
(HOSAKA 06), and KamLAND data (ABE 08A). CPT invariance is assumed.<br />
9 HOSAKA 06 obtained this result by a two-neutrino oscillation analysis using solar neutrino<br />
and KamLAND data (ARAKI 05). CPT invariance is assumed.<br />
10 HOSAKA 06 obtained this result by a two-neutrino oscillation analysis using the data from<br />
Super-Kamiokande, SNO (AHMAD 02 and AHMAD 02B), and KamLAND (ARAKI 05)<br />
experiments. CPT invariance is assumed.<br />
11 HOSAKA 06 obtained this result by a two-neutrino oscillation analysis using the Super-<br />
Kamiokande and SNO (AHMAD 02 and AHMAD 02B) solar neutrino data.<br />
12 HOSAKA 06 obtained this result from the consistency between the observed and expected<br />
day-night flux asymmetry amplitude. The listed 68% CL range is derived from the 1σ<br />
boundary of the amplitude fit to the data. Oscillation parameters are constrained to be<br />
in the LMA region. The mixing angle is fixed at tan 2 θ = 0.44 because the fit depends<br />
only very weekly on it.<br />
13 AHARMIM 05A obtained this result by a two-neutrino oscillation analysis using solar<br />
neutrino and KamLAND data (ARAKI 05). CPT invariance is assumed. AHARMIM 05A<br />
also quotes Δ(m 2 )=(8.0 +0.6<br />
−0.4 ) × 10−5 eV 2 as the error enveloping the 68% CL twodimensional<br />
region.<br />
14 AHARMIM 05A obtained this result by a two-neutrino oscillation analysis using the data<br />
from all solar neutrino experiments. The listed range of the parameter envelops the<br />
95% CL two-dimensional region shown in figure 35a of AHARMIM 05A. AHARMIM05A<br />
also quotes Δ(m 2 )=(6.5 +4.4<br />
−2.3 ) × 10−5 eV 2 as the error enveloping the 68% CL twodimensional<br />
region.<br />
15 ARAKI 05 obtained this result by a two-neutrino oscillation analysis using KamLAND<br />
and solar neutrino data. CPT invariance is assumed. The 1σ error shown here is provided<br />
by the KamLAND collaboration. The error quoted in ARAKI 05, Δ(m2 )=(7.9 +0.6<br />
−0.5<br />
) ×<br />
10−5 , envelops the 68% CL two-dimensional region.<br />
16 AHMED 04A obtained this result by a two-neutrino oscillation analysis using solar neutrino<br />
and KamLAND data (EGUCHI 03). CPT invariance is assumed. AHMED 04A<br />
also quotes Δ(m2 )=(7.1 +1.2<br />
−0.6 ) × 10−5 eV2 as the error enveloping the 68% CL twodimensional<br />
region.<br />
17 AHMED 04A obtained this result by a two-neutrino oscillation analysis using the data<br />
from all solar neutrino experiments. The listed range of the parameter envelops the 95%<br />
CL two-dimensional region shown in Fig. 5(a) of AHMED 04A. The best-fit point is<br />
Δ(m2 )=6.5 × 10⁻⁵ eV2 ,tan2θ =0.40 (sin22 θ =0.82).<br />
18 SMY 04 obtained this result by a two-neutrino oscillation analysis using solar neutrino<br />
and KamLAND data (IANNI 03). CPT invariance is assumed.<br />
19 SMY 04 obtained this result by a two-neutrino oscillation analysis using the data from<br />
all solar neutrino experiments. The 1σ errors are read from Fig. 6(a) of SMY 04.<br />
20 SMY 04 obtained this result by a two-neutrino oscillation analysis using the Super-<br />
Kamiokande and SNO (AHMAD 02 and AHMAD 02B) solar neutrino data. The 1σ<br />
errors are read from Fig. 6(a) of SMY 04.<br />
21 AHMAD 02B obtained this result by a two-neutrino oscillation analysis using the data<br />
from all solar neutrino experiments. The listed range of the parameter envelops the 95%<br />
CL two-dimensional region shown in Fig. 4(b) of AHMAD 02B. The best fit point is<br />
Δ(m2 )=5.0 × 10⁻⁵ eV2 and tanθ =0.34 (sin22 θ = 0.76).<br />
22 FUKUDA 02 obtained this result by a two-neutrino oscillation analysis using the data<br />
from all solar neutrino experiments. The listed range of the parameter envelops the 95%<br />
CL two-dimensional region shown in Fig. 4 of FUKUDA 02. The best fit point is Δ(m2 )<br />
=6.9 × 10⁻⁵ eV2 and tan2θ =0.38 (sin22 θ = 0.80).<br />
HTTP://PDG.LBL.GOV Page 16 Created: 6/16/2011 12:06
Citation: K. Nakamura et al. (<strong>Particle</strong> <strong>Data</strong> <strong>Group</strong>), JP G 37, 075021 (2010) and 2011 partial update for the 2012 edition (URL: http://pdg.lbl.gov)<br />
sin2 sin (2θ23) 2 sin (2θ23) 2 sin (2θ23) 2 (2θ23) The ranges below correspond to the projection onto the sin2 (2θ23 ) axis of the 90%<br />
CL contours in the sin2 (2θ23 ) − Δm2 plane presented by the authors.<br />
32<br />
VALUE DOCUMENT ID TECN COMMENT<br />
>0.92<br />
>0.92 1 ASHIE 05 SKAM Super-Kamiokande<br />
•••We do not use the following data for averages, fits, limits, etc. •••<br />
>0.965 2 WENDELL 10 SKAM 3ν oscillation with solar terms; θ13 =0<br />
>0.95 3 WENDELL 10 SKAM 3ν oscillation; normal mass hierarchy<br />
>0.93 4 WENDELL 10 SKAM 3ν oscillation; inverted mass hierarchy<br />
>0.85 ADAMSON 08A MINS MINOS<br />
>0.2 5 ADAMSON 06 MINS atmospheric ν with far detector<br />
>0.59 6 AHN 06A K2K KEK to Super-K<br />
>0.7 7 MICHAEL 06 MINS MINOS<br />
>0.58 8 ALIU 05 K2K KEK to Super-K<br />
>0.6 9 ALLISON 05 SOU2<br />
>0.80 10 AMBROSIO 04 MCRO MACRO<br />
>0.90 11 ASHIE 04 SKAM L/E distribution<br />
>0.30 12 AHN 03 K2K KEK to Super-K<br />
>0.45 13 AMBROSIO 03 MCRO MACRO<br />
>0.77 14 AMBROSIO 03 MCRO MACRO<br />
>0.50 15 SANCHEZ 03 SOU2 Soudan-2 Atmospheric<br />
>0.80 16 AMBROSIO 01 MCRO upward μ<br />
>0.82 17 AMBROSIO 01 MCRO upward μ<br />
>0.45 18 FUKUDA 99C SKAM upward μ<br />
>0.70 19 FUKUDA 99D SKAM upward μ<br />
>0.30 20 FUKUDA 99D SKAM stop μ / through<br />
>0.82 21 FUKUDA 98C SKAM Super-Kamiokande<br />
>0.30 22 HATAKEYAMA98 KAMI Kamiokande<br />
>0.73 23 HATAKEYAMA98 KAMI Kamiokande<br />
>0.65 24 FUKUDA 94 KAMI Kamiokande<br />
1 ASHIE 05 obtained this result by a two-neutrino oscillation analysis using 92 kton yr<br />
atmospheric neutrino data from the complete Super-Kamiokande I running period.<br />
2 WENDELL 10 obtained this result (sin2θ23 =0.407–0.583) by a three-neutrino oscillation<br />
analysis using the Super-Kamiokande-I+II+III atmospheric neutrino data, assuming<br />
θ13 = 0 but including the solar oscillation parameters Δm2 21 and sin2θ12 in the fit.<br />
3 WENDELL 10 obtained this result (sin2θ23 =0.43–0.61) by a three-neutrino oscillation<br />
analysis with one mass scale dominance (Δm2 = 0) using the Super-Kamiokande-<br />
21<br />
I+II+III atmospheric neutrino data, and updates the HOSAKA 06A result.<br />
4 WENDELL 10 obtained this result (sin2θ23 =0.44–0.63) by a three-neutrino oscillation<br />
analysis with one mass scale dominance (Δm2 = 0) using the Super-Kamiokande-<br />
21<br />
I+II+III atmospheric neutrino data, and updates the HOSAKA 06A result.<br />
5 ADAMSON 06 obtained this result by a two-neutrino oscillation analysis of the L/E<br />
distribution using 4.54 kton yr atmospheric neutrino data with the MINOS far detector.<br />
6 Supercedes ALIU 05.<br />
7 MICHAEL 06 best fit is for maximal mixing. See also ADAMSON 08.<br />
8 Thebestfitisformaximalmixing.<br />
9 ALLISON 05 result is based upon atmospheric neutrino interactions including upwardstopping<br />
muons, with an exposure of 5.9 kton yr. From a two-flavor oscillation analysis<br />
the best-fit point is Δm2 = 0.0017 eV2 and sin2 (2θ) = 0.97.<br />
HTTP://PDG.LBL.GOV Page 17 Created: 6/16/2011 12:06
Citation: K. Nakamura et al. (<strong>Particle</strong> <strong>Data</strong> <strong>Group</strong>), JP G 37, 075021 (2010) and 2011 partial update for the 2012 edition (URL: http://pdg.lbl.gov)<br />
10 AMBROSIO 04 obtained this result, without using the absolute normalization of the<br />
neutrino flux, by combining the angular distribution of upward through-going muon tracks<br />
with Eμ > 1GeV,Nlow and Nhigh , and the numbers of InDown + UpStop and InUp<br />
events. Here, Nlow and Nhigh are the number of events with reconstructed neutrino<br />
energies < 30 GeV and > 130 GeV, respectively. InDown and InUp represent events<br />
with downward and upward-going tracks starting inside the detector due to neutrino<br />
interactions, while UpStop represents entering upward-going tracks which stop in the<br />
detector. The best fit is for maximal mixing.<br />
11 ASHIE 04 obtained this result from the L(flight length)/E(estimated neutrino energy)<br />
distribution of νμ disappearance probability, using the Super-Kamiokande-I 1489 live-day<br />
atmospheric neutrino data.<br />
12 There are several islands of allowed region from this K2K analysis, extending to high<br />
values of Δm2 . We only include the one that overlaps atmospheric neutrino analyses.<br />
Thebestfitisformaximalmixing.<br />
13 AMBROSIO 03 obtained this result on the basis of the ratio R = Nlow /Nhigh ,where<br />
Nlow and Nhigh are the number of upward through-going muon events with reconstructed<br />
neutrino energy < 30 GeV and > 130 GeV, respectively. The data came from<br />
the full detector run started in 1994. The method of FELDMAN 98 is used to obtain<br />
the limits.<br />
14 AMBROSIO 03 obtained this result by using the ratio R and the angular distribution<br />
of the upward through-going muons. R is given in the previous note and the angular<br />
distribution is reported in AMBROSIO 01. The method of FELDMAN 98 is used to<br />
obtain the limits. The best fit is to maximal mixing.<br />
15 SANCHEZ 03 is based on an exposure of 5.9 kton yr. The result is obtained using a<br />
likelihood analysis of the neutrino L/E distribution for a selection μ flavor sample while<br />
the e-flavor sample provides flux normalization. The method of FELDMAN 98 is used<br />
to obtain the allowed region. The best fit is sin2 (2θ) = 0.97.<br />
16 AMBROSIO 01 result is based on the angular distribution of upward through-going muon<br />
tracks with Eμ > 1 GeV. The data came from three different detector configurations, but<br />
the statistics is largely dominated by the full detector run, from May 1994 to December<br />
2000. The total live time, normalized to the full detector configuration is 6.17 years.<br />
The best fit is obtained outside the physical region. The method of FELDMAN 98 is<br />
used to obtain the limits. The best fit is for maximal mixing.<br />
17 AMBROSIO 01 result is based on the angular distribution and normalization of upward<br />
through-going muon tracks with Eμ > 1 GeV. See the previous footnote.<br />
18 FUKUDA 99C obtained this result from a total of 537 live days of upward through-going<br />
muon data in Super-Kamiokande between April 1996 to January 1998. With a threshold<br />
of Eμ > 1.6 GeV, the observed flux is (1.74 ± 0.07 ± 0.02) × 10−13 cm−2s−1sr−1 .<br />
Thebestfitissin2 (2θ) = 0.95.<br />
19 FUKUDA 99D obtained this result from a simultaneous fitting to zenith angle distributions<br />
of upward-stopping and through-going muons. The flux of upward-stopping muons of<br />
minimum energy of 1.6 GeV measured between April 1996 and January 1998 is (0.39 ±<br />
0.04 ± 0.02) × 10−13 cm−2s−1sr−1 . This is compared to the expected flux of (0.73 ±<br />
0.16 (theoretical error)) × 10−13 cm−2s−1sr−1 . The best fit is to maximal mixing.<br />
20 FUKUDA 99D obtained this result from the zenith dependence of the upwardstopping/through-going<br />
flux ratio. The best fit is to maximal mixing.<br />
21 FUKUDA 98C obtained this result by an analysis of 33.0 kton yr atmospheric neutrino<br />
data. The best fit is for maximal mixing.<br />
22 HATAKEYAMA 98 obtained this result from a total of 2456 live days of upward-going<br />
muon data in Kamiokande between December 1985 and May 1995. With a threshold of<br />
Eμ > 1.6 GeV, the observed flux of upward through-going muons is (1.94±0.10 +0.07<br />
−0.06 )×<br />
10−13 cm−2s−1sr−1 . This is compared to the expected flux of (2.46 ± 0.54 (theoretical<br />
error)) × 10−13 cm−2s−1sr−1 . The best fit is for maximal mixing.<br />
HTTP://PDG.LBL.GOV Page 18 Created: 6/16/2011 12:06
Citation: K. Nakamura et al. (<strong>Particle</strong> <strong>Data</strong> <strong>Group</strong>), JP G 37, 075021 (2010) and 2011 partial update for the 2012 edition (URL: http://pdg.lbl.gov)<br />
23 HATAKEYAMA 98 obtained this result from a combined analysis of Kamiokande contained<br />
events (FUKUDA 94) and upward going muon events. The best fit is sin 2 (2θ) =<br />
0.95.<br />
24 FUKUDA 94 obtained the result by a combined analysis of sub- and multi-GeV atmospheric<br />
neutrino events in Kamiokande. The best fit is for maximal mixing.<br />
Δm2 Δm<br />
32<br />
2 Δm32 2 Δm<br />
32<br />
2 32<br />
The sign of Δm2 is not known at this time. Only the absolute value is quoted below.<br />
32<br />
Unless otherwise specified, the ranges below correspond to the projection onto the<br />
Δm2 32 axis of the 90% CL contours in the sin2 (2θ23 ) − Δm2 plane presented by<br />
32<br />
the authors.<br />
VALUE (10 −3 eV 2 ) CL% DOCUMENT ID TECN COMMENT<br />
2.43±0.13<br />
2.43±0.13 68 ADAMSON 08A MINS MINOS<br />
•••We do not use the following data for averages, fits, limits, etc. •••<br />
1.9 - 2.6 1 WENDELL 10 SKAM 3ν osc.; normal mass hierarchy<br />
1.7 - 2.7 1 WENDELL 10 SKAM 3ν osc.; inverted mass hierarchy<br />
0.07–50 2 ADAMSON 06 MINS atmospheric ν with far detector<br />
1.9–4.0 3,4 AHN 06A K2K KEK to Super-K<br />
2.2–3.8 5 MICHAEL 06 MINS MINOS<br />
1.9–3.6 3 ALIU 05 K2K KEK to Super-K<br />
0.3–12 6 ALLISON 05 SOU2<br />
1.5–3.4 7 ASHIE 05 SKAM atmospheric neutrino<br />
0.6–8.0 8 AMBROSIO 04 MCRO MACRO<br />
1.9 to 3.0 9 ASHIE 04 SKAM L/E distribution<br />
1.5–3.9 10 AHN 03 K2K KEK to Super-K<br />
0.25–9.0 11 AMBROSIO 03 MCRO MACRO<br />
0.6–7.0 12 AMBROSIO 03 MCRO MACRO<br />
0.15–15 13 SANCHEZ 03 SOU2 Soudan-2 Atmospheric<br />
0.6–15 14 AMBROSIO 01 MCRO upward μ<br />
1.0–6.0 15 AMBROSIO 01 MCRO upward μ<br />
1.0–50 16 FUKUDA 99C SKAM upward μ<br />
1.5–15.0 17 FUKUDA 99D SKAM upward μ<br />
0.7–18 18 FUKUDA 99D SKAM stop μ / through<br />
0.5–6.0 19 FUKUDA 98C SKAM Super-Kamiokande<br />
0.55–50 20 HATAKEYAMA98 KAMI Kamiokande<br />
4–23 21 HATAKEYAMA98 KAMI Kamiokande<br />
5–25 22 FUKUDA 94 KAMI Kamiokande<br />
1 WENDELL 10 obtained this result by a three-neutrino oscillation analysis with one mass<br />
scale dominance (Δm2 = 0) using the Super-Kamiokande-I+II+III atmospheric neu-<br />
21<br />
trino data, and updates the HOSAKA 06A result.<br />
2 ADAMSON 06 obtained this result by a two-neutrino oscillation analysis of the L/E<br />
distribution using 4.54 kton yr atmospheric neutrino data with the MINOS far detector.<br />
3 The best fit in the physical region is for Δm2 =2.8 × 10⁻³ eV2 .<br />
4 Supercedes ALIU 05.<br />
5 MICHAEL 06 best fit is 2.74 × 10⁻³ eV2 . See also ADAMSON 08.<br />
6 ALLISON 05 result is based on an atmospheric neutrino observation with an exposure of<br />
5.9 kton yr. From a two-flavor oscillation analysis the best-fit point is Δm2 = 0.0017<br />
eV2 and sin22 θ = 0.97.<br />
7 ASHIE 05 obtained this result by a two-neutrino oscillation analysis using 92 kton yr<br />
atmospheric neutrino data from the complete Super-Kamiokande I running period. The<br />
best fit is for Δm2 =2.1 × 10⁻³ eV2 .<br />
HTTP://PDG.LBL.GOV Page 19 Created: 6/16/2011 12:06
Citation: K. Nakamura et al. (<strong>Particle</strong> <strong>Data</strong> <strong>Group</strong>), JP G 37, 075021 (2010) and 2011 partial update for the 2012 edition (URL: http://pdg.lbl.gov)<br />
8 AMBROSIO 04 obtained this result, without using the absolute normalization of the<br />
neutrino flux, by combining the angular distribution of upward through-going muon tracks<br />
with Eμ > 1GeV,Nlow and Nhigh , and the numbers of InDown + UpStop and InUp<br />
events. Here, Nlow and Nhigh are the number of events with reconstructed neutrino<br />
energies < 30 GeV and > 130 GeV, respectively. InDown and InUp represent events<br />
with downward and upward-going tracks starting inside the detector due to neutrino<br />
interactions, while UpStop represents entering upward-going tracks which stop in the<br />
detector. The best fit is for Δm2 =2.3 × 10⁻³ eV2 .<br />
9 ASHIE 04 obtained this result from the L(flight length)/E(estimated neutrino energy)<br />
distribution of νμ disappearance probability, using the Super-Kamiokande-I 1489 live-day<br />
atmospheric neutrino data. The best fit is for Δm2 =2.4 × 10⁻³ eV2 .<br />
10 There are several islands of allowed region from this K2K analysis, extending to high<br />
values of Δm2 . We only include the one that overlaps atmospheric neutrino analyses.<br />
ThebestfitisforΔm2 =2.8 × 10⁻³ eV2 .<br />
11 AMBROSIO 03 obtained this result on the basis of the ratio R = Nlow /Nhigh ,where<br />
Nlow and Nhigh are the number of upward through-going muon events with reconstructed<br />
neutrino energy < 30 GeV and > 130 GeV, respectively. The data came from<br />
the full detector run started in 1994. The method of FELDMAN 98 is used to obtain<br />
the limits. The best fit is for Δm2 =2.5 × 10⁻³ eV2 .<br />
12 AMBROSIO 03 obtained this result by using the ratio R and the angular distribution<br />
of the upward through-going muons. R is given in the previous note and the angular<br />
distribution is reported in AMBROSIO 01. The method of FELDMAN 98 is used to<br />
obtain the limits. The best fit is for Δm2 =2.5 × 10⁻³ eV2 .<br />
13 SANCHEZ 03 is based on an exposure of 5.9 kton yr. The result is obtained using a<br />
likelihood analysis of the neutrino L/E distribution for a selection μ flavor sample while<br />
the e-flavor sample provides flux normalization. The method of FELDMAN 98 is used<br />
to obtain the allowed region. The best fit is for Δm2 =5.2 × 10⁻³ eV2 .<br />
14 AMBROSIO 01 result is based on the angular distribution of upward through-going muon<br />
tracks with Eμ > 1 GeV. The data came from three different detector configurations, but<br />
the statistics is largely dominated by the full detector run, from May 1994 to December<br />
2000. The total live time, normalized to the full detector configuration is 6.17 years.<br />
The best fit is obtained outside the physical region. The method of FELDMAN 98 is<br />
used to obtain the limits.<br />
15 AMBROSIO 01 result is based on the angular distribution and normalization of upward<br />
through-going muon tracks with Eμ > 1 GeV. See the previous footnote.<br />
16 FUKUDA 99C obtained this result from a total of 537 live days of upward through-going<br />
muon data in Super-Kamiokande between April 1996 to January 1998. With a threshold<br />
of Eμ > 1.6 GeV, the observed flux is (1.74 ± 0.07 ± 0.02) × 10−13 cm−2s−1sr−1 .<br />
ThebestfitisforΔm2 =5.9 × 10⁻³ eV2 .<br />
17 FUKUDA 99D obtained this result from a simultaneous fitting to zenith angle distributions<br />
of upward-stopping and through-going muons. The flux of upward-stopping muons of<br />
minimum energy of 1.6 GeV measured between April 1996 and January 1998 is (0.39 ±<br />
0.04 ± 0.02) × 10−13 cm−2s−1sr−1 . This is compared to the expected flux of (0.73 ±<br />
0.16 (theoretical error)) × 10−13 cm−2s−1sr−1 .ThebestfitisforΔm2 =3.9×10⁻³ eV2 .<br />
18 FUKUDA 99D obtained this result from the zenith dependence of the upwardstopping/through-going<br />
flux ratio. The best fit is for Δm2 =3.1 × 10⁻³ eV2 .<br />
19 FUKUDA 98C obtained this result by an analysis of 33.0 kton yr atmospheric neutrino<br />
data. The best fit is for Δm2 =2.2 × 10⁻³ eV2 .<br />
20 HATAKEYAMA 98 obtained this result from a total of 2456 live days of upward-going<br />
muon data in Kamiokande between December 1985 and May 1995. With a threshold of<br />
Eμ > 1.6 GeV, the observed flux of upward through-going muons is (1.94±0.10 +0.07<br />
−0.06 )×<br />
HTTP://PDG.LBL.GOV Page 20 Created: 6/16/2011 12:06
Citation: K. Nakamura et al. (<strong>Particle</strong> <strong>Data</strong> <strong>Group</strong>), JP G 37, 075021 (2010) and 2011 partial update for the 2012 edition (URL: http://pdg.lbl.gov)<br />
10 −13 cm −2 s −1 sr −1 . This is compared to the expected flux of (2.46 ± 0.54 (theoretical<br />
error)) × 10 −13 cm −2 s −1 sr −1 .ThebestfitisforΔm 2 =2.2 × 10 −3 eV 2 .<br />
21 HATAKEYAMA 98 obtained this result from a combined analysis of Kamiokande contained<br />
events (FUKUDA 94) and upward going muon events. The best fit is for Δm 2 =<br />
13 × 10 −3 eV 2 .<br />
22 FUKUDA 94 obtained the result by a combined analysis of sub- and multi-GeV atmospheric<br />
neutrino events in Kamiokande. The best fit is for Δm 2 =16× 10 −3 eV 2 .<br />
sin2 sin (2θ13) 2 sin (2θ13) 2 sin (2θ13) 2 (2θ13) At present time, direct limits of sin2 (2 θ13 ) are derived from the search for the reactor<br />
νe disappearance at distances corresponding to the Δm2 value, i.e. L ∼ 1km.<br />
32<br />
Alternatively, limits can also be obtained from the analysis of the solar neutrino data<br />
and accelerator-based νμ → νe experiments.<br />
VALUE CL% DOCUMENT ID TECN COMMENT<br />
Citation: K. Nakamura et al. (<strong>Particle</strong> <strong>Data</strong> <strong>Group</strong>), JP G 37, 075021 (2010) and 2011 partial update for the 2012 edition (URL: http://pdg.lbl.gov)<br />
6 AHARMIM 10 obtained this result by a three-neutrino oscillation analysis with the value<br />
of Δm2 31 fixed to 2.3 × 10⁻³ eV2 , using global solar neutrino data.<br />
7 WENDELL 10 obtained this result by a three-neutrino oscillation analysis with one mass<br />
scale dominance (Δm2 = 0) using the Super-Kamiokande-I+II+III atmospheric neu-<br />
21<br />
trino data, and updates the HOSAKA 06A result.<br />
8 The quoted limit is for Δm2 =2.43 × 10<br />
32 −3 eV2 , θ23 = π/2, and δ =0. Forother<br />
values of δ, the 68% CL region spans from 0.02 to 0.26.<br />
9 The quoted limit is for Δm2 =2.43 × 10<br />
32 −3 eV2 , θ23 = π/2, and δ =0. Forother<br />
values of δ, the 68% CL region spans from 0.04 to 0.34.<br />
10 FOGLI 08 obtained this result from a global analysis of all neutrino oscillation data, that<br />
is, solar + KamLAND + atmospheric + accelerator long baseline + CHOOZ.<br />
11 FOGLI 08 obtained this result from an analysis using the solar and KamLAND neutrino<br />
oscillation data.<br />
12 FOGLI 08 obtained this result from an analysis using the atmospheric, accelerator long<br />
baseline, and CHOOZ neutrino oscillation data.<br />
13 YAMAMOTO 06 searched for νμ → νe appearance. Assumes 2 sin2 (2θμe ) =<br />
sin2 (2θ13 ). The quoted limit is for Δm2 32 =1.9 × 10⁻³ eV2 . That value of Δm2 32 is<br />
the one-σ low value for AHN 06A. FortheAHN06Abest fit value of 2.8 × 10⁻³ eV2 ,<br />
the sin2 (2θ13 ) limit is < 0.26. Supersedes AHN 04.<br />
14 AHN 04 searched for νμ → νe appearance. Assuming 2 sin2 (2 θμe )=sin2 (2 θ13 ), a<br />
limit on sin2 (2 θμe ) is converted to a limit on sin2 (2 θ13 ).The quoted limit is for Δm2 32<br />
=1.9 × 10⁻³ eV2 . That value of Δm2 is the one-σ low value for ALIU 05. For the<br />
32<br />
ALIU 05 best fit value of 2.8 × 10⁻³ eV2 ,thesin2 (2 θ13 ) limit is < 0.30.<br />
15 The quoted limit is for Δm2 =1.9 × 10<br />
32 −3 eV2 . That value of Δm2 is the 1-σ low<br />
32<br />
value for ALIU 05. For the ALIU 05 best fit value of 2.8×10⁻³ eV2 ,thesin22θ13 limit<br />
is < 0.19. In this range, the θ13 limit is larger for lower values of Δm2 , and smaller<br />
32<br />
forhighervaluesofΔm2 32 .<br />
16 The quoted limit is for Δm2 =1.9 × 10<br />
32 −3 eV2 . That value of Δm2 is the 1-σ low<br />
32<br />
value for ALIU 05. For the ALIU 05 best fit value of 2.8 × 10⁻³ eV2 ,thesin22θ13 limit is < 0.23.<br />
(C) Other neutrino mixing results<br />
The LSND collaboration reported in AGUILAR 01 a signal which is consistent<br />
with νμ → νe oscillations. In a three neutrino framework, this would<br />
be a measurement of θ12 and Δm2 . This does not appear to be consis-<br />
21<br />
tent with the interpretation of other neutrino data. The MiniBooNE experiment,<br />
reported in AGUILAR-AREVALO 07, does a two-neutrino analysis<br />
which, assuming CPT conservation, rules out AGUILAR 01. The following<br />
listings include results which might be relevant towards understanding<br />
these observations. They include searches for νμ → νe , νμ → νe , sterile<br />
neutrino oscillations, and CPT violation.<br />
HTTP://PDG.LBL.GOV Page 22 Created: 6/16/2011 12:06
Citation: K. Nakamura et al. (<strong>Particle</strong> <strong>Data</strong> <strong>Group</strong>), JP G 37, 075021 (2010) and 2011 partial update for the 2012 edition (URL: http://pdg.lbl.gov)<br />
Δ(m2 )forsin2 Δ(m (2θ) =1 (νμ → νe) 2 )forsin2 Δ(m (2θ) =1 (νμ → νe) 2 )forsin2 Δ(m (2θ) =1 (νμ → νe) 2 )forsin2 (2θ) =1 (νμ → νe) VALUE (eV 2 ) CL% DOCUMENT ID TECN COMMENT<br />
•••We do not use the following data for averages, fits, limits, etc. •••<br />
Citation: K. Nakamura et al. (<strong>Particle</strong> <strong>Data</strong> <strong>Group</strong>), JP G 37, 075021 (2010) and 2011 partial update for the 2012 edition (URL: http://pdg.lbl.gov)<br />
4 ATHANASSOPOULOS 98 report (0.26 ± 0.10 ± 0.05)% for the oscillation probability;<br />
the value of sin 2 2θ for large Δm 2 is deduced from this probability. See footnote in<br />
preceding table for further details, and see the paper for a plot showing allowed regions.<br />
If effect is due to oscillation, it is most likely to be intermediate sin 2 2θ and Δm 2 . See<br />
also ATHANASSOPOULOS 98B.<br />
5 LOVERRE 96 uses the charged-current to neutral-current ratio from the combined<br />
CHARM (ALLABY 86) and CDHS (ABRAMOWICZ 86) data from 1986.<br />
6 VILAIN 94C limit derived by combining the νμ and ν μ data assuming CP conservation.<br />
Δ(m2 )forsin2 Δ(m (2θ) =1 (νμ → νe) 2 )forsin2 Δ(m (2θ) =1 (νμ → νe) 2 )forsin2 Δ(m (2θ) =1 (νμ → νe) 2 )forsin2 (2θ) =1 (νμ → νe) VALUE (eV2 ) CL% DOCUMENT ID TECN COMMENT<br />
•••We do not use the following data for averages, fits, limits, etc. •••<br />
0.03–0.09 90 1 AGUILAR-AR...10 MBOO Eν > 475 MeV<br />
0.03–0.07 90 2 AGUILAR-AR...10 MBOO Eν > 200 MeV<br />
Citation: K. Nakamura et al. (<strong>Particle</strong> <strong>Data</strong> <strong>Group</strong>), JP G 37, 075021 (2010) and 2011 partial update for the 2012 edition (URL: http://pdg.lbl.gov)<br />
(0.34 +0.20<br />
−0.18<br />
± 0.07)%. For a different interpretation, see HILL 95. Replaced by<br />
ATHANASSOPOULOS 96.<br />
7 HILL 95 is a report by one member of the LSND Collaboration, reporting a different conclusion<br />
from the analysis of the data of this experiment (see ATHANASSOPOULOS 95).<br />
Contrary to the rest of the LSND Collaboration, Hill finds no evidence for the neutrino<br />
oscillation νμ → νe and obtains only upper limits.<br />
8 FREEDMAN 93 is a search at LAMPF for νe generated from any of the three neutrino<br />
types νμ , νμ ,andνewhich come from the beam stop. The νe ’s would be detected by<br />
the reaction νe p → e + n. FREEDMAN 93 replaces DURKIN 88.<br />
sin2 (2θ) for “Large” Δ(m2 sin ) (νμ→νe) 2 (2θ) for “Large” Δ(m2 sin ) (νμ→νe) 2 (2θ) for “Large” Δ(m2 sin ) (νμ→νe) 2 (2θ) for “Large” Δ(m2 ) (νμ→νe) VALUE (units 10 −3 ) CL% DOCUMENT ID TECN COMMENT<br />
•••We do not use the following data for averages, fits, limits, etc. •••<br />
0.4–9.0 99 1 AGUILAR-AR...10 MBOO Eν > 475 MeV<br />
0.4–9.0 99 2 AGUILAR-AR...10 MBOO Eν > 200 MeV<br />
Citation: K. Nakamura et al. (<strong>Particle</strong> <strong>Data</strong> <strong>Group</strong>), JP G 37, 075021 (2010) and 2011 partial update for the 2012 edition (URL: http://pdg.lbl.gov)<br />
Δ(m2 )forsin2 Δ(m (2θ) =1 (νμ (νμ) → νe (νe)) 2 )forsin2 Δ(m (2θ) =1 (νμ (νμ) → νe (νe)) 2 )forsin2 Δ(m (2θ) =1 (νμ (νμ) → νe (νe)) 2 )forsin2 (2θ) =1 (νμ (νμ) → νe (νe)) VALUE (eV 2 ) CL% DOCUMENT ID TECN COMMENT<br />
Citation: K. Nakamura et al. (<strong>Particle</strong> <strong>Data</strong> <strong>Group</strong>), JP G 37, 075021 (2010) and 2011 partial update for the 2012 edition (URL: http://pdg.lbl.gov)<br />
Search for ν μ → ν s<br />
VALUE DOCUMENT ID TECN COMMENT<br />
•••We do not use the following data for averages, fits, limits, etc. •••<br />
1 AMBROSIO 01 MCRO matter effects<br />
2 FUKUDA 00 SKAM neutral currents + matter effects<br />
1 AMBROSIO 01 tested the pure 2-flavor νμ → ν s hypothesis using matter effects which<br />
change the shape of the zenith-angle distribution of upward through-going muons. With<br />
maximum mixing and Δ(m 2 ) around 0.0024 eV 2 ,theν μ → ν s oscillation is disfavored<br />
with 99% confidence level with respect to the ν μ → ν τ hypothesis.<br />
2 FUKUDA 00 tested the pure 2-flavor νμ → ν s hypothesis using three complementary<br />
atmospheric-neutrino data samples. With this hypothesis, zenith-angle distributions are<br />
expected to show characteristic behavior due to neutral currents and matter effects.<br />
In the Δ(m 2 )andsin 2 2θ region preferred by the Super-Kamiokande data, the ν μ →<br />
ν s hypothesis is rejected at the 99% confidence level, while the ν μ → ν τ hypothesis<br />
consistently fits all of the data sample.<br />
<br />
Δm2 21 − Δm2 <br />
Δm2 21 − Δm<br />
21<br />
2 <br />
Δm2 21 − Δm21 2 <br />
Δm2 21 − Δm<br />
21<br />
2 <br />
21<br />
CPT tests<br />
VALUE (10 −4 eV 2 ) CL% DOCUMENT ID TECN COMMENT<br />
•••We do not use the following data for averages, fits, limits, etc. •••<br />
Citation: K. Nakamura et al. (<strong>Particle</strong> <strong>Data</strong> <strong>Group</strong>), JP G 37, 075021 (2010) and 2011 partial update for the 2012 edition (URL: http://pdg.lbl.gov)<br />
ALIU 05 PRL 94 081802 E. Aliu et al. (K2K Collab.)<br />
ALLISON 05 PR D72 052005 W.W.M. Allison et al. (SOUDAN-2 Collab.)<br />
ALTMANN 05 PL B616 174 M. Altmann et al. (GNO Collab.)<br />
ARAKI 05 PRL 94 081801 T. Araki et al. (KamLAND Collab.)<br />
ASHIE 05 PR D71 112005 Y. Ashie et al. (Super-Kamiokande Collab.)<br />
DEGOUVEA 05 PR D71 093002 A. de Gouvea, C. Pena-Garay<br />
AHARMIM 04 PR D70 093014 B. Aharmim et al. (SNO Collab.)<br />
AHMED 04A PRL 92 181301 S.N. Ahmed et al. (SNO Collab.)<br />
AHN 04 PRL 93 051801 M.H. Ahn et al. (K2K Collab.)<br />
AMBROSIO 04 EPJ C36 323 M. Ambrosio et al. (MACRO Collab.)<br />
ASHIE 04 PRL 93 101801 Y. Ashie et al. (Super-Kamiokande Collab.)<br />
EGUCHI 04 PRL 92 071301 K. Eguchi et al. (KamLAND Collab.)<br />
SMY 04 PR D69 011104R M.B. Smy et al. (Super-Kamiokande Collab.)<br />
AHN 03 PRL 90 041801 M.H. Ahn et al. (K2K Collab.)<br />
AMBROSIO 03 PL B566 35 M. Ambrosio et al. (MACRO Collab.)<br />
APOLLONIO 03 EPJ C27 331 M. Apollonio et al. (CHOOZ Collab.)<br />
ASTIER 03 PL B570 19 P. Astier et al. (NOMAD Collab.)<br />
EGUCHI 03 PRL 90 021802 K. Eguchi et al. (KamLAND Collab.)<br />
GANDO 03 PRL 90 171302 Y. Gando et al. (Super-Kamiokande Collab.)<br />
IANNI 03 JPG 29 2107 A. Ianni (INFN Gran Sasso)<br />
SANCHEZ 03 PR D68 113004 M. Sanchez et al. (Soudan 2 Collab.)<br />
ABDURASHI... 02 JETP 95 181 J.N. Abdurashitov et al. (SAGE Collab.)<br />
Translated from ZETF 122 211.<br />
AHMAD 02 PRL 89 011301 Q.R. Ahmad et al. (SNO Collab.)<br />
AHMAD 02B PRL 89 011302 Q.R. Ahmad et al. (SNO Collab.)<br />
ARMBRUSTER 02 PR D65 112001 B. Armbruster et al. (KARMEN 2 Collab.)<br />
AVVAKUMOV 02 PRL 89 011804 S. Avvakumov et al. (NuTeV Collab.)<br />
FUKUDA 02 PL B539 179 S. Fukuda et al. (Super-Kamiokande Collab.)<br />
AGUILAR 01 PR D64 112007 A. Aguilar et al. (LSND Collab.)<br />
AHMAD 01 PRL 87 071301 Q.R. Ahmad et al. (SNO Collab.)<br />
AMBROSIO 01 PL B517 59 M. Ambrosio et al. (MACRO Collab.)<br />
BOEHM 01 PR D64 112001 F. Boehm et al.<br />
FUKUDA 01 PRL 86 5651 S. Fukuda et al. (Super-Kamiokande Collab.)<br />
AMBROSIO 00 PL B478 5 M. Ambrosio et al. (MACRO Collab.)<br />
BOEHM 00 PRL 84 3764 F. Boehm et al.<br />
FUKUDA 00 PRL 85 3999 S. Fukuda et al. (Super-Kamiokande Collab.)<br />
ALLISON 99 PL B449 137 W.W.M. Allison et al. (Soudan 2 Collab.)<br />
APOLLONIO 99 PL B466 415 M. Apollonio et al. (CHOOZ Collab.)<br />
Also PL B472 434 (erratum) M. Apollonio et al. (CHOOZ Collab.)<br />
FUKUDA 99C PRL 82 2644 Y. Fukuda et al. (Super-Kamiokande Collab.)<br />
FUKUDA 99D PL B467 185 Y. Fukuda et al. (Super-Kamiokande Collab.)<br />
HAMPEL 99 PL B447 127 W. Hampel et al. (GALLEX Collab.)<br />
AMBROSIO 98 PL B434 451 M. Ambrosio et al. (MACRO Collab.)<br />
APOLLONIO 98 PL B420 397 M. Apollonio et al. (CHOOZ Collab.)<br />
ATHANASSO... 98 PRL 81 1774 C. Athanassopoulos et al. (LSND Collab.)<br />
ATHANASSO... 98B PR C58 2489 C. Athanassopoulos et al. (LSND Collab.)<br />
CLEVELAND 98 APJ 496 505 B.T. Cleveland et al. (Homestake Collab.)<br />
FELDMAN 98 PR D57 3873 G.J. Feldman, R.D. Cousins<br />
FUKUDA 98C PRL 81 1562 Y. Fukuda et al. (Super-Kamiokande Collab.)<br />
HATAKEYAMA 98 PRL 81 2016 S. Hatakeyama et al. (Kamiokande Collab.)<br />
CLARK 97 PRL 79 345 R. Clark et al. (IMB Collab.)<br />
ROMOSAN 97 PRL 78 2912 A. Romosan et al. (CCFR Collab.)<br />
AGLIETTA 96 JETPL 63 791 M. Aglietta et al. (LSD Collab.)<br />
Translated from ZETFP 63 753.<br />
ATHANASSO... 96 PR C54 2685 C. Athanassopoulos et al. (LSND Collab.)<br />
ATHANASSO... 96B PRL 77 3082 C. Athanassopoulos et al. (LSND Collab.)<br />
FUKUDA 96 PRL 77 1683 Y. Fukuda et al. (Kamiokande Collab.)<br />
FUKUDA 96B PL B388 397 Y. Fukuda et al. (Kamiokande Collab.)<br />
GREENWOOD 96 PR D53 6054 Z.D. Greenwood et al. (UCI, SVR, SCUC)<br />
HAMPEL 96 PL B388 384 W. Hampel et al. (GALLEX Collab.)<br />
LOVERRE 96 PL B370 156 P.F. Loverre<br />
ACHKAR 95 NP B434 503 B. Achkar et al. (SING, SACLD, CPPM, CDEF+)<br />
AHLEN 95 PL B357 481 S.P. Ahlen et al. (MACRO Collab.)<br />
ATHANASSO... 95 PRL 75 2650 C. Athanassopoulos et al. (LSND Collab.)<br />
DAUM 95 ZPHY C66 417 K. Daum et al. (FREJUS Collab.)<br />
HILL 95 PRL 75 2654 J.E. Hill (PENN)<br />
MCFARLAND 95 PRL 75 3993 K.S. McFarland et al. (CCFR Collab.)<br />
DECLAIS 94 PL B338 383 Y. Declais et al.<br />
FUKUDA 94 PL B335 237 Y. Fukuda et al. (Kamiokande Collab.)<br />
VILAIN 94C ZPHY C64 539 P. Vilain et al. (CHARM II Collab.)<br />
FREEDMAN 93 PR D47 811 S.J. Freedman et al. (LAMPF E645 Collab.)<br />
HTTP://PDG.LBL.GOV Page 28 Created: 6/16/2011 12:06
Citation: K. Nakamura et al. (<strong>Particle</strong> <strong>Data</strong> <strong>Group</strong>), JP G 37, 075021 (2010) and 2011 partial update for the 2012 edition (URL: http://pdg.lbl.gov)<br />
BECKER-SZ... 92B PR D46 3720 R.A. Becker-Szendy et al. (IMB Collab.)<br />
BEIER 92 PL B283 446 E.W. Beier et al. (KAM2 Collab.)<br />
Also PTRSL A346 63 E.W. Beier, E.D. Frank (PENN)<br />
BORODOV... 92 PRL 68 274 L. Borodovsky et al. (COLU, JHU, ILL)<br />
HIRATA 92 PL B280 146 K.S. Hirata et al. (Kamiokande II Collab.)<br />
CASPER 91 PRL 66 2561 D. Casper et al. (IMB Collab.)<br />
HIRATA 91 PRL 66 9 K.S. Hirata et al. (Kamiokande II Collab.)<br />
KUVSHINN... 91 JETPL 54 253 A.A. Kuvshinnikov et al. (KIAE)<br />
BERGER 90B PL B245 305 C. Berger et al. (FREJUS Collab.)<br />
HIRATA 90 PRL 65 1297 K.S. Hirata et al. (Kamiokande II Collab.)<br />
AGLIETTA 89 EPL 8 611 M. Aglietta et al. (FREJUS Collab.)<br />
DAVIS 89 ARNPS 39 467 R. Davis, A.K. Mann, L. Wolfenstein (BNL, PENN+)<br />
OYAMA 89 PR D39 1481 Y. Oyama et al. (Kamiokande II Collab.)<br />
BIONTA 88 PR D38 768 R.M. Bionta et al. (IMB Collab.)<br />
DURKIN 88 PRL 61 1811 L.S. Durkin et al. (OSU, ANL, CIT+)<br />
ABRAMOWICZ 86 PRL 57 298 H. Abramowicz et al. (CDHS Collab.)<br />
ALLABY 86 PL B177 446 J.V. Allaby et al. (CHARM Collab.)<br />
ANGELINI 86 PL B179 307 C. Angelini et al. (PISA, ATHU, PADO+)<br />
VUILLEUMIER 82 PL 114B 298 J.L. Vuilleumier et al. (CIT, SIN, MUNI)<br />
BOLIEV 81 SJNP 34 787 M.M. Boliev et al. (INRM)<br />
Translated from YAF 34 1418.<br />
KWON 81 PR D24 1097 H. Kwon et al. (CIT, ISNG, MUNI)<br />
BOEHM 80 PL 97B 310 F. Boehm et al. (ILLG, CIT, ISNG, MUNI)<br />
CROUCH 78 PR D18 2239 M.F. Crouch et al. (CASE, UCI, WITW)<br />
HTTP://PDG.LBL.GOV Page 29 Created: 6/16/2011 12:06