A cArbon cApture And storAge network for yorkshire And humber
A cArbon cApture And storAge network for yorkshire And humber
A cArbon cApture And storAge network for yorkshire And humber

Create successful ePaper yourself
Turn your PDF publications into a flip-book with our unique Google optimized e-Paper software.
1<br />
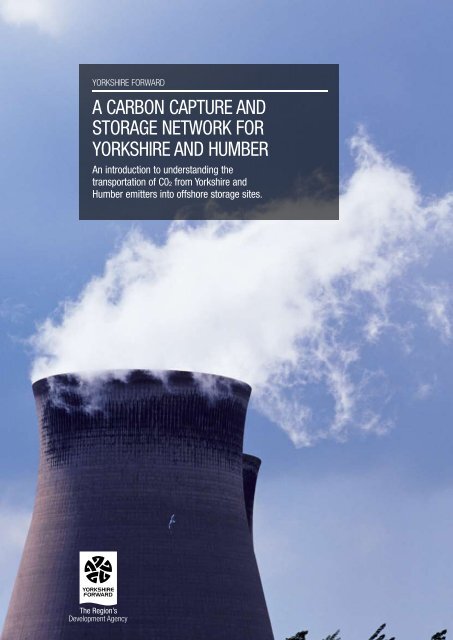
YORKSHIRE FORWARD<br />
A <strong>cArbon</strong> <strong>cApture</strong> <strong>And</strong><br />
<strong>storAge</strong> <strong>network</strong> <strong>for</strong><br />
<strong>yorkshire</strong> <strong>And</strong> <strong>humber</strong><br />
An introduction to understanding the<br />
transportation of c02 from <strong>yorkshire</strong> and<br />
<strong>humber</strong> emitters into offshore storage sites.
2<br />
CONTENTS<br />
Carbon Capture and Storage Network<br />
1.0 Non-technical summary 4<br />
2.0 Introduction 6<br />
3.0 Scope of works 8<br />
3.1 Introduction 8<br />
3.2 Study area 8<br />
3.3 Tiered sources 9<br />
3.3.1 Division by emitter flow 9<br />
3.3.2 Tier 0 sources 9<br />
3.3.3 Tier 1 sources 9<br />
3.3.4 Tier 2 sources 9<br />
3.3.5 Proportion of emissions 9<br />
3.4 Study period 11<br />
3.5 Hydrogen <strong>network</strong> 11<br />
3.6 EU Flagship Programme <strong>for</strong> CCS 11<br />
4.0 Yorkshire and Humber region emitters 12<br />
4.1 Introduction 12<br />
4.2 In<strong>for</strong>mation on Tier 0 emitters 12<br />
5.0 Carbon dioxide entry specification 14<br />
5.1 Introduction 14<br />
5.2 Possible impurities 14<br />
5.3 Properties of carbon dioxide 14<br />
5.4 Contamination issues 14<br />
5.5 Properties of carbon dioxide mixtures 14<br />
5.6 Technical impact 15<br />
5.7 Legislative requirements 16<br />
5.8 Offshore legislation 16<br />
5.9 Typical stream compositions post capture 16<br />
5.10 Water content 18<br />
5.11 Safety impacts 19<br />
5.12 Project specification 19<br />
6.0 Onshore and <strong>network</strong> design 20<br />
6.1 Network and scenario definitions 20<br />
6.2 Network 20<br />
6.2.1 Primary factors <strong>for</strong> pipeline route selection 20<br />
6.2.2 Design assumptions 20<br />
6.2.3 Operating philosophy 20<br />
6.2.4 Design life 20<br />
6.2.5 Metering 21<br />
6.2.6 Corrosion protection 21<br />
6.2.7 Network phasing 21<br />
6.2.8 Network design tool 21<br />
6.3 Area analysis 21<br />
6.3.1 General description 21<br />
6.3.2 Area restrictions 21<br />
6.4 Network <strong>for</strong>mation 22<br />
6.4.1 Ring main 22<br />
6.4.2 Tree/distributed structure 22<br />
6.5 Selection of export terminal location 23<br />
7.0 Offshore routes and storage 24<br />
7.1 Storage options 24<br />
7.2 Data sources 24<br />
7.3 Alternate storage and competing uses<br />
<strong>for</strong> depleted gas fields 24<br />
7.4 Co-ordination of decommissioning and<br />
re-use of existing assets 24<br />
7.5 Injection pressure 25<br />
7.6 Saline aquifers 25<br />
7.7 Gas field selection 25<br />
7.7.1 Availability timeline 25<br />
7.7.2 Distance selection 25<br />
7.7.3 Injectivity 25<br />
7.7.4 Decommissioning of gas fields in the study period 25<br />
7.8 Pipeline routes 28<br />
7.9 Summary of core routes 29<br />
7.10 Offshore route choice 29<br />
7.11 Decommissioning of offshore pipelines 29
8.0 Deployment scenarios 30<br />
8.1 Development of the <strong>network</strong> 30<br />
8.2 Central scenario 30<br />
8.2.1 Scenario concept 30<br />
8.3 Low growth scenario 31<br />
8.3.1 Scenario concept 31<br />
8.4 High scenario 32<br />
8.4.1 Scenario concept 32<br />
8.5 Stand-alone comparison 32<br />
8.6 Scenario quantities 32<br />
9.0 Economics 34<br />
9.1 Introduction 34<br />
9.2 Cost benefit analysis 34<br />
9.3 Uncertainty in inputs 34<br />
9.4 Discount rate 35<br />
9.5 Method and interpretation of cost calculations 36<br />
9.6 Results 37<br />
10.0 Conclusion 40<br />
11.0 Recommendations 42<br />
11.1 Government 42<br />
11.2 Economic work 42<br />
11.3 Technical 43<br />
11.4 Carbon 43<br />
11.5 Social 43<br />
11.6 Safety 43<br />
12.0 Glossary 44<br />
References & appendices 46<br />
Appendix a 47<br />
Appendix b 48<br />
Tables<br />
Table 3.1 Definition of Tier emitter classifications 9<br />
Table 5.1 Coal fired plant post comb capture 18<br />
Table 5.2 Coal fired plant IGCC 18<br />
Table 5.3 Coal fired plant oxy fuel 18<br />
Table 5.4 Weyburn / Dakota gasification plant<br />
entry specification 18<br />
Table 5.5 Dynamis SP3 recommended<br />
entry specification 19<br />
Table 5.6 Recommended entry specification 19<br />
Table 7.1 Potential storage sites – gas field 27<br />
Carbon Capture and Storage Network 3<br />
Table 7.2 Potential storage sites – saline aquifer 27<br />
Table 7.3 Summary of core routes 29<br />
Table 8.1 Cumulative carbon dioxide stored<br />
<strong>for</strong> scenarios 33<br />
Table 9.1 Cumulative capital cost 38<br />
Table 9.2 Cumulative CO2 carbon dioxide stored 38<br />
Table 9.3 Cumulative average cost £/tonne 39<br />
table 9.4 Cumulative average cost £/tonne best<br />
standalone comparison 39<br />
Figures<br />
Figure 1.1 Schematic of possible CCS systems 5<br />
Figure 1.2 Emitters and storage possibilities<br />
in the Humber 5<br />
Figure 2.1 Global emission scenarios 7<br />
Figure 3.1 General study area 8<br />
Figure 3.2 Study area with Tier 0 emitters<br />
and existing gas terminals 8<br />
Figure 3.3 Emitter locations in study area 10<br />
Figure 3.4 Proportion of emissions 10<br />
Figure 4.1 Carbon capture systems 13<br />
Figure 4.2 Predicted operating costs <strong>for</strong><br />
power station technologies 13<br />
Figure 5.1 Carbon dioxide phase diagram 15<br />
Figure 5.2 Property deviations <strong>for</strong> carbon dioxide<br />
– nitrogen 16<br />
Figure 5.3 Variation in critical parameters<br />
<strong>for</strong> carbon dioxide – nitrogen 17<br />
Figure 5.4 Phase envelope changes with increasing impurity 17<br />
Figure 6.1 Example of phased <strong>network</strong> pipelines 21<br />
Figure 6.2 Pipeline route congestion point – Hull<br />
– Beverley gap 22<br />
Figure 6.3 Pipeline route congestion point<br />
– Trent crossing 22<br />
Figure 6.4 Schematic example of a ring main <strong>network</strong> 23<br />
Figure 6.5 Schematic example of a tree<br />
structure <strong>network</strong> 23<br />
Figure 7.1 Overview of UK oil and gas fields<br />
including the Utsira aquifer 26<br />
Figure 8.1 General <strong>network</strong> route showing<br />
alternative offshore routes 30<br />
Figure 8.2 Stored carbon dioxide per year <strong>for</strong> scenarios 33
4 Carbon Capture and Storage Network<br />
1.0 NON-TECHNICAL SUMMARY<br />
Climate change is a reality that we now have<br />
to face. Over the last century emissions into<br />
the atmosphere of greenhouse gases has<br />
risen exponentially and now threatens to<br />
fundamentally change the world in which<br />
we live. It is now accepted that this<br />
increased growth must be stopped by<br />
controlling our energy needs and developing<br />
new industrial processes and ways of<br />
generating power that emit far less of these<br />
harmful gases. The single largest contributor<br />
to this change is the level of atmospheric<br />
carbon dioxide (CO2) from use of fossil fuels.<br />
It is this gas that is the focus of a global<br />
ef<strong>for</strong>t to reduce emissions.<br />
The challenge <strong>for</strong> policymakers and<br />
industry is to accelerate deployment of<br />
capture technology and developing the<br />
necessary transportation and storage<br />
infrastructure. Key to this acceleration is in<br />
understanding the technical and economical<br />
issues of developing infrastructure, and<br />
the timeframes involved, in order to allow<br />
investment decisions to be made.<br />
The Yorkshire and Humber region produces<br />
around 90mt of CO2 emissions annually, the<br />
majority from single point industrial or power<br />
generation sources. The region also has a<br />
coastline adjacent to the rapidly depleting<br />
gas reservoirs of the southern North Sea.<br />
This unique coincidence of high levels of<br />
CO2 emissions and proximity to storage<br />
sites means that the development of a low<br />
cost CO2 transport <strong>network</strong> would position<br />
the region to be the first and potentially<br />
lowest cost user of these depleting gas<br />
fields <strong>for</strong> carbon storage.<br />
Carbon capture and storage (CCS) is<br />
one approach that is considered by the<br />
Stern Review as essential to provide a<br />
lower carbon future. Fitted first to large<br />
point sources of CO2, CCS will allow the<br />
continued use of fossil fuels through carbon<br />
abatement, until replacement low carbon<br />
processes can come to maturity. There<strong>for</strong>e<br />
CCS is an essential requirement to combat<br />
climate change whilst maintaining security of<br />
energy supply.<br />
It is important to understand how CCS<br />
works and the elements involved. It begins<br />
when CO2 is produced by an industrial<br />
process such as burning coal or natural<br />
gas. The CO2 produced is first separated,<br />
then normally compressed into a liquid<br />
and transported by pipeline to a suitable<br />
storage or sequestration site where the CO2<br />
can be permanently stored. The transport<br />
system encompasses compressors,<br />
pumps, onshore and an offshore pipeline<br />
to deliver the CO2 to the storage site. This<br />
study considers the provision of a transport<br />
system <strong>for</strong> the Yorkshire and Humber<br />
region, illustrated by the sections show<br />
in blue in figure 1.1.<br />
This work was commissioned under the<br />
auspices of the Carbon Capture and<br />
Storage Partnership <strong>for</strong> Yorkshire and<br />
Humber. This is a stakeholder group<br />
convened by Yorkshire Forward to stimulate<br />
the development of a CCS <strong>network</strong> in<br />
the region. The study was managed by a<br />
steering group led by Yorkshire Forward with<br />
contributions from steering group members.<br />
The study aimed to understand the options<br />
<strong>for</strong> the most economic <strong>network</strong> <strong>for</strong> transport<br />
of CO2 to storage from the emitters in the<br />
region, based mostly on publicly available<br />
data. The area of concern is essentially a<br />
rectangle, bound by the coast in the east<br />
and Castle<strong>for</strong>d in the west. The northern<br />
boundary to the study area is taken as a<br />
line across the southern edge of Beverley<br />
whilst the southern boundary by a line from<br />
the southern edge of Scunthorpe, see figure<br />
1.2. Contained within this area are 12 large<br />
emitters plus 10 medium and 14 small<br />
emitters. The large emitters alone represent<br />
over 60 million tonnes of CO2 emissions a<br />
year, approximately 10% of the total CO2<br />
emissions <strong>for</strong> the UK.<br />
The report uses scenarios covering all<br />
currently <strong>for</strong>eseen stationary emitters of over<br />
5 thousand tonnes CO2/year, and capturing<br />
between 33% and 73% of emissions by<br />
2030. The study shows that there is storage<br />
available under all scenarios <strong>for</strong> these<br />
emissions out to at least 2050.<br />
To address the health, safety and<br />
environmental questions regarding CO2<br />
transport this study has allowed <strong>for</strong> the<br />
maximum use of existing infrastructure,<br />
however further discussions will be required<br />
with the Health and Safety Executive and<br />
other stakeholders to ensure consent <strong>for</strong><br />
any new infrastructure. It is <strong>for</strong>tunate that<br />
the area already has much larger and more<br />
complex industrial activities which the local<br />
community and work <strong>for</strong>ce has experience<br />
of and can use <strong>for</strong> comparison when<br />
considering this new infrastructure.<br />
The study shows that with an appropriate<br />
level of industrial co-operation including the<br />
re-use of suitable existing infrastructure,<br />
a transport <strong>network</strong> can be initiated at<br />
reasonable cost using existing pipelines to<br />
complement the need <strong>for</strong> new infrastructure.<br />
Furthermore, continuing R&D on CCS<br />
processes should also enable a reduction<br />
in costs.<br />
Currently each carbon capture project has<br />
to develop its own transport and storage<br />
solution. Earlier studies have assumed that<br />
CO2 transport <strong>network</strong>s would develop<br />
as a matter of course. In reality strategic<br />
leadership will be required to bring them<br />
to fruition.<br />
On a like <strong>for</strong> like basis, and with the support<br />
of public and private bodies to initiate a<br />
<strong>network</strong> in Yorkshire and Humber, this<br />
study shows that <strong>for</strong> every emitter<br />
linking into a <strong>network</strong> is more cost<br />
effective than a stand-alone solution.<br />
Even <strong>for</strong> the ideally located emitter with ideal<br />
emissions profile, entering a <strong>network</strong> is the<br />
cheapest option and other emitters, both<br />
large and small, have higher CO2 transport<br />
costs in the absence of a <strong>network</strong>.<br />
This study assumes that the current level<br />
of industrial activity will continue. However,<br />
a viable CO2 transport <strong>network</strong> could also<br />
attract new economic activity attracting<br />
companies seeking a system <strong>for</strong> safe and<br />
cost effective CO2 transport and storage.<br />
By 2030 CO2 capture and storage using<br />
this <strong>network</strong> could be adding about £1.2bn<br />
per year of economic activity to the region<br />
through EU-ETS credits alone.<br />
If the transport <strong>network</strong> was constructed in<br />
2008 the total investment described in this<br />
study has a cost of approximately £2 billion.<br />
This excludes the investment in capture<br />
plant at the emission source and the<br />
storage site facilities, which are not within<br />
the scope of this transport study.<br />
The system described in this study could<br />
transport approximately 320 million tonnes<br />
of CO2 in total up to 2030, 850 million<br />
tonnes in total by 2040, and may store<br />
1,500 million tonnes of CO2 by 2050. To<br />
give a sense of scale 1,500 million tonnes<br />
is equivalent to the emissions from all the<br />
present cars in the UK <strong>for</strong> 75 years.<br />
For the central scenario used in this<br />
study the average present cost is<br />
approximately £1.70 per tonne <strong>for</strong> all<br />
the CO2 transported by 2040, depending<br />
on the assumptions used.
This study presents a cost, as opposed<br />
to a revenue model. There<strong>for</strong>e, it is not<br />
linked to the European Emissions Trading<br />
Scheme price of CO2 or financing of the<br />
investment in the transport infrastructure.<br />
In addition the commercial rate paid by<br />
an emitter will depend on how quickly<br />
the <strong>network</strong> grows and how ownership<br />
of the <strong>network</strong> is managed. Of particular<br />
importance is the financial cost of the timing<br />
difference between expenditure in transport<br />
infrastructure and revenue from transporting<br />
CO2. For example an early plant unable<br />
to share a transport pipeline and linked to<br />
one store will have high costs, but strategic<br />
coordination of capture plant, pipelines and<br />
equipment with shared offshore storage will<br />
reduce costs.<br />
The ability to develop a cluster of large<br />
capture sites and suitable storage<br />
sites will be the key to a successful<br />
<strong>network</strong>. Depleted gas reservoirs must<br />
be decommissioned to be available <strong>for</strong><br />
use as CO2 storage sites. The study area<br />
compactly offers a timely combination of<br />
these opportunities as shown in figure 1.2.<br />
The study recommends that Yorkshire<br />
Forward and other regional bodies promote<br />
the development of a cluster of carbon<br />
capture ready industrial sites to be an early<br />
material action to justify investment in an<br />
efficient CO2 transport and storage system,<br />
driven by the co-operation by the capture<br />
site organisations and regional bodies.<br />
The UK government clarifies a process <strong>for</strong><br />
funding support through an appropriate<br />
mechanism to facilitate investment in this<br />
clustered approach to CCS deployment.<br />
<strong>And</strong> that Yorkshire Forward commissions<br />
a cost benefit analysis to understand the<br />
wider economic, social and environmental<br />
enhancements that would arise from a<br />
region wide CCS <strong>network</strong>.<br />
In conclusion this study has evolved the<br />
work of the North Sea Basin Task Force by<br />
focusing on a key region by considering in<br />
some detail the CO2 transport component<br />
of a regional CCS <strong>network</strong>. The study<br />
provides realistic costs <strong>for</strong> consideration by<br />
government, regional bodies and industry<br />
when planning <strong>for</strong> the strategic options to<br />
significantly reduce CO2 emissions in the UK<br />
through the development of carbon capture<br />
and storage.<br />
Carbon Capture and Storage Network 5<br />
Figure 1.1 Schematic of possible CCS systems<br />
Reproduced courtesy of the IPCC from IPCC Special Report on<br />
carbon dioxide capture and storage, page 4 Fig SPM.1<br />
Figure 1.2 Emitters and storage possibilities in the Humber
6<br />
2.0 INTRODUCTION<br />
Removal of CO2 from flue gases in<br />
power stations or other large single point<br />
emitters and storing it underground is<br />
potentially one of the most cost effective<br />
methods of tackling climate change.<br />
The UK government is keen to develop and<br />
deploy CCS, and the study area represents<br />
the largest cluster of CO2 sources in the<br />
UK. The UK also has an abundance of<br />
underground storage possibilities in the<br />
<strong>for</strong>m of depleted North Sea oil and gas<br />
fields, saline aquifers, salt caverns and<br />
disused coal mines.<br />
The Energy White Paper of 2007 [13]<br />
highlights two major challenges <strong>for</strong> the<br />
UK; tackling CO2 emissions and the<br />
maintenance of secure and af<strong>for</strong>dable<br />
energy supplies. The deployment of CCS is<br />
one approach of addressing both challenges<br />
and the White Paper makes the case <strong>for</strong><br />
CCS, particularly in conjunction with cleaner<br />
coal power generation. Coal still offers an<br />
abundance of relatively cheap, reliable<br />
energy that can be sourced from UK and,<br />
is likely to remain one of the UK’s main<br />
sources of power generation <strong>for</strong> at least<br />
the next 25 years.<br />
Carbon Capture and Storage Network<br />
The Stern Review [1] investigated the<br />
impact of climate change on the world’s<br />
economy. It highlighted that carbon capture<br />
and storage has a role in the medium term,<br />
whilst alternative energies and industrial<br />
processes are given time to develop and<br />
mature. To prevent the consequences<br />
mentioned in the Stern Review and detailed<br />
by the IPCC [6], levels of CO2 must peak in<br />
the near future with concentrations of CO2<br />
stabilising between 440ppm and 550ppm.<br />
Figure 2.1 opposite identifies possible<br />
scenarios on global CO2 emissions. CCS<br />
has the potential to contribute up to 55% of<br />
the CO2 mitigations required to ensure that<br />
emissions peak early.<br />
Government legislation could drive this<br />
market; however, global CCS deployment<br />
necessitates a stable, global price <strong>for</strong><br />
carbon, above the costs required <strong>for</strong> this<br />
technology, to ensure a reasonable rate of<br />
return. Applications of CCS to China and<br />
India’s coal powered plants are crucial to<br />
ensure that global emissions peak as shown<br />
in the graph.<br />
Current methods of extraction can remove<br />
around 90% of the CO2 from flue gases;<br />
however this then must be cleaned, dried<br />
and compressed <strong>for</strong> transportation via<br />
pipeline to the storage locations. This report<br />
will examine the transportation issues and<br />
solutions, producing <strong>network</strong> designs to<br />
accommodate various scenarios envisaged,<br />
finally arriving at a cost <strong>for</strong> transportation<br />
of the CO2.<br />
This study arose from discussion between<br />
Yorkshire Forward and AMEC, and<br />
engagement with the major emitters in<br />
the Yorkshire and Humber area and some<br />
operators of southern North Sea gas fields,<br />
unions, and other interested parties.<br />
A meeting of the Carbon Capture and<br />
Storage Partnership <strong>for</strong> Yorkshire and<br />
Humber led to this work, funded by<br />
Yorkshire Forward with contributions from<br />
AMEC, ConocoPhillips, Corus, Drax Power<br />
Ltd, E.ON UK, Hydrogen Energy, Power<br />
Ltd, Scottish & Southern Energy plc, and<br />
Shell. A steering group to oversee the study<br />
comprised these organisations and the<br />
TUC. The steering group was chaired<br />
by Yorkshire Forward.<br />
The work builds on a previous study done<br />
<strong>for</strong> the International Energy Authority<br />
Greenhouse Gas R&D Programme (IEA<br />
GHG) which included discussion of a<br />
potential <strong>network</strong> <strong>for</strong> the Mersey-Dee area<br />
on the west coast [14]. The model used <strong>for</strong><br />
that study was used with kind permission of<br />
IEA GHG, with additional analysis. It differs<br />
by more economic analysis, doing stepwise<br />
development of the <strong>network</strong> through time<br />
under different growth scenarios, and<br />
multiple offshore storage constraints.
Figure 2.1 Global emission scenarios<br />
Global Emissions (GtCO2e)<br />
70<br />
60<br />
50<br />
40<br />
30<br />
20<br />
10<br />
Carbon Capture and Storage Network 7<br />
0<br />
2000 2020 2040 2060 2080 2100<br />
2015 High Peak – 1.0%/yr<br />
2020 High Peak – 2.5%/yr<br />
2030 High Peak – 4.0%/yr<br />
2040 High Peak – 4.5%/yr (overshoot)<br />
2020 Low Peak – 1.5%/yr<br />
2030 Low Peak – 2.5%/yr<br />
2040 Low Peak – 3.0%/yr
8 Carbon Capture and Storage Network<br />
3.0 SCOPE OF WORKS<br />
Yorkshire and Humber Region<br />
Figure 3.1 General study area<br />
Figure 3.2 Study area with Tier 0 emitters and existing gas terminals<br />
Study Area<br />
Motorways<br />
A Roads<br />
A/B Roads<br />
Railway<br />
Boundary<br />
Local<br />
Authority<br />
Boundary<br />
Docks<br />
Airport<br />
3.1 INTRODUCTION<br />
The scope of this project and subsequent<br />
report is summarised in three aims:<br />
• Develop the most economic <strong>network</strong> to<br />
transport available CO2 emissions from<br />
stationary emitters in the region from<br />
capture to permanent storage.<br />
• Provide CO2 emitters an effective route<br />
to storage that is on balance (cost, safety,<br />
environmental consenting, planning<br />
approvals, public perception, timely)<br />
more attractive to them than a<br />
standalone solution.<br />
• Create a <strong>network</strong> group to mutually in<strong>for</strong>m<br />
members, execute work including studies<br />
and public engagement and generate<br />
collective value that is jointly owned.<br />
As a first step to achieve these aims<br />
a number of tasks were undertaken:<br />
• Data collection <strong>for</strong> the region<br />
• Discussion with emitters and storage<br />
site owners<br />
• Evaluating storage solutions<br />
• D evelop a technical basis <strong>for</strong> gas quality<br />
entering the system<br />
• Develop <strong>network</strong> scenarios<br />
• Model and cost the <strong>network</strong>.<br />
3.2 STUDY AREA<br />
The area indicated in figure 3.2 represents<br />
the catchment area <strong>for</strong> the stationary<br />
emitters of CO2. This area falls within<br />
Yorkshire Forward’s boundaries and<br />
contains the main clusters of large emitters<br />
in the region. The area around Immingham<br />
and Grimsby has a high concentration of<br />
emitters in the <strong>for</strong>m of refineries, steelworks<br />
and power stations. Three large coal-fired<br />
power stations, located along the M62,<br />
are also captured in this study area. The<br />
steel plant at Scunthorpe also lies within<br />
the study area. The Humberside area,<br />
figure 3.1, is considered feasible <strong>for</strong> carbon<br />
capture and storage as it has a large<br />
amount of emitters located close to possible<br />
storage sites.
Table 3.1 Definition of Tier emitter classifications<br />
Figure 1.2 shows the location of the larger<br />
emitters (over 1mtCO2/year) in the study<br />
area. Large thermal power plants are<br />
indicated by red squares and blue dots,<br />
whilst the purple squares represent possible<br />
future projects. Non-energy producers<br />
of CO2 are shown in orange. Yellow dots<br />
shown indicate potential export points;<br />
both shown are Easington (northerly) and<br />
Theddlethorpe (southerly). Although the<br />
existing pipelines and gas export facilities<br />
will not be utilised, it was assumed that it<br />
would be easier to obtain planning consent<br />
if the proposed pipelines crossed the coast<br />
at the same point.<br />
3.3 TIERED SOURCES<br />
3.3.1 Division by emitter flow<br />
Emitters can be ranked by their allowances<br />
allocated under the EU-ETS. This allows<br />
the consideration of an area in terms of not<br />
only size of emitter but also the capability<br />
and economic ability of an emitter to join<br />
a transmission <strong>network</strong>. This methodology<br />
was previously used in a project <strong>for</strong> the<br />
International Energy Agency (IEA GHG)<br />
[14] to test a <strong>network</strong> design and costing<br />
programme. Table 3.1 shows the definitions<br />
applying to the classification of an emitter by<br />
size, and a detailed list of emitters can be<br />
found in Appendix B.<br />
Carbon Capture and Storage Network 9<br />
Tier Classification Emitter Size Emitter Range Typical Emitter Types<br />
(Generalisation) Tonnes CO2/year<br />
0 Large +1 million Coal fired power station<br />
Major hydrocarbon refinery<br />
Major steel works<br />
Large CCGT power station<br />
1 Medium 50,000 to 1 million Chemical, glass, food processors,<br />
large CHP & power stations<br />
CCGT power station<br />
2 Small 1,000 to 50,000 CHP units, hospitals,<br />
Varied Industrial process<br />
In considering a <strong>network</strong> and how emitters<br />
can connect to it a number of factors<br />
must be considered including the size of<br />
the emitter, the capacity to capture and<br />
transmit CO2, and the location of the site.<br />
Small emitters such as hospitals will not<br />
necessarily have the technical capability to<br />
operate complex compression equipment<br />
<strong>for</strong> example. By applying tiers to the<br />
emitters in any area a simple but coarse<br />
measure can be applied and some sources,<br />
even whole tiers can be discounted.<br />
It may be more appropriate <strong>for</strong> Tier 1 and<br />
2 sources to be part of a suction system,<br />
transmitting low pressure CO2 to a central<br />
collection point such as larger capable<br />
Tier 0 or Tier 1 sites.<br />
A map of the location of the emitters in<br />
the region is included in figure 3.1 and<br />
Appendix A.<br />
3.3.2 Tier 0 sources<br />
Sources with volumes of CO2 greater than<br />
1mt/year are categorized as Tier 0 sources.<br />
Sources of this magnitude in this area are<br />
power stations, refineries and steel works.<br />
Carbon capture and storage is most<br />
economical in Tier 0 sources due to large<br />
amounts of CO2 available <strong>for</strong> capture, as well<br />
as the availability of land at these sites <strong>for</strong><br />
extraction units. There are 12 such sources<br />
<strong>for</strong> this study.<br />
3.3.3 Tier 1 sources<br />
Sources with volumes of CO2 ranging from<br />
0.05mt/year to 1mt/year are categorized<br />
as Tier 1. These include power and CHP<br />
plants, chemical producers, cement & lime<br />
works, large food & drink producers and<br />
glassworks. Extraction and conditioning<br />
of CO2 from most of these sources is<br />
considered less economic and there is less<br />
drive to reduce CO2 emissions below Best<br />
Available Techniques (BAT).<br />
3.3.4 Tier 2 sources<br />
Those ranging from 1kt CO2/year to<br />
0.5mt CO2/year are Tier 2 sources.<br />
These smaller emitters include local small<br />
power generators, services, hospitals, food<br />
& drink manufacturers as well as small<br />
chemical producers. The relatively small<br />
amounts of CO2 produced at these sites<br />
make them uneconomic or unpractical<br />
<strong>for</strong> CCS, furthermore most are scattered<br />
throughout the area, or located in densely<br />
populated areas, making transportation<br />
of the gas problematic.<br />
3.3.5 proportion of emissions<br />
Emissions taken from the EU-ETS have<br />
resulted in the following proportions shown<br />
in the chart below. The current bulk of the<br />
emissions, 92%, are from Tier 0 sources<br />
and only 8% from combined Tier 1 and<br />
Tier 2 sources, figure 3.4a. Adding future<br />
proposed programmes changes this<br />
proportion to 95.4% <strong>for</strong> Tier 0, figure 3.4b.<br />
This suggests that the trunk line could be<br />
sized to accommodate the Tier 0 emitters,<br />
as there is little impact from smaller emitters<br />
joining the <strong>network</strong>.
10<br />
Figure 3.3 Emitter locations in study area<br />
A larger version of this drawing can be found in Appendix A<br />
Figure 3.4 Proportion of emissions<br />
Tier 1: 6.17%<br />
Tier 2: 1.73%<br />
Tier 0: 92.09%<br />
(a) Current proportions<br />
of emitters in study area<br />
Carbon Capture and Storage Network<br />
Tier 1: 4.23%<br />
Tier 2: 0.67%<br />
Tier 0: 95.10%<br />
(b) proportion of emitters<br />
in study area, including<br />
known future projects
3.4 STUDY pERIOD<br />
This report considers the development of<br />
a CCS <strong>network</strong> over the period of 2013 to<br />
2030. This study period was agreed upon<br />
by the steering group, based on a number<br />
of factors. These being:<br />
• Perceived lifetimes of new builds and<br />
existing emitters and the proposed<br />
timescale <strong>for</strong> new builds in the area.<br />
• The range of dates that coincide with the<br />
availability of depleted gas fields in the<br />
southern North Sea.<br />
• CO2 capture may become a broadly<br />
commercially attractive proposition during<br />
this period as, <strong>for</strong> example, the EU-ETS<br />
matures and CCS is demonstrated.<br />
• That the perceived impact from new<br />
technologies (such as nuclear fusion) has<br />
little effect on emissions in this area over<br />
the specified study period.<br />
3.5 HYDROGEN NETWORK<br />
The steering group wished to review<br />
the interaction of transport of CO2<br />
and hydrogen because of the possible<br />
production of the economic production of<br />
de-carbonised hydrogen in the context of<br />
developing CCS <strong>for</strong> other reasons.<br />
The production of hydrogen occurs during<br />
the capture of CO2 in the pre-combustion<br />
process, see figure 4.1, where CO2 is<br />
separated be<strong>for</strong>e hydrogen and air is used<br />
<strong>for</strong> power production. The hydrogen can<br />
be simply processed and piped rather than<br />
used immediately once it is produced.<br />
This enables large quantities to be made<br />
available <strong>for</strong> other users.<br />
Comparing the spending <strong>for</strong> hydrogen<br />
production, supply and vehicles with<br />
the savings to be gained from replacing<br />
conventional fuel and conventional vehicles<br />
over time, the simulations of the EU HyWays<br />
project [9] predict that the break-even point<br />
would be most likely reached between<br />
2025 and 2035. There are a wide range<br />
of applications <strong>for</strong> hydrogen; in 2030 there<br />
may be 16 million hydrogen cars and the<br />
Carbon Capture and Storage Network 11<br />
total cumulative investment <strong>for</strong> infrastructure<br />
build-up will amount to €60 billion. This<br />
report [9] states that “CCS technologies<br />
extends the time available to develop a full<br />
and durable solution <strong>for</strong> a sustainable power<br />
and fuel provision. The use of hydrogen<br />
in electricity production will broaden the<br />
sectors where such a carrier can be<br />
used in a sustainable way. It will provide<br />
the opportunity to utilise the advantages<br />
offered by hydrogen as demonstrated in the<br />
transport sector, enabling the power sector<br />
to diversify its feedstock’s with very low<br />
CO2 emissions.”<br />
There is another comment that <strong>for</strong> the<br />
UK besides production of hydrogen from<br />
natural gas, biomass and wind energy,<br />
nuclear energy was seen as an option as<br />
was the use of coal. The report showed<br />
that the production of hydrogen from fossil<br />
fuels using carbon capture and storage<br />
could make a significant contribution to<br />
reducing CO2 emissions. Furthermore, the<br />
introduction of hydrogen into the energy<br />
system offers the opportunity to increase<br />
the ratio of renewable energy, and help<br />
the large-scale introduction of intermittent<br />
resources such as wind energy through its<br />
use as a temporary energy storage option.<br />
De-carbonising the fuel is one solution to<br />
the mitigation of CO2 emissions. Sources<br />
of pure hydrogen are already located in<br />
the area in the <strong>for</strong>m of refineries and steel<br />
works. Steel works and refineries are also<br />
major hydrogen customers. There are a<br />
range of applications <strong>for</strong> hydrogen in other<br />
industrial processes but to date there is<br />
no reason to capture the CO2 by-product<br />
except <strong>for</strong> some relatively small uses.<br />
The advent of CCS opens the possibility<br />
of a new low carbon energy vector at a<br />
significant scale.<br />
Whilst the transport and domestic fuel<br />
sectors are longer term, the shorter term<br />
opportunity <strong>for</strong> CSS is its use in the power<br />
industry, to supply de-carbonised fuel to<br />
neighbouring CCGT’s and CHP plant via a<br />
local pipeline. There are fewer drivers <strong>for</strong><br />
extraction of CO2 from CCGT’s, <strong>for</strong> reasons<br />
covered in section 4.2, and many existing<br />
turbines will not be convertible to run purely<br />
on hydrogen. Replacing burners and utilising<br />
suitable gas turbines will enable a number<br />
of power stations to burn a percentage<br />
of piped hydrogen with natural gas, thus<br />
eliminating the need <strong>for</strong> a discrete carbon<br />
capture unit.<br />
Developing a wider hydrogen pipe system<br />
on the back of the CO2 <strong>network</strong> may be a<br />
cost effective development of these new<br />
market opportunities, and will gradually link<br />
to the “hydrogen highways” concepts which<br />
is suggested to extend north to Teesside.<br />
We have found it too early to be specific<br />
about the scale of a viable <strong>network</strong>, but<br />
recommend that the issues of a shared<br />
way-leave between CO2 and H2 pipes be<br />
understood and, <strong>for</strong> certain routes, wayleaves<br />
are designed with this option in mind.<br />
3.6 EU FLAGSHIp pROGRAMME<br />
FOR CCS<br />
To enable commercial deployment of CCS<br />
by 2020, the EU plans to partly fund 10 to<br />
12 full-scale CCS demonstration projects, all<br />
to be operational by 2015. To maximize the<br />
benefits of this scheme, the selection criteria<br />
will be based on:<br />
• Plant process and capture technology<br />
• Method of CO2 storage<br />
• Transport and communications<br />
infrastructure<br />
• Related public communications<br />
• Risk profile<br />
The scheme envisaged that 10 to 12 x<br />
400MW power plants would require a total<br />
funding of €6 to €10billion investment,<br />
based on a Capital Expenditure range of<br />
1500-2300€/kW [15]. This programme<br />
could provide funding <strong>for</strong> a ‘cluster’ of large<br />
emitters, initiating the Yorkshire and Humber<br />
CO2 <strong>network</strong>.
12<br />
4.0 YORKSHIRE AND HUMBER REGION EMITTERS<br />
4.1 INTRODUCTION<br />
Identification of CO2 emitters, planned and<br />
existing, was carried out in conjunction with<br />
Gastec at CRE Ltd. Emitters highlighted<br />
in the EU/UK ETS National Allocation Plan<br />
data as well as knowledge of proposed<br />
facilities through questionnaire response,<br />
and discussion with these organisations<br />
and desktop research, provided the basis<br />
<strong>for</strong> a detailed examination. Feasibility of<br />
each of the emitters joining the <strong>network</strong> will<br />
also effect the likely dates of entry into the<br />
<strong>network</strong>; this is considered in this section of<br />
the report.<br />
4.2 INFORMATION ON<br />
TIER 0 EMITTERS<br />
Feasibility of CCS <strong>for</strong> each of the emitters<br />
greatly depends on the process involved;<br />
there<strong>for</strong>e each will be categorised<br />
by process.<br />
• Existing coal fired power stations<br />
- Drax (Drax Power Ltd)<br />
- Eggborough (British Energy)<br />
- Ferrybridge “C” (Scottish and<br />
Southern Energy)<br />
• Potential IGCC schemes<br />
- Hatfield (Powerfuels Power Ltd)<br />
- Killingholme (E.ON UK)<br />
- ConcocoPhillips<br />
• Existing CCGT power stations/CHP<br />
- South Humber Bank (Centrica)<br />
- Killingholme (Centrica),<br />
- Killingholme (E.ON UK),<br />
- Immingham CHP (phase 1)<br />
- Keadby (Scottish and Southern Energy)<br />
- Saltend Congeneration Plant<br />
(International Power)<br />
• Steel making facility<br />
- Scunthorpe (Corus)<br />
• Refineries<br />
- Lindsay Oil (Total)<br />
- Immingham (ConocoPhillips)<br />
The capture technology used varies with<br />
each process; figure 4.1 simply depicts the<br />
processes involved.<br />
Carbon Capture and Storage Network<br />
Coal fired power stations represent the bulk<br />
of the emissions and would derive greater<br />
benefits from CCS. Any energy intensive<br />
industry that uses coal may be inclined to<br />
seriously consider CCS as the allowances<br />
allocated under the National Allocation Plan<br />
reduces in line with UK and EU targets.<br />
Integrated gasification combined cycle<br />
(IGCC) power stations are based on<br />
gasification technology also used in large<br />
process plants. CCS is perceived to be<br />
less problematic <strong>for</strong> IGCC power stations<br />
as the re<strong>for</strong>med syngas is purely CO2 and<br />
hydrogen. This option <strong>for</strong> production of decarbonised<br />
fuel allows the facility to operate<br />
continuously to produce power or hydrogen,<br />
which then can be sold on to neighbouring<br />
CCGTs or other users. This increased<br />
flexibility will result in higher average<br />
efficiencies if the gasifier component<br />
operates continuously whilst the power<br />
island matches electrical demand.<br />
Combined cycle gas turbines burn natural<br />
gas to produce relatively low concentrations<br />
of CO2, as the fuel is less carbon intensive<br />
and the process has a higher efficiency<br />
compared with coal-fired power plants. The<br />
economics of operating CCS at a CCGT plant<br />
do not compare favourably with IGCC and<br />
post-combustion coal. This is mainly due to<br />
the lower concentrations of CO2 in the flue<br />
gases, as well as the increased fuel costs<br />
to counter the drop in plant efficiency. This<br />
discussion is explored in more detail in the<br />
“Capturing CO2” document produced by the<br />
IEA GHG R&D Programme [16]. Figure 4.2<br />
provides an insight into the predicted costs of<br />
operating power plants of varying processes.<br />
Estimated costs per kWh reflect the predicted<br />
price of fuels; however do not consider the<br />
transportation and storage of CO2.<br />
Based on current knowledge and<br />
understanding, the following assumptions<br />
are made <strong>for</strong> each process category.<br />
IGCCs able to produce hydrogen as well<br />
as electrical power benefit greatly from<br />
CCS. The ability to operate the gasifier<br />
continuously would be a major advantage<br />
to an IGCC and there<strong>for</strong>e it is expected that<br />
they would be the first to join a CO2 pipeline<br />
<strong>network</strong>, assuming it was feasible to do so.<br />
Due to economics of scale, it is assumed<br />
that post combustion coal power plants will<br />
enter the <strong>network</strong> around the 2020s. They<br />
are unlikely to enter earlier, unless supported<br />
by incentive schemes.<br />
CCGTs are inherently flexible and cleaner,<br />
thus overcoming the issues with coal. CCS<br />
would appear less cost effective and not as<br />
beneficial; there<strong>for</strong>e it is assumed that half<br />
the CCGTs will enter the <strong>network</strong> at the tailend<br />
of the study period, with the remaining<br />
half operating with a mix of hydrogen or<br />
simply decommissioned.<br />
Non-energy producers account <strong>for</strong> a<br />
reasonable portion of CO2 emitted in this<br />
region, each with varying processes and<br />
methods of capture to consider. Arguments<br />
<strong>for</strong> whether CCS will be adopted at these<br />
facilities would be based on the impact the<br />
EU-ETS will have on their businesses.<br />
• Steel making industry<br />
- It may be that emissions allowances<br />
will enable global competitive<br />
production, assuming that BAT is<br />
adopted, but what the effect of changes<br />
in the National Allocation Plan <strong>for</strong> this<br />
industry is not certain.<br />
• Refineries<br />
- Requirements of the EU-ETS will<br />
probably be upgrades to the ageing<br />
UK refineries, again adopting BAT.<br />
Allocation of allowances will be<br />
problematic as processes and emissions<br />
at refineries vary with changes in feed<br />
stocks (light, sweet North Sea oil being<br />
replaced by imported, sour, heavy crude<br />
oil from the Middle East), changing<br />
products (demands <strong>for</strong> aviation fuels<br />
increasing) and accommodation <strong>for</strong><br />
biofuels processing.<br />
Despite the difficulties surrounding the<br />
allocation of carbon credits in the second<br />
phase of the EU-ETS, further reductions<br />
and increasing CO2 costs could encourage<br />
industries to cut their emissions below<br />
BAT. In this sense, the opportunity to join<br />
a low cost <strong>network</strong> would seem attractive,<br />
assuming a suitable CO2 capture unit can<br />
be found to suit the process.
Figure 4.1 Carbon capture systems<br />
post combustion<br />
pre combustion<br />
Oxyfuel<br />
Industrial processes<br />
Reproduced courtesy of the IPCC from IPCC Special Report<br />
on carbon dioxide Capture and Storage, Fig TS-3<br />
Figure 4.2 Predicted operating costs <strong>for</strong> power station technologies<br />
Cost of electricity, c/kWh<br />
12<br />
10<br />
8<br />
6<br />
4<br />
2<br />
0<br />
Overview of CO2 capture processes and systems<br />
Fuel<br />
O+M<br />
Capital<br />
Coal<br />
Gas<br />
Biomass<br />
Coal<br />
Biomass<br />
Coal<br />
Gas<br />
Biomass<br />
Coal<br />
Gas<br />
Biomass<br />
Gasification<br />
Gas, Oil<br />
Carbon Capture and Storage Network 13<br />
Power & Heat CO2 Separation<br />
PF IGCC IGCC PF IGCC IGCC PF post NGCC NGCC NGCC<br />
no cap (dry feed) no cap post (dry feed) cap comb. no cap oxy<br />
comb. oxy<br />
Air<br />
Air/O2 Steam<br />
Air<br />
Air/O2<br />
Re<strong>for</strong>mer +CO2<br />
Separation<br />
H2<br />
Air<br />
Power & Heat<br />
Air Seperator<br />
Process + CO2<br />
Separation<br />
N2<br />
O2<br />
CO2<br />
Power & Heat<br />
Raw material Gas, Ammonia, Steel<br />
CO2<br />
CO2<br />
N2 O2<br />
N2<br />
CO2<br />
CO2<br />
Compression<br />
& Dehydration
14<br />
5.0 CARBON DIOXIDE ENTRY SPECIFICATION<br />
5.1 INTRODUCTION<br />
The quality of carbon dioxide (CO2) entering<br />
any system may have a significant impact<br />
on the storage and transportation aspects<br />
of any CCS <strong>network</strong>. Any capture process<br />
is a balance providing a cost and energy<br />
efficient solution <strong>for</strong> extracting the CO2. This<br />
process will inevitably mean that some of<br />
the other contaminants are captured as well,<br />
which may have negative impact on CCS<br />
schemes in several ways:<br />
• Health and safety implications<br />
• Capture energy usage and power station<br />
efficiency<br />
• Transportation implications, property<br />
changes and costs.<br />
There<strong>for</strong>e the quality of the CO2 stream<br />
needs to be defined. For proposed<br />
<strong>network</strong>s this definition becomes the entry<br />
specification to the <strong>network</strong> to which<br />
emitters must comply in order to enter<br />
the system.<br />
5.2 pOSSIBLE IMpURITIES<br />
The impurities present in a CO2 stream<br />
depend greatly on the source. For nonanthropogenic<br />
sources carbon monoxide,<br />
hydrogen sulphide and methane are common<br />
impurities. Anthropogenic, man-made,<br />
sources will inevitably vary but will commonly<br />
produce the following contaminants.<br />
• Methane<br />
• Carbon monoxide<br />
• Water<br />
• Hydrogen<br />
• Oxygen<br />
• Nitrogen<br />
• Argon<br />
• Hydrogen sulphide<br />
• Sulphur oxides<br />
• Nitrogen oxides<br />
The impurities can be treated and removed<br />
to a certain extent, and would have to be<br />
<strong>for</strong> a successful CCS scheme. However<br />
trace amounts will remain and a limit<br />
needs to be set to enable the design of<br />
the cleaning operations particularly <strong>for</strong> H2S,<br />
SOx and NOx. The cause of the impurities<br />
is the combustion processes itself and the<br />
fuel stock. Considering a clean coal IGCC<br />
then an incomplete shift gas reaction will<br />
Carbon Capture and Storage Network<br />
introduce methane, carbon monoxide and<br />
water as well as hydrogen into any process<br />
gas stream. Consequently when the CO2<br />
is recovered so will some of the impurities.<br />
Hence the affect of these impurities on<br />
a CO2 stream need to be understood<br />
and controlled.<br />
5.3 pROpERTIES OF<br />
CARBON DIOXIDE<br />
Carbon dioxide is a common gas, and<br />
widely used in the food, pharmaceuticals<br />
and chemicals industry. However its physical<br />
characteristics make transportation complex.<br />
Unlike other commonly transmitted gases<br />
such as methane, hydrogen or ethylene the<br />
critical conditions of CO2 are relatively low, 74<br />
bar and 31°C, as shown in figure 5.1.<br />
This means that the transportation of<br />
CO2 can occur as a solid, gas, liquid, or<br />
as a supercritical fluid over a relatively<br />
narrow range of conditions. Typically CO2<br />
is transported as a gas or liquid, to local<br />
sources or into process or as a liquid <strong>for</strong> bulk<br />
transfer. In the case of a CCS <strong>network</strong> the<br />
denser the fluid the better as this generally<br />
reduces the pipe diameter required. However<br />
above the critical point the supercritical fluid<br />
state allows <strong>for</strong> a mixture of gas and liquid<br />
properties, the fluid has the density of a<br />
liquid with the compressibility and viscosity<br />
of a gas. These physical conditions make<br />
transportation in this state attractive given the<br />
efficiency gains from lower friction and lower<br />
pressure drops.<br />
It should be noted that in<strong>for</strong>mation on the<br />
properties of CO2 with contaminants is<br />
scarce. No specific testing has been carried<br />
out in the public domain, although some<br />
work is ongoing. Modelling of properties<br />
is possible using Equations of State such<br />
as Peng Robinson, although this modelling<br />
must be validated against test results to<br />
validate its accuracy. This is particularly<br />
important when considering a supercritical<br />
fluid mixture.<br />
5.4 CONTAMINATION ISSUES<br />
The purity of potential industrial CO2 sources<br />
is dependent on the combustion process<br />
and the method of capture. For example is<br />
the source a power station, pre-combustion<br />
or IGCC, ammonia or amine capture,<br />
desiccant drying or glycol? Typically the<br />
common contaminants are:<br />
• Methane<br />
• Non-condensable gases, nitrogen,<br />
oxygen, argon, hydrogen<br />
• Hydrogen sulphide<br />
• Sulphur oxides<br />
• Nitrogen oxides<br />
• Carbon monoxide<br />
Other contaminants may include mercury<br />
or complex chemicals such as dioxins<br />
or furans depending on the feed stock<br />
and process.<br />
The presence of methane as a contaminant<br />
may be possible <strong>for</strong> some processes.<br />
However the discussion around methane<br />
as a contaminant applies more to the<br />
geological sources of CO2 where methane is<br />
a much more common contaminant.<br />
There are two effects to consider, the<br />
safety impact and that on the physical<br />
properties. Key physical parameters of a<br />
fluid will be altered given a change in the<br />
mixture; specifically of interest to CCS is<br />
the change in the critical point and the<br />
phase boundaries. The importance of<br />
understanding this relationship is critical, as<br />
a change in the levels of one contaminant<br />
could adversely affect the properties of the<br />
mixture such that a phase change may<br />
occur, or a change from a supercritical to<br />
liquid phase.<br />
5.5 pROpERTIES OF CARBON<br />
DIOXIDE MIXTURES<br />
The properties of CO2 mixtures typical<br />
to CCS schemes are not well examined<br />
by industry or academia. Experience in<br />
the USA so far has been of CO2 from<br />
either anthropogenic (man-made) sources<br />
(25%) or geological sources (75%) that<br />
are relatively clean and these are used <strong>for</strong><br />
enhanced oil recovery (EOR).<br />
In the UK there are no geological sources.<br />
Industrial sources range from those used to<br />
produce food grade CO2 to contaminated<br />
CO2 emitted under environmental consents.<br />
The considerable variation in the quality<br />
of gas has an appreciable effect on the<br />
physical properties. For instance a pipeline<br />
run at 84 bar is 10 bar above the critical<br />
point <strong>for</strong> pure CO2 and providing pressure<br />
drop is low two phase flow will not occur.<br />
Introduce a contaminant and the critical<br />
point changes as does other properties.
Figure 5.1 Carbon dioxide phase diagram<br />
Pressure, bar<br />
73.0<br />
5.11<br />
1<br />
Solid<br />
If the critical pressure were to increase <strong>for</strong><br />
the mixture, or the contaminant change the<br />
phase to vapour, then the system hydraulics<br />
will change.<br />
The following figure shows one example<br />
as an illustration. Figure 5.2 and figure 5.3<br />
shows the deviation from pure CO2 caused<br />
by the presence of nitrogen. In all cases<br />
pure CO2 is one, the deviations are from this<br />
baseline, <strong>for</strong> example a data point of<br />
1.2 <strong>for</strong> density shows that the mixture is<br />
20% denser than pure CO2.<br />
As can be seen from the chart a 4%<br />
concentration of nitrogen imposes an<br />
11% increase in pressure drop. The critical<br />
points <strong>for</strong> this mixture become 26.6°C and<br />
82.3 bar.<br />
Similar effects can be seen considering the<br />
other contaminants. Typically the common<br />
contaminants generally correlate to a +/-<br />
20% deviation in most properties at around<br />
5% mol in a binary mixture.<br />
For critical temperature and pressure the<br />
general pattern is that an increase in the<br />
percentage of a contaminant increases<br />
the critical pressure and decreases the<br />
critical temperature. There are three notable<br />
exceptions; H2S, SO2 and NO2 increase<br />
both critical temperature and pressure.<br />
Carbon Capture and Storage Network 15<br />
Liquid<br />
Temperature, ˚C<br />
Gas<br />
-78.5 -56.4 31.1<br />
Supercritical<br />
Changes in the critical point represent<br />
changes in the phase envelope. As the<br />
critical point shifts with contaminant<br />
concentration it could impact on the<br />
operating point or envelope of the main<br />
system. Introducing a high contaminant<br />
source could push the phase envelope past<br />
the operating point of the <strong>network</strong> and may<br />
cause a change in phase. Figure 5.4 shows<br />
the change in phase envelope <strong>for</strong> a CO2<br />
– nitrogen mixture with increasing levels<br />
of nitrogen.<br />
Consider point A on the graph as the<br />
optimum operating point of a pipeline<br />
normally operating in a 4% nitrogen in CO2<br />
mixture, just below critical temperature<br />
but with a 10%, in this case 8 bar margin<br />
on pressure. An increase of 2% to a 6%<br />
contamination level reduces the margin<br />
above critical pressure, but reduces<br />
the critical temperature, the fluid is<br />
now supercritical.<br />
To avoid these changes in physical<br />
properties within a pipeline the variance<br />
that can occur must be controlled. To this<br />
extent an entry specification provides a<br />
design point around which the pipeline can<br />
be designed as to eliminate phase changes<br />
within the operating <strong>network</strong>.<br />
5.6 TECHNICAL IMpACT<br />
Key to a pipeline’s design is not only the<br />
physical constituents of the fluid but also its<br />
condition. The pressure and temperature<br />
<strong>for</strong> entry must be kept at a near uni<strong>for</strong>m<br />
level to avoid local pressure problems<br />
such as two phase flow or changes in<br />
bulk temperature. There<strong>for</strong>e a specification<br />
must include a minimum pressure and a<br />
maximum temperature. Generally given<br />
the critical point, temperature is limited to<br />
a condition that it must be less than 30°C.<br />
For pressure the critical point should be<br />
avoided, there<strong>for</strong>e a minimum pressure of<br />
100 bar would be acceptable, this gives a<br />
30 bar margin from the critical point to allow<br />
<strong>for</strong> pressure drop within the system.<br />
For a <strong>network</strong> that has to deal with<br />
multiple individual sources the design must<br />
accommodate all reasonable variations<br />
of flow that may occur. To achieve this,<br />
a <strong>network</strong> specification is required to<br />
limit the variability of the fluid properties<br />
to a reasonable level so that equipment<br />
design has a narrow range of key physical<br />
properties as possible. It is generally<br />
accepted that a design factor of 10% is<br />
applied to process equipment based on<br />
the averages of the streams involved. If<br />
the variation in properties is wide then the<br />
overall design range may be excessive,<br />
a 20% variation in physical properties in
16<br />
addition to a 10% design factor places<br />
a very wide envelope when considering<br />
optimum equipment design and selection.<br />
Typically <strong>for</strong> staged implementation the<br />
equipment will be staged as well, <strong>for</strong><br />
example a <strong>network</strong> may start with two<br />
compressor booster stations but expands<br />
to four at <strong>network</strong> completion.<br />
5.7 LEGISLATIVE REQUIREMENTS<br />
The legislative framework <strong>for</strong> pipelines<br />
and associated fixed equipment is well<br />
established and understood. The applicability<br />
of the legislation to carbon dioxide pipelines<br />
however is less well defined.<br />
The transportation of CO2 is covered by<br />
existing legislation in the <strong>for</strong>m of the Pipeline<br />
Safety Regulation 1996, PSR, and COMAH.<br />
Currently CO2 is not a hazardous material<br />
under PSR but the Health and Safety<br />
Executive (HSE), consider that it should be<br />
in this context and new legal guidance <strong>for</strong><br />
CO2 is expected in 2008. In the interim the<br />
HSE stance is that the current regulations<br />
should be applied and CO2 would only be<br />
exempt where it can be proved that the<br />
legislation does not apply. There<strong>for</strong>e under<br />
the PSR CO2 and the other constituents of<br />
the stream will count as a hazardous fluid<br />
and should be considered as such.<br />
Figure 5.2 Property deviations <strong>for</strong> carbon dioxide - nitrogen<br />
1.2<br />
1.15<br />
1.1<br />
1.05<br />
1<br />
0.95<br />
0.9<br />
0.85<br />
0.8<br />
Carbon Capture and Storage Network<br />
5.8 OFFSHORE LEGISLATION<br />
The prime constraints on CCS schemes<br />
operating offshore are OSPAR and the<br />
London Protocol. These treaties regulate the<br />
activities that can occur in the ocean and<br />
apply in and around the UK.<br />
Both are now modified to allow <strong>for</strong> CCS/<br />
EOR activities. OSPAR was recently<br />
amended to include the provision <strong>for</strong><br />
CCS worded such that carbon dioxide<br />
sequestration would be exempt from the<br />
disposal at sea restrictions as long as:<br />
i. Disposal is into a sub-soil geological<br />
<strong>for</strong>mation<br />
Property Deviations – carbon dioxide with nitrogen<br />
% Contaminant by Mole<br />
ii. The streams consist overwhelmingly<br />
of carbon dioxide. They may contain<br />
incidental associated substances derived<br />
from the source material and the capture,<br />
transport and storage processes used<br />
iii. No wastes or other matter are added <strong>for</strong><br />
the purpose of disposing of those wastes<br />
or other matter<br />
iv. They are intended to be retained in these<br />
<strong>for</strong>mations permanently and will not lead<br />
to significant adverse consequences <strong>for</strong><br />
the marine environment, human health<br />
and other legitimate uses of the<br />
maritime area.<br />
0 0.5 1 1.5 2 2.5 3 3.5 4 4.5 5<br />
Mass Density [kg/m3] Molar Density [kgmole/m3] Molar Heat Capacity [kJ/kgm de-C]<br />
Mass Heat Capacity [kJ/kg-C] Molar Enthalpy [kJ/kgm de] Mass Enthalpy [kJ/kg]<br />
Mass Entropy [kJ/kg-C] Z Factor Molar Entropy [kJ/kgm ole-C]<br />
Thermal Conductivity [W/m-K] Viscosity [cP] Surface Tension [dyne/cm]<br />
Kinematic Ciscosity [cSt] Pressure Drop [kPa]<br />
OSPAR defines a CO2 stream as;<br />
“those streams that consist overwhelmingly<br />
of carbon dioxide from carbon dioxide<br />
capture processes <strong>for</strong> storage in geological<br />
<strong>for</strong>mations in the sub-soil of the OSPAR<br />
maritime area. Provided that no wastes or<br />
other matter are added <strong>for</strong> the purpose of<br />
disposing of those wastes or other matter,<br />
the carbon dioxide streams may contain<br />
incidental associated substances derived<br />
from the source material and the capture,<br />
transport and storage processes used.”<br />
The definition of “overwhelmingly of<br />
carbon dioxide” is vague, however a<br />
general acceptance of 95% or more CO2<br />
is considered appropriate. However the<br />
statement precludes the addition of other<br />
waste streams and additives, such as<br />
odourising agents that may have been<br />
considered <strong>for</strong> onshore pipelines.<br />
5.9 TYpICAL STREAM<br />
COMpOSITIONS pOST CApTURE<br />
Without significant facilities operating <strong>for</strong><br />
anthropogenic carbon capture the amount<br />
of in<strong>for</strong>mation available to define an entry<br />
specification is low. However a number<br />
of sources have been summarised by<br />
reference 6 and other projects.<br />
Table 5.1 to table 5.3 indicate quoted<br />
compositions of CO2 streams from<br />
proposed CCS power stations from the<br />
IPCC, Special Report on Carbon Capture<br />
and Storage, section 3 [6].
Figure 5.3 Variation in critical parameters <strong>for</strong> carbon dioxide - nitrogen<br />
60<br />
50<br />
40<br />
30<br />
20<br />
10<br />
0<br />
0<br />
0.00 0.46 0.92 1.37 1.82 2.26 2.70 3.14 3.57 4.00 4.43 4.85 5.27 5.68 6.09 6.50 6.90 7.30 7.70 8.09 8.48<br />
% Contaminant by Mole<br />
Critical Properties-1 – True Tc [C] Critical Properties-1 – True Pc [kPa]<br />
Figure 5.4 Phase envelope changes with increasing impurity<br />
100<br />
90<br />
80<br />
70<br />
60<br />
50<br />
40<br />
30<br />
20<br />
10<br />
Critical properties of carbon dioxide and nitrogen dioxide mixtures<br />
PT Phase Envelope carbon dioxide – Nitrogen<br />
0<br />
-140 -120 -100 -80 -60 -40 -20 -0 20 40<br />
Temperature ˚C<br />
Carbon Capture and Storage Network 17<br />
A<br />
10000<br />
5000<br />
8000<br />
7000<br />
6000<br />
5000<br />
4000<br />
3000<br />
2000<br />
1000<br />
CO2<br />
0.1 N2<br />
0.005 N2<br />
0.03 N2<br />
0.04 N2<br />
0.05 N2<br />
0.025 N2<br />
0.06 N2
18<br />
Table 5.1 Coal fired plant post comb capture<br />
Component Limit<br />
N2/Ar/O2 0.01%<br />
Hydrocarbons 0<br />
H2<br />
0<br />
H2S 0<br />
CO 0<br />
SOx
5.11 SAFETY IMpACTS<br />
Any specification <strong>for</strong> a CO2 pipeline must<br />
consider the safety issues associated<br />
not only with CO2 but with each of the<br />
contaminants. Whilst the consideration of<br />
the safety impact was not strictly within the<br />
scope of this report it has been considered<br />
in depth.<br />
The danger from a CO2 transmission system<br />
is essentially the occurrence of leaks both<br />
short term and long term. Whilst the CO2 is<br />
hazardous the impurities it may contain, such<br />
as hydrogen sulphide are significantly higher.<br />
There<strong>for</strong>e in considering dispersion and the<br />
effects of a release the contaminants must<br />
also be considered ensuring as a minimum<br />
they stay within their short term exposure<br />
limit (STEL) and the SLOT/SLOD data from<br />
the HSE.<br />
5.12 pROJECT SpECIFICATION<br />
Given the discussion in the previous<br />
section the specification from the Dynamis<br />
project provides a reasonable basis. The<br />
contaminant levels specified are such that<br />
they minimise the risk of hydrate and free<br />
water <strong>for</strong>mation, ensure the stability of the<br />
fluid at a typical pressure range. In addition<br />
the hazardous contaminants H2S, CO, SO2<br />
and NO2 have limits such that they are<br />
significantly lower than their accepted<br />
STEL values.<br />
Carbon Capture and Storage Network 19<br />
Table 5.5 Dynamis SP3 recommended entry specification<br />
Component Limit<br />
CO2 >95%<br />
N2<br />
Ar<br />
H2<br />
O2<br />
20<br />
6.1 NETWORK AND SCENARIO<br />
DEFINITIONS<br />
There are two distinct aspects to consider<br />
in the <strong>for</strong>mulation of a concept scenario<br />
<strong>for</strong> connecting the region’s emitters; the<br />
scenario and the shape of the <strong>network</strong>.<br />
The scenario defines the requirements of<br />
a <strong>network</strong>; who, what, when and to some<br />
extent where, when considered alongside<br />
the availability of potential storage sites.<br />
The <strong>network</strong> is the physical shape of the<br />
system to accommodate the scenarios,<br />
constrained by the process and mechanical<br />
design, local environment and implementation<br />
of regulations and good practice.<br />
6.2 NETWORK<br />
6.2.1 primary factors <strong>for</strong> pipeline<br />
route selection<br />
The design of any <strong>network</strong> should consider<br />
a number of factors and the acceptance<br />
that the shortest route may not be the most<br />
suitable. The primary factors that should be<br />
considered include:<br />
• Public and personnel safety<br />
• Pipeline fluid and operating conditions<br />
• Environmental impact including<br />
designated areas<br />
• Geological conditions, including<br />
topography, geotechnical and<br />
hydrographical conditions<br />
• Land use, existing and future, including:<br />
• Third-party activities<br />
• Agricultural practice<br />
• Existing facilities and services<br />
• Access<br />
• Transport facilities and utility services<br />
• Construction, testing, operation and<br />
maintenance<br />
• Security<br />
• Any other hazards.<br />
In order to develop the pipeline route<br />
efficiently, three phases of routing are<br />
usually adopted:<br />
1) Route corridor selection<br />
2) Route investigation and consultation<br />
3) Design and approval of final route.<br />
Carbon Capture and Storage Network<br />
6.0 ONSHORE AND NETWORK DESIGN<br />
This report is a high level feasibility study<br />
<strong>for</strong> the region. There<strong>for</strong>e the only one of the<br />
three phases appropriate is the selection of<br />
potential routes.<br />
6.2.2 Design assumptions<br />
The key design assumptions relate to the<br />
design of the pipeline, the <strong>network</strong> shape<br />
and constructability.<br />
The pipeline design is limited to 125 bar<br />
operating pressure, this places the fluid into<br />
the dense phase but not supercritical as the<br />
entry temperature will be limited to below<br />
the critical temperature.<br />
Onshore booster stations <strong>for</strong> pressure<br />
control will not be provided, the <strong>network</strong><br />
shape selected to route the pipeline<br />
acts as a central ‘rail’ with spurs to each<br />
emitter. Provision of an onshore booster<br />
station would necessitate a significant<br />
establishment along the pipe route or<br />
adjacent to an existing industrial site.<br />
To determine the optimum location of such<br />
a station a more detailed <strong>network</strong> analysis<br />
would be required than is available here.<br />
The provision of intermediate distance safety<br />
or block valves has been assumed to fall at<br />
15km <strong>for</strong> high pressure systems.<br />
Onshore pipeline sizes are limited to a<br />
maximum of 1000 mm diameter. The<br />
pipelines are buried and require significant<br />
top cover, typically 1.2m up to 1.8m <strong>for</strong><br />
special crossings such as railways. This<br />
would entail a trench depth in excess of 3m.<br />
To generate reasonable cost metrics the<br />
trench excavation depth was limited to 3m,<br />
thus limiting the pipe size.<br />
Flow rates to the <strong>network</strong> are taken as a<br />
viable percentage of total carbon dioxide<br />
based on DEFRA’s NATS tables. Where<br />
appropriate and permitted actual or planned<br />
capture figures have been used. Typically<br />
the capture efficiency is taken as 90%. For<br />
refinery complexes such as the Total and<br />
ConocoPhillips facilities on Humberside a<br />
much lower figure of 50% is utilised. The<br />
distributed nature of point sources of release<br />
on these mature facilities would require<br />
major design and infrastructure changes at<br />
each site. Other issues such as the nature<br />
of the emission would challenge the way<br />
carbon dioxide is captured, <strong>for</strong> example<br />
emissions from a flare would be impossible<br />
to capture. 50% is used as a generalisation<br />
of what might be expected to be within<br />
reach of capture technology.<br />
6.2.3 Operating philosophy<br />
The <strong>network</strong> is sized to accommodate<br />
the flows from the emitters with a margin<br />
allowance <strong>for</strong> peak excursions. The<br />
operational capacity of the emitters to<br />
capture CO2 in the area range from 50%<br />
– 98%. With such scales to consider, peak<br />
demands would necessitate multiple or a<br />
significantly larger, thicker pipeline, which,<br />
in turn, have a negative effect on the<br />
economics. Capture plant and stores will<br />
have various license terms which will have<br />
to be realistic <strong>for</strong> the processes used. The<br />
operating regime <strong>for</strong> the transport system<br />
will be primarily governed by commercial<br />
agreements on line use and recognise<br />
the risk of CO2 losses as a very low but<br />
a possible operational risk. There is no<br />
offline storage in the system except if it was<br />
connected to a shipping facility <strong>for</strong> the CO2.<br />
The lines are sized above the average flow<br />
to account <strong>for</strong> plant down time and peak<br />
flows from all sites, but there is an economic<br />
limit of the ETS CO2 value at which it is<br />
cheaper to not capture or export CO2.<br />
Given the points of failure in capture, transport<br />
and storage facilities the transport pipelines<br />
and pumps are not duplicated <strong>for</strong> 100%<br />
standby capacity. Maintenance regimes,<br />
equipment specifications and reliability and<br />
availability levels would all be considered and<br />
designed to accepted best practice. As the<br />
repair down time would be reasonably short,<br />
the value of the CO2 vented back at source<br />
due to the lack of or reduced amount of<br />
transmission capacity is low compared with<br />
additional capital spend on what is not a life<br />
critical or high marginal value product.<br />
It should be noted that government<br />
legislation in future might require that<br />
all facilities with CCS must endeavor<br />
to capture all available CO2, similar to<br />
those large power stations with flue gas<br />
desulphurisation units.<br />
6.2.4 Design life<br />
The design life of the onshore and offshore<br />
pipelines is 40 years, and compressors,<br />
valves, meters, etc is as typical as used <strong>for</strong><br />
that equipment. These design lives depend<br />
critically upon the dryness of the CO2<br />
entering the system and this and other risks<br />
are important issues to be addressed further<br />
by OEMs and system designers. Operational<br />
costs are assumed to cover necessary<br />
maintenance of that equipment and all<br />
equipment considered in this study will be<br />
new and designed with this lifespan in mind.
6.2.5 Metering<br />
As the impetus <strong>for</strong> building a distributed<br />
collection system is likely to be financial<br />
(based on selling carbon credits), metering<br />
of CO2 sent <strong>for</strong> disposal would be necessary<br />
at all sources prior to injection into the<br />
<strong>network</strong>. Metering would also be required<br />
at the point of storage/sequestration<br />
<strong>for</strong> regulatory purposes, i.e. to ensure<br />
that all CO2 injected into the <strong>network</strong> is<br />
sequestered.<br />
6.2.6 Corrosion protection<br />
Steel pipelines are routinely protected<br />
against external corrosion by the use of<br />
cathodic protection systems, and a design<br />
allowance in the wall thickness. These are<br />
included in the costs <strong>for</strong> steel pipelines<br />
presented here. Internal corrosion would<br />
only be a problem if water was present<br />
in the CO2 stream.<br />
6.2.7 Network phasing<br />
The key factor on the <strong>network</strong> design is that<br />
the <strong>network</strong> <strong>for</strong>ms in a number of phases<br />
to accommodate emitters that come online<br />
in similar time periods. This way no single<br />
emitter would be faced with the initial full<br />
cost of a pipeline without commitment from<br />
other parties. For example consider plants<br />
A, B & C, bringing CCS on line in 2015,<br />
2017 and 2030 respectively. Here simple<br />
sources A & B would be grouped with<br />
the pipeline coming on line in 2017 at the<br />
latest. The 2030 emitter would require a<br />
pipe solution in another deployment stage.<br />
This does mean however that there will exist<br />
multiple pipes running in proximity to each<br />
other at the end of the project particularly<br />
the shore line stations would have several<br />
incoming lines in the same pipe corridor.<br />
Figure 6.1 shows an example of part of<br />
a phased <strong>network</strong>. The red line indicates<br />
the projected path of a pipeline installed<br />
in 2017, the blue a pipeline installed in<br />
2030 to accommodate the second phase<br />
of development.<br />
6.2.8 Network design tool<br />
The <strong>network</strong> design and cost in<strong>for</strong>mation is<br />
provided using a pre-existing spreadsheet<br />
based tool created <strong>for</strong> the International<br />
Energy Agency Greenhouse Gas R&D<br />
Programme. Specifically designed <strong>for</strong><br />
the <strong>network</strong>ing of carbon dioxide the<br />
spreadsheet was created by AMEC and<br />
Gastec at CRE Ltd in 2006. The tool allows<br />
Carbon Capture and Storage Network 21<br />
<strong>network</strong>s to be created and cost estimated<br />
using several matrices <strong>for</strong> standard<br />
equipment and pipeline costs.<br />
The costing in<strong>for</strong>mation used in this model<br />
was generated by AMEC in 2006. It consists<br />
of in<strong>for</strong>mation from project and proposal<br />
databases on current and historical projects.<br />
Each cost was subject to scrutiny and<br />
the cost used was based on engineering<br />
assessment as to whether the price was<br />
valid. Where historical data was not available<br />
standard estimating metrics used in house<br />
by AMEC have been used.<br />
6.3 AREA ANALYSIS<br />
6.3.1 General description<br />
The Yorkshire and Humber region is ideally<br />
suited to carbon capture and storage<br />
schemes given the intensity of emitters and<br />
the availability of potential offshore storage<br />
solutions. In addition there already exist gas<br />
terminals at Theddlethorpe and Easington.<br />
Boundaries <strong>for</strong> the study area are defined<br />
loosely as the Humber sub-region, but more<br />
exactly by the regional border of Yorkshire to<br />
the south and the town of Castle<strong>for</strong>d to the<br />
west. The northern boundary <strong>for</strong> the study<br />
area is loosely defined as not further north<br />
than Beverley. Although there is a cluster<br />
of emitters in and around York they are not<br />
included in the study, due the distance to<br />
the nearest suitable tie-in point. Appendix A<br />
contains a project area map.<br />
To the west the area is also bound by the<br />
metropolitan areas of Leeds, Wakefield,<br />
Barnsley, Sheffield and Rotherham. Running<br />
significant piping solutions to emitters<br />
in this area was viewed as a challenge,<br />
particularly where some emitters would have<br />
required crossing the M1 motorway. For the<br />
purposes of the study, given that the area<br />
already defined captured all of the Tier 0<br />
emitters the area west of Castle<strong>for</strong>d and<br />
the A1 was not included.<br />
6.3.2 Area restrictions<br />
In examining an area <strong>for</strong> pipeline routing the<br />
area is scrutinised <strong>for</strong> major obstructions.<br />
Here given that the fluid is carbon dioxide,<br />
a precautionary routing of the pipeline is<br />
taken, trying where possible to maximise<br />
the distance away from residences and<br />
urban centres whilst optimising the pipeline<br />
length. As well as the conservative line run<br />
approach there a number of pinch points<br />
along the route.<br />
Firstly the area to the north of Hull, figure<br />
6.2, and south of Beverley is congested,<br />
a large number of distributed dwellings<br />
exist in the area. This means that the<br />
pipeline must snake through an area<br />
or encroach into urban areas. Whilst<br />
encroaching on residences is allowed to<br />
a specified separation distance, under the<br />
UK regulations and codes, it should where<br />
possible be avoided. The area does not<br />
preclude its use of a pipe run, but it would<br />
be a difficult area to traverse.<br />
Secondly to the west of Scunthorpe lies the<br />
River Trent the east bank of which <strong>for</strong>ms<br />
a steep gradient to the north of the town<br />
until the Humber, figure 6.3. Such inclines<br />
with rapid increases or decreases in height<br />
should be avoided if possible. Here the<br />
proximity to the river edge and the town<br />
itself does not lend itself easily to a pipe<br />
bridge solution.<br />
Two routes do exist, the first to the south of<br />
Scunthorpe represents a major detour from<br />
the direct path, and as can be seen from the<br />
basic map in Appendix A a band of <strong>for</strong>ests<br />
litter the area to the east, some of which<br />
and the surrounding area are SSSI’s. The<br />
second route would be to cross in the area<br />
to the north of Scunthorpe where the incline<br />
is not so pronounced.<br />
Figure 6.1 Example of phased<br />
<strong>network</strong> pipelines<br />
Source C, 2030<br />
Source A, 2015<br />
Source B, 2017<br />
Shoreline Terminal<br />
& Single Offshore<br />
Pipeline
22 Carbon Capture and Storage Network<br />
6.4 NETWORK FORMATION<br />
6.4.1 Ring main<br />
The simplest and most effective method<br />
of connecting distributed emitters is a ring<br />
main, much like those used to distribute<br />
a fluid rather than receive. The ring main<br />
could receive all fluids and route to one of<br />
two export points allowing sections to be<br />
dropped <strong>for</strong> inspection or the ring main to<br />
be built up gradually. Figure 6.4 shows a<br />
basic example of a ring main system <strong>for</strong><br />
the region. However the size of the <strong>network</strong><br />
would require a split main pipe, two parallel<br />
pipes working in operation of a significant<br />
size. This has obvious benefits <strong>for</strong> staging<br />
the development and capital outlay but has<br />
significant impact on the construction and<br />
operational elements. If several pipes are<br />
being used to per<strong>for</strong>m a function of a ring<br />
main then that suggests a more distributed<br />
approach, allowing a <strong>network</strong> to develop<br />
over time. For a ring main the first few users<br />
would bear the cost of a pipeline they may<br />
not have the capacity to use efficiently.<br />
6.4.2 Tree/distributed structure<br />
A tree structure, figure 6.5, is more suited<br />
to the efficient operation and construction<br />
of a <strong>network</strong> such as the one proposed <strong>for</strong><br />
Humberside. It allows phased development<br />
into stages that meet the requirement of<br />
emitters as they come on line not <strong>for</strong>cing<br />
future need costs on to early emitters. This<br />
system also lends itself more efficiently to<br />
the collection from the lower Tier sources.<br />
For the majority of Tier 1 and 2 sources<br />
it may not be appropriate to compress<br />
gases at site. Instead the lower tier sites are<br />
envisaged to be part of a suction system<br />
tied to a larger emitter station. At the larger<br />
emitters the lower tier gas is collected by<br />
compressors sucking the carbon dioxide<br />
away from the emitter. For the purposes of<br />
this study a tree structure has been adopted<br />
<strong>for</strong> the <strong>network</strong>s.<br />
Figure 6.2 Pipeline route congestion point – Hull - Beverley Gap<br />
Figure 6.3 Pipeline route congestion point – Trent Crossing
6.5 SELECTION OF EXpORT<br />
TERMINAL LOCATION<br />
To a certain extent the shape of the <strong>network</strong><br />
is also defined by the practical access to the<br />
offshore stores, with the onshore options<br />
being to the north or south of the Humber<br />
estuary in the shape of Easington/Dimlington<br />
and Theddelthorpe as both host existing<br />
gas import terminals, and there<strong>for</strong>e known<br />
facilities and track records <strong>for</strong> assessing<br />
beach and near shore pipe installations.<br />
The preferred <strong>network</strong> route is to the south,<br />
via Theddlethorpe <strong>for</strong> a number of reasons;<br />
• Area analysis indicates that the northern<br />
route around Kingston upon Hull<br />
is congested, particularly so when<br />
considering phased pipelines. Whilst<br />
it may possible to lay a single or two<br />
pipelines the required easement and<br />
way leaves would infringe on residences.<br />
• The bulk of the reservoir destinations are<br />
to the south east, nearer Theddlethorpe.<br />
• The majority of major emitters, by<br />
number of sources lay to the south of<br />
the Humber, crossing the river to gain<br />
entry to Easington would be a major<br />
expense and multiple crossings due to<br />
phased developments should preferably<br />
be avoided.<br />
A non-phased solution <strong>for</strong> the area including<br />
Tiers 1 and 2 would make Easington<br />
more attractive, however running the<br />
major pipeline required to facilitate Drax,<br />
Eggborough and Ferrybridge would be<br />
significantly difficult and disruptive.<br />
There<strong>for</strong>e the preferred destination is an<br />
export point on the shore in the general area<br />
of Theddlethorpe.<br />
Carbon Capture and Storage Network 23<br />
Figure 6.4 Schematic example of a ring main <strong>network</strong><br />
Figure 6.5 Schematic example of a tree structure <strong>network</strong>
24<br />
7.1 STORAGE OpTIONS<br />
Storage sites <strong>for</strong> CO2 from the Yorkshire and<br />
Humber area of any useful size are located<br />
to the east in the southern North Sea. These<br />
comprise many large producing natural gas<br />
reservoirs, which are the main focus of this<br />
study, but also saline aquifers (shown in<br />
figure 7.1). The interesting saline <strong>for</strong>mations<br />
in the area are a depth of between 1km<br />
and 1.5km and have been extensively<br />
drilled in the southern North Sea as many<br />
overlie natural gas fields. However they<br />
have not been characterised and whilst their<br />
theoretical storage potential is significant,<br />
their actual capacity and storage security<br />
are far from proven. In order to develop<br />
and produce from them, natural gas fields<br />
have been extensively characterised and it<br />
is by their nature to be more certain about<br />
their storage potential since they have<br />
contained natural gas <strong>for</strong> tens of millions of<br />
years. However, there is timing uncertainty<br />
about cessation of production and<br />
decommissioning of gas fields. But <strong>for</strong> this<br />
study all fields of useful size have assumed<br />
to be available <strong>for</strong> CO2 storage in the period<br />
between 2008 and 2050.<br />
7.2 DATA SOURCES<br />
Data <strong>for</strong> storage sites was derived<br />
primarily from the Tyndall working paper<br />
No 85 [3] with input from other public<br />
sources including WoodMac and DBERR<br />
publications including the North Sea Task<br />
Force report and study [4, 5 and 6]. There<br />
was sufficient consistency in their details <strong>for</strong><br />
the purpose of this study. The in<strong>for</strong>mation is<br />
summarised on table 7.1 and table 7.2.<br />
Carbon Capture and Storage Network<br />
7.0 OFFSHORE ROUTES AND STORAGE<br />
7.3 ALTERNATE STORAGE<br />
AND COMpETING USES FOR<br />
DEpLETED GAS FIELDS<br />
The northern North Sea includes the Utsira<br />
saline aquifer which has been proven by<br />
the Sleipner CO2 storage project. This<br />
Norwegian project has been injecting 1mt/y<br />
CO2 into the Utsira aquifer since 1996.<br />
This has been monitored and is proving<br />
very successful. Also associated with<br />
the northern North Sea is the possibility<br />
of enhanced oil recovery (EOR). Proven<br />
onshore, but not offshore or in the North<br />
Sea, this uses CO2 injected into oil<br />
<strong>for</strong>mations to help recover more of the oil<br />
through CO2’s solvent properties mobilising<br />
the oil in rock pores. When CO2 is recovered<br />
with the oil it is separated and re-injected<br />
so that it is contained, and following<br />
decommissioning of the oil field it is stored in<br />
the same manner as in a depleted gas field.<br />
Both of these possibilities require either<br />
shipping the CO2 or quite long pipelines.<br />
As solutions <strong>for</strong> the period of this study the<br />
costs are unattractive compared to local<br />
storage. However <strong>for</strong> EOR the additional<br />
oil is the main revenue driver. Testing the<br />
opportunities <strong>for</strong> EOR is recommended<br />
to compliment this study.<br />
It should be noted that some depleted<br />
gas fields may be converted to natural gas<br />
storage facilities. Such facilities already exist<br />
in the North Sea, <strong>for</strong> examples at the Rough<br />
Field, with proposals <strong>for</strong> the Esmond and<br />
Gordon fields but such fields are smaller<br />
than the fields in this study.<br />
7.4 CO-ORDINATION OF<br />
DECOMMISSIONING AND RE-USE<br />
OF EXISTING ASSETS<br />
There has been a presumption that<br />
it is desirable to co-ordinate the<br />
decommissioning of a gas field with the<br />
planning of CO2 storage. With respect<br />
to well abandonment and the re-use of<br />
existing infrastructure this is undoubtedly<br />
true. We have however had to assume the<br />
use of new pipelines due to the volumes,<br />
timescales and pressures of CO2 to be<br />
transported. The consensus is clearly that<br />
we must also assume the transport system<br />
terminates at new injection wells and<br />
plat<strong>for</strong>ms without offshore recompression.<br />
This is because of the high operating costs<br />
of the alternatives and the diversity of field<br />
combinations to be considered. It may be<br />
that in some instances the reuse of existing<br />
infrastructure is feasible, but it would be<br />
misleading to base this report on the<br />
assumption that asset re-use is economic.<br />
To justify investment in a long life asset, such<br />
as a high pressure and capacity pipeline<br />
and injection wells, and with <strong>network</strong> flow<br />
rates ranging from 2 to 40 million tonne per<br />
year (2-40mt/y) we reviewed the available<br />
fields and settled on a cut-off of a minimum<br />
40mt storage capacity <strong>for</strong> a depleted gas<br />
field. This may seem low but we wanted to<br />
ensure useful reservoirs along a pipe route<br />
were not overlooked.<br />
Barring inappropriate well abandonment it<br />
is reasonable to consider that substantial<br />
gas fields that are decommissioned be<strong>for</strong>e<br />
CO2 storage is required can be re-accessed.<br />
Storage site characterisation as distinct<br />
from the present gas characterisation<br />
would be required in accordance with the<br />
emerging regulatory regime. At this time only<br />
the Shell Indefatigable field is categorised<br />
as unavailable because it is abandoned,<br />
but it is included as a store available<br />
when the remainder of Indefatigable is<br />
decommissioned and is assumed to be<br />
used by the <strong>network</strong>.
7.5 INJECTION pRESSURE<br />
A pipeline pressure requirement of up to<br />
170 bar is recommended to be used <strong>for</strong><br />
the purposes of this study given the lack of<br />
detailed knowledge of the individual reservoir<br />
and well differences, and the need to serve<br />
multiple fields over the life of the offshore<br />
trunk pipelines. Though some fields do not<br />
require this high injection pressure the initial<br />
pipeline will be extended to higher pressure<br />
stores. The additional wall thickness does<br />
mean an increase in initial installation cost<br />
<strong>for</strong> the pipeline but the opportunity to<br />
operate at lower design loads must be <strong>for</strong><br />
well over 10 years to prompt installing a<br />
second pipeline due to the high fixed costs<br />
of offshore pipe construction.<br />
7.6 SALINE AQUIFERS<br />
There are no saline <strong>for</strong>mations that have<br />
been characterised sufficiently to have<br />
good estimates of their storage potential<br />
and leakage risk. They are also not closer<br />
than depleted gas fields. However, by coincidence<br />
three with storage capacities of<br />
over 1000mt over lay producing gas fields.<br />
Un<strong>for</strong>tunately there are no robust geological<br />
studies to suggest that these <strong>for</strong>mations are<br />
sealed unlike gas fields which have obviously<br />
trapped rising gases <strong>for</strong> a very long time.<br />
For those aquifers that lie at a shallower<br />
depth than an explored gas field there is<br />
data because of seismic and borehole<br />
results, though it requires analysis to focus<br />
on the aquifer rather than the much deeper<br />
gas field. However much analysis is done,<br />
the final proof is in drilling and injection and<br />
monitoring of a measurable amount of CO2,<br />
as that will provide confidence to rely on that<br />
geological store <strong>for</strong> CO2 <strong>for</strong> large volumes.<br />
Further to the Sleipner experience a number<br />
of other CO2 injection and monitoring<br />
aquifer injection trials are underway, all with<br />
extensive monitoring and modelling. Routing<br />
ideally needs to enable access to, and<br />
assessment of, these three aquifers because<br />
of their large storage potential.<br />
Carbon Capture and Storage Network 25<br />
7.7 GAS FIELD SELECTION<br />
7.7.1 Availability timeline<br />
For pre-2020 availability Leman has the<br />
best date and size features, followed by<br />
Perenco’s Indefatigable & SW, Viking, Victor,<br />
Vulcan, Hewett, Ravenspurn North, Audrey,<br />
Amethyst E & W, and Pickerill. Considerable<br />
caution is required about the availability of<br />
Leman as the operator of half the field is not<br />
likely to decommission be<strong>for</strong>e 2025. There<br />
is potential in a minority of scenario options<br />
<strong>for</strong> an overlap between gas recovery and<br />
CO2 injection which because of connectivity<br />
within the field may be a problem. This can<br />
be resolved be<strong>for</strong>e a pipe route committing<br />
to use Leman is sanctioned.<br />
7.7.2 Distance selection<br />
For a minimum distance <strong>for</strong> first stage<br />
capacity, or desirable if near a pipeline<br />
route to larger stores, the best fields are<br />
Amethyst E & W then Pickerill, followed by<br />
Ravenspurn North and, if via Theddlethorpe,<br />
then Hewett.<br />
7.7.3 Injectivity<br />
Ranking by injectivity, a measure of how<br />
easy it is to inject CO2 into a <strong>for</strong>mation<br />
and size the preferred fields are Viking<br />
and Indefatigable, and Leman and Hewett,<br />
with consideration to Victor, Sean N & S,<br />
Vulcan, Audrey, Barque & Barque S, and<br />
Ravenspurn North. Injectivity is primarily<br />
driven by rock permeability, but other<br />
geological and well design factors<br />
influence the flow rate that will be<br />
achieved in practice.<br />
Fields are often a complex of gas retaining<br />
structures which have varying degrees of<br />
interconnection. The amount of connectivity<br />
impacts the number and design of wells <strong>for</strong><br />
gas recovery, and the same will be true <strong>for</strong><br />
CO2. There<strong>for</strong>e the connectivity of a field’s<br />
storage volume is an important part of the<br />
overall economic flow rate <strong>for</strong> a storage site.<br />
Existing gas field data will help, but saline<br />
fields need more characterisation. More<br />
work on target fields is required to establish<br />
costs and injectivity flow rates be<strong>for</strong>e<br />
finalising a commitment to use a particular<br />
field <strong>for</strong> CO2 storage.<br />
7.7.4 Decommissioning of gas fields<br />
in the study period<br />
This study does not assume reuse of<br />
existing offshore facilities, however there<br />
should be cost reduction opportunities<br />
including the re-use of some wells, better<br />
geological and operational knowledge<br />
transfer into the new activities and deferred<br />
expenditures if CO2 storage neatly followed<br />
gas depletion. There are risks that other<br />
fields besides Shell Indefatigable (currently<br />
decommissioning) will have to commit<br />
to decommissioning be<strong>for</strong>e a CO2 store<br />
commitment can be made.<br />
These include:<br />
• Pickerill by about 2013<br />
• Amethyst E & W, Indefatigable & SW<br />
and Hewett by about 2015<br />
• Audrey by about 2017<br />
• Ravenspurn North by about 2018<br />
• Vulcan by 2020.<br />
Given the lack of a business case <strong>for</strong> storage<br />
it is difficult to see why existing operators will<br />
manage field decommissioning, including well<br />
abandonment details of penetrated aquifers,<br />
in a way that is ideal <strong>for</strong> future CO2 storage.<br />
Providing a viable business case, plus<br />
interpretation of current decommissioning<br />
plans in the light of potential CO2 storage,<br />
is there<strong>for</strong>e important in reducing costs.
26<br />
Carbon Capture and Storage Network<br />
Figure 7.1 Overview of UK oil and gas fields including the Utsira Aquifer
Table 7.1 Potential storage sites – gas field<br />
Gas Storage Field Availability Range Storage Capacity Distance from Distance from Injectivity<br />
(mt) Easington (km) Theddlethorpe (km)<br />
Leman 2013 2025+ 870 160 140 Good<br />
(Permenco + Shell)<br />
Indefatigable & SW 2012 2015 222 180 160 Reasonable<br />
Viking 2013 2018 214 180 170 Good<br />
West Sole 2020 2030 136 70 80 Tight<br />
Galleon 2022 2032 128 145 130 Tight<br />
Hewett 2010 2015 216 130 100 Good<br />
Indefatigable (Shell) 2005 2007 111 260 230 Reasonable<br />
Barque & Barque S 2020 2030 89 100 100 Good<br />
Victor 2015 2020 73 220 180 Good<br />
Ravenspurn North 2013 2018 59 70 90 Tight<br />
Vulcan 2015 2020 53 160 140 Reasonable<br />
Audrey 2012 2017 49 140 140 Reasonable<br />
Clipper N 2030 2035 46 135 125 Tight<br />
Amethyst E & W 2010 2015 46 45 55 Tight<br />
Sean N & S 2035 2040 44 220 200 Reasonable<br />
Schooner 2019 2024 41 155 170 Tight<br />
Pickerill 2008 2013 40 70 65 Tight<br />
Table 7.2 Potential storage sites - saline aquifer<br />
Carbon Capture and Storage Network 27<br />
Saline Aquifer Storage Capacity Depth Underlying Remarks<br />
(Tyndall ref) (mt) (m) Gas field(s) from Tyndall<br />
2/48 3169 1100 approximately Large normal fault cuts through<br />
congruent to the structure.<br />
West Sole<br />
3/48 2302 1200 linear under Barque Galleon nearby. Many faults in the seal on<br />
and Clipper N. the above lying Bunter sandstone.<br />
4/49 1114 1400 Viking block 48/17 Movement of salt has caused faulting on<br />
the flanks of the structure. Faults extend<br />
upwards to the seabed.
28 Carbon Capture and Storage Network<br />
For consistency all data is from the Tyndall<br />
report [3] except the capacity <strong>for</strong> Hewett<br />
is doubled given the in<strong>for</strong>mation in the<br />
EEGR report [2]. Injectivity assumptions<br />
in calculations of fill rates use the EEGR<br />
report figures. Other minor differences are<br />
by this study.<br />
In analysing the ability of a single field to<br />
meet demand out to 2030 only four targets<br />
stand out; Leman, Hewett, Indefatigable and<br />
Viking. This is a somewhat simple view given<br />
the ownership issues and multiple plat<strong>for</strong>m<br />
developments actually in place, but is useful<br />
from a trunk pipeline point of view.<br />
The total volumes available appear to be<br />
large, but leaving aside 308mt capacity of<br />
isolated and some low injectivity fields, and<br />
ignoring saline aquifers, the volume available<br />
is 2066 million tonnes. This is sufficient to<br />
meet high end projections out to 2050.<br />
With added sources after 2030 “Low” to<br />
2050 is 1072mt, “High” to 2050 is 1681mt.<br />
The residual storage after 2050 if storage<br />
was at a rate of 50mt/year is about 8 to 20<br />
years. This is not an immediate problem<br />
but consideration needs to be given to the<br />
likelihood that un<strong>for</strong>eseen circumstances<br />
make a large field unavailable, that the<br />
saline aquifers cannot contribute to local<br />
storage capacity, and that other regions<br />
are looking to store CO2 in this area. These<br />
plus options <strong>for</strong> storage after 2050 suggest<br />
that improving surety of local storage and<br />
routes to storage further away are areas<br />
<strong>for</strong> further study.<br />
7.8 pIpELINE ROUTES<br />
We discussed and agreed an assumption<br />
that route landfalls would be at either<br />
Dimlington-Easington or Theddlethorpe<br />
because of the existing facilities <strong>for</strong><br />
compression/pumping plant and a history<br />
of environmental approvals and construction<br />
experience <strong>for</strong> pipelines across the beach<br />
and near shore seabed profiles.<br />
The other major assumption was that<br />
storage site facilities would not be assumed<br />
to have CO2 compression/pumping<br />
equipment due to the cost of maintenance.<br />
The pipeline there<strong>for</strong>e must be able to<br />
deliver at the pressure required near the<br />
point of maximum storage capacity <strong>for</strong> the<br />
field or saline aquifer, at the required flow<br />
rate, though the well may be designed<br />
<strong>for</strong> a higher pressure. Unmanned offshore<br />
facilities are there<strong>for</strong>e possible when the<br />
pipeline pressure rating is sufficient.<br />
Routing design then focused on options<br />
between the two gas terminals and the<br />
major storage opportunities. However<br />
pipelines to those areas pass near to other<br />
smaller fields and it is this which makes the<br />
optimisation more difficult. Notably Leman,<br />
easily the most important area with over<br />
800mt storage, will see Shell looking to<br />
decommission a large part by 2025 whilst<br />
Perenco will continue production past 2030,<br />
thus requiring management to avoid the<br />
risk of interference between gas production<br />
and CO2 storage. Hewett is on the way to<br />
Leman from Theddlethorpe, with as early or<br />
earlier availability, so the obvious plan is to<br />
inject in Hewett until the early 2020s, then<br />
extend the trunk line to Leman. We label this<br />
the HL storage option. Hewitt and Leman<br />
lie south of the saline aquifers and are the<br />
most southerly fields. Additional storage<br />
requirements will need to be met<br />
by extending the route north and east.<br />
Indefatigable lies slightly further away than<br />
Viking and Leman and has an earlier gas<br />
decommissioning date. Given the size of<br />
Leman and dates they are less likely to be<br />
attractive as an extension of the HL storage<br />
option, but is an attractive area to route a<br />
trunk pipeline to as an alternative to Viking<br />
in the first instance. If Viking is used first,<br />
then Indefatigable, including the depleted<br />
Shell area, would be a valuable extension<br />
area once Viking is full. Viking represents the<br />
other major target area <strong>for</strong> trunk pipelines.<br />
Firstly, like Leman, there are closer fields<br />
lying on the route to Viking that offer a<br />
phased development of the pipeline. It is<br />
also overlain by a significant, and potentially<br />
most likely aquifer storage of 1114mt<br />
capacity which could be proven whilst Viking<br />
is used <strong>for</strong> CO2 storage. The problem with<br />
this option is the uncertainty about the use<br />
of saline aquifers, so a routing that picks up<br />
other stores is needed. Beyond Viking the<br />
Indefatigable field offers an excellent store<br />
as an alternative to an aquifer, and would<br />
extend the <strong>network</strong> to near the UK<br />
eastern limits.<br />
The intermediate storages that could be<br />
cheaply served by a pipeline to Viking<br />
include Amethyst E & W then Pickerill,<br />
Barque & Barque South, Galleon and<br />
Audrey, all lying on a line from the Dimlington<br />
/Easington terminal, and similarly from<br />
Theddlethorpe (maybe without Amethyst).<br />
As noted be<strong>for</strong>e some of these fields have<br />
low injectivity and would not be attractive<br />
unless easily served, have low flow rates<br />
and some re-use of facilities occur. This<br />
alignment also opens up future cost effective<br />
pipe options <strong>for</strong> the aquifers 2/48 and<br />
3/48, and Clipper. We label this Viking by<br />
increments route VI.<br />
The residual fields include Victor and Vulcan,<br />
possibly accessed from Leman or a Viking<br />
pipe route and making use of some existing<br />
pipelines, Sean as an eastern outlier and<br />
Schooner well to the north east. Ravenspurn<br />
North may be a special case as it deserves<br />
consideration as a possible step in a link to<br />
the northern North Sea or Schooner and<br />
saline aquifers, or as an opportunity <strong>for</strong> a<br />
pipeline from Dimlington.
Table 7.3 Summary of core routes<br />
Route Total distance km Note<br />
Easington VI 191 Includes Indefatigable<br />
HL 210 Pre 2030 only<br />
Theddlethorpe VI 195 Includes Indefatigable<br />
HL 190 Pre 2030 only<br />
Dimlington Ravenspurn 70<br />
7.9 SUMMARY OF CORE ROUTES<br />
On the basis of simplicity the HL option is<br />
best, particularly if high flow rates occur<br />
quickly and high well and field development<br />
costs mitigate against smaller storage sites.<br />
For uncertain timings of CO2 flows and a<br />
reasonable build up of flow the VI option<br />
appears best. It is possible to see that both<br />
routes would be developed if there is distinct<br />
phasing of the onshore system.<br />
The following lengths include allowances <strong>for</strong><br />
infield pipelines.<br />
The modelling of the filling schemes was<br />
done <strong>for</strong> both the HL and VI routes. Of<br />
particular note was the constraint of<br />
injectivity, meaning that all fields are found<br />
to be in use <strong>for</strong> at least 10 years with more<br />
than one field storing CO2 at all times<br />
after the start, thus mitigating the risk of a<br />
problem with a single field. It may be better<br />
<strong>for</strong> some fields to be further investigated<br />
to see what actual injectivity can be<br />
achieved as in general the timing of pipeline<br />
investment is driven by injection rates, not<br />
the storage capacity of the stores.<br />
Carbon Capture and Storage Network 29<br />
7.10 OFFSHORE ROUTE CHOICE<br />
The onshore design has led to a<br />
preference <strong>for</strong> a route from Theddlethorp.<br />
The choice between the VI and HL routes<br />
was determined by the relative costs,<br />
with VI not requiring early extension to<br />
Indefatigable if the adjacent aquifer is proven<br />
the HL being on average more costly. The<br />
major uncertainty, which affects both, is the<br />
potential use of saline aquifers. If no aquifer<br />
on the VI route is proven then VI would<br />
also be extended to Leman to provide<br />
secure storage. Conversely if the HL route<br />
was chosen the line extensions would be<br />
northwards to Indefatigable, Viking (including<br />
the aquifer), and Barque in order to meet<br />
possible scenarios.<br />
7.11 DECOMMISSIONING OF<br />
OFFSHORE pIpELINES<br />
The lives of the assets included in this<br />
study extend beyond 2050. We assume<br />
that decommissioning would be as is<br />
done <strong>for</strong> existing large diameter pipelines,<br />
which is that they are filled with inhibited<br />
seawater and left in-situ as the best current<br />
practice solution.
30<br />
8.1 DEVELOpMENT OF THE<br />
NETWORK<br />
This transport study is focused on the period<br />
2013 to 2030 to reflect the period in which<br />
key investment decisions in capture plants<br />
and local depleted gas reservoirs will most<br />
strongly interact. It is only focused on the<br />
needs of the Yorkshire and Humber area.<br />
This is in order to obtain a realistic estimate of<br />
the transport cost component of a decision<br />
to invest in carbon capture and storage.<br />
In the bigger picture, such as considered<br />
by the North Sea Task Force, enhanced oil<br />
recovery (EOR) in the northern North Sea,<br />
large scale saline aquifer storage, longer<br />
pipelines, and international trade in storing<br />
CO2 are important considerations. We<br />
assume that on balance these are positive<br />
opportunities <strong>for</strong> the further use of CCS in<br />
the Yorkshire and Humber area, and that<br />
additional and longer term use of CCS will<br />
be possible by extension of the <strong>network</strong> in<br />
the longer term. Too much speculation on<br />
the exact shape of that, beyond the asset life<br />
of the initial capture and storage decisions,<br />
seems unnecessary. However to be safe<br />
we have modelled the assumption that all<br />
the Tier 0 (over 1mt/year) and much of the<br />
smaller emitters up to 2050 do use CCS and<br />
shown that there is sufficient local storage to<br />
accommodate that amount of CO2.<br />
This study does take the simple premise<br />
that the amount of CO2 emissions are as<br />
current emissions plus publicly known<br />
proposals, such as new IGCC plants, plus<br />
correction <strong>for</strong> known short term reduced<br />
emissions due to low plant utilisation.<br />
This means that old plant, destined to be<br />
decommissioned in the study period, is<br />
assumed to be replaced with plant with<br />
the same emissions, and CCS choices are<br />
made at that time. It does not attempt to<br />
model plant outputs or <strong>for</strong> example the<br />
area’s grid export capacity. However factors<br />
such as increased electricity demand are<br />
reflected in the scenarios because plant<br />
replacements are brought <strong>for</strong>ward by<br />
prices and use of CCS with the new plant<br />
is evaluated. Whereas the old gas turbine<br />
or sub critical coal plants would not be<br />
retrofitted <strong>for</strong> CCS.<br />
The presence of oil refinery skills and the<br />
opportunity to build IGCCs means that<br />
not only CO2 but also H2 are more readily<br />
available. The inclusion of the possibility of<br />
H2 pipelines in the routing considerations<br />
is not important to the volume of CO2<br />
Carbon Capture and Storage Network<br />
8.0 DEPLOYMENT SCENARIOS<br />
transported, but is done to enable<br />
alternative investment decisions in base and<br />
peak power matching, chemical plants, and<br />
transport energy planning.<br />
Enhanced oil recovery is perhaps the best<br />
driver <strong>for</strong> CCS, relying as it does more on<br />
oil prices than political decisions about CO2.<br />
The density of sources in the study area<br />
makes it an excellent and secure source <strong>for</strong><br />
a commercial use of CO2. The disadvantage<br />
is the distance from the area to the oil fields.<br />
The proximity of depleted gas reservoirs is a<br />
significant risk reduction <strong>for</strong> sources wanting<br />
a low cost and secure sink <strong>for</strong> their CO2,<br />
against an EOR contract with shorter term<br />
and more onerous supply conditions which,<br />
if transport costs were lower, may offer<br />
lower unit costs. Given that there are other<br />
large sources closer to EOR opportunities<br />
that suffer from more expensive storage<br />
costs we considered that <strong>for</strong> the study<br />
period the area may not be competitive, and<br />
could not rely on, EOR as a sink <strong>for</strong> CO2.<br />
Shipping and long pipes <strong>for</strong> CO2 <strong>for</strong> EOR will<br />
be a potential boost <strong>for</strong> CCS in the region.<br />
Any such reduction in use of the offshore<br />
pipelines in the <strong>network</strong> scenarios is as likely<br />
to be offset by additional opportunities to<br />
transport CO2 from regions around the study<br />
area and in offering a secure sink <strong>for</strong> CO2 as<br />
an alternative to EOR.<br />
With the above in mind the following three<br />
scenarios were developed to bound and<br />
stress the timing and size of the CO2<br />
transport <strong>network</strong>.<br />
The general path of the <strong>network</strong> is depicted<br />
in figure 8.1.<br />
8.2 CENTRAL SCENARIO<br />
Broadly this describes there being no CO2<br />
transported until 2016, with by 2030 10 of<br />
15 Tier 0 sources connected to the <strong>network</strong>.<br />
This reflects a very substantial level of activity<br />
deploying CCS in response to real drivers.<br />
8.2.1 Scenario concept<br />
Principal influences are assumed to drive<br />
initial investment because of:<br />
Figure 8.1 General <strong>network</strong> route showing alternative offshore routes<br />
CASTLEFORD<br />
PONTEFRACT<br />
SCUNTHORPE<br />
HULL<br />
ROUGH<br />
EASINGTON<br />
GRIMSBY<br />
THEDDLETHORPE<br />
AMETHYST<br />
• Phase 3 and 4 of the ETS look as<br />
though CO2 values are in the €30-40/<br />
tonne range.<br />
• The outlook <strong>for</strong> coal prices is <strong>for</strong> 10 to 15<br />
years to remain systematically cheaper<br />
than gas and that Australia has invested<br />
in more capacity.<br />
• EU proposals covering CCS have EU<br />
Parliamentary and majority member state<br />
support, and this is being reflected in<br />
UK legislation both in implementing EU<br />
policy to reduce greenhouse gases and in<br />
implementing the UK Climate Change Act<br />
target. Planning changes to include CO2<br />
pipeline classification to be as strategic<br />
as high pressure gas lines.<br />
RAVENSPURN<br />
PICKERILL<br />
WEST SOLE BARQUE<br />
AUDREY<br />
VI<br />
GALLEON<br />
HL<br />
BACTON<br />
CLIPPER<br />
HEWETT<br />
SCHOONER<br />
VIKING<br />
VICTOR<br />
LEMAN<br />
INDEGATIGABLE<br />
SEAN
• ETS auctioned revenues from 2012 are<br />
used to enable 3, 450MW scale IGCC<br />
demonstration CCS plants and associated<br />
infrastructure in the area operational<br />
by 2020.<br />
• The competing uses <strong>for</strong> generation<br />
investment of nuclear, CCGTs and wind<br />
are not compellingly more attractive in<br />
company portfolios.<br />
• The Yorkshire and Humber area has a<br />
low cost base <strong>for</strong> transport and storage<br />
of CO2 from capture sources.<br />
To maintain a steady growth in CO2<br />
reductions beyond the initial government<br />
encouraged demonstrations and maintaining<br />
the above international market drivers<br />
through the 2020s will be moderated<br />
by factors such as<br />
• Good progress in significantly reducing<br />
the technical risks around capture,<br />
transport and storage. This includes<br />
secure storage, acceptable transport<br />
parameters, and operating up times and<br />
costs <strong>for</strong> the capture technologies.<br />
• Reasonable ability of industry to man<br />
up as nuclear builds match about<br />
present fleet. Sufficient knowledge and<br />
skill development to rank the UK as<br />
an important CCS country. This does<br />
assumes a redirection of ef<strong>for</strong>t from<br />
Olympic Games type work to power coal<br />
and nuclear power station construction<br />
from 2011 on.<br />
• There is a definite shift away from oil<br />
<strong>for</strong> transport points to additional power<br />
generation <strong>for</strong> electric/fuel cell cars, but<br />
biofuels and improved efficiency are<br />
helping meet targets.<br />
• Predictable growth in the local <strong>network</strong><br />
size to maintain good utilisation of pipes<br />
and storage to maintain the Yorkshire<br />
and Humber area as a low cost base <strong>for</strong><br />
transport and storage.<br />
• Good public understanding of the CCS<br />
principles and support <strong>for</strong> the concept.<br />
The long term investment decisions towards<br />
the end of the 2020s will have sufficient<br />
confidence in the following issues:<br />
• The long term energy sources <strong>for</strong> the UK,<br />
including long HVDC links, H2 corridors,<br />
energy <strong>for</strong> transport, and the potential <strong>for</strong><br />
fusion, are understood enough to maintain<br />
changing the existing coal emitters to CCS.<br />
Carbon Capture and Storage Network 31<br />
• However efficient use of coal is becoming<br />
an issue but natural gas CO2 capture is<br />
becoming viable.<br />
• Smaller, varied emitters, such as biomass<br />
CHP plants, and industrial processes have<br />
access to capture technology, and can<br />
benefit from CO2 trading and incentive<br />
schemes, to enable them to capture<br />
CO2 and inject into the low cost<br />
regional infrastructure.<br />
8.3 LOW GROWTH SCENARIO<br />
This describes CO2 flow beginning in 2017,<br />
with 8 of 15 Tier 0 sources transporting by<br />
2030. This illustrates a scale of activity <strong>for</strong><br />
an extensive <strong>network</strong>. It is not a low level of<br />
CCS activity- in the worse case nothing may<br />
be built be<strong>for</strong>e the mid 2020s and there is<br />
there<strong>for</strong>e no need <strong>for</strong> a <strong>network</strong> solution. It<br />
achieves some useful impact by 2030.<br />
8.3.1 Scenario concept<br />
Principle influences are assumed to drive<br />
initial investment because of:<br />
• Phase 3 and 4 of the ETS look as though<br />
CO2 values are in the €15-25/tonne range<br />
because of pressure to relax the National<br />
Allocations because of trade fears and<br />
energy intensive industry lobbying and low<br />
cost post Kyoto CDM type certificates.<br />
• The outlook <strong>for</strong> coal prices is <strong>for</strong> 10 to 15<br />
years to remain cheaper than gas but with<br />
increased volatility.<br />
• EU policies covering CCS are not<br />
mandatory and energy security as the<br />
priority is reflected in UK legislation both<br />
in implementing EU policy to reduce<br />
greenhouse gases and in implementing<br />
the UK Climate Change Act target.<br />
No allowances <strong>for</strong> testing storage integrity<br />
or changes to present planning rules <strong>for</strong><br />
CO2 pipelines.<br />
• ETS auctioned revenues from 2012 may<br />
be used <strong>for</strong> demonstration CCS plants<br />
and associated infrastructure by bidding<br />
in “rounds” of capacity.<br />
• The competing uses <strong>for</strong> generation<br />
investment of nuclear, CCGTs and wind<br />
are more attractive, though companies<br />
want CCS in their portfolios.<br />
• The Yorkshire and Humber area may have<br />
a low cost base <strong>for</strong> transport and storage<br />
of CO2 from capture sources.<br />
To maintain any growth in CO2 reductions<br />
beyond the initial government encouraged<br />
demonstrations and maintaining the above<br />
international market drivers through the<br />
2020s will be moderated by factors such as:<br />
• Progress is made in reducing the<br />
technical risks around capture, transport<br />
and storage by pilot plants. This includes<br />
secure storage, acceptable transport<br />
parameters, but there remains uncertainty<br />
over operating up times and costs <strong>for</strong> the<br />
full scale capture technologies.<br />
• There is a focus on nuclear builds and<br />
internationally the UK is not seen as a<br />
knowledge or skill centre <strong>for</strong> CCS.<br />
• Policy, efficiency and oil price moderation<br />
means there is no additional demand <strong>for</strong><br />
electricity, or hydrogen, <strong>for</strong> transport use.<br />
• Growth in the local <strong>network</strong> size is entirely<br />
driven by specific projects and there is<br />
little <strong>network</strong>ing benefit or capacity to <strong>for</strong><br />
new CCS projects to use.<br />
• Public uncertainty of the CCS principles<br />
and support <strong>for</strong> the concept.<br />
The long-term investment decisions towards<br />
the end of the 2020s will have sufficient<br />
confidence in the following issues:<br />
• The long term energy sources <strong>for</strong> the UK,<br />
including long HVDC links, H2 corridors,<br />
energy <strong>for</strong> transport, and the potential<br />
<strong>for</strong> fusion, are understood enough to<br />
discourage investment in coal CCS.<br />
• Natural gas CO2 capture remains unviable.<br />
• Some smaller, varied emitters, such<br />
as biomass CHP plants and industrial<br />
processes have access to capture<br />
technology and benefits from ETS and<br />
incentive schemes to enable them to<br />
capture CO2, but transport and storage<br />
costs are high.
32 Carbon Capture and Storage Network<br />
8.4 HIGH SCENARIO<br />
In this case the <strong>network</strong> starts to work in<br />
2014, with 12 of the 15 Tier 0 sources<br />
using it by 2030. It illustrates what might be<br />
possible given a very large drive to address<br />
climate change as soon as possible knowing<br />
the positive impact of early action.<br />
8.4.1 Scenario concept<br />
Principal influences are assumed to drive<br />
initial investment because of:<br />
• Phase 3 and 4 of the ETS look as<br />
though CO2 values are in the €45-60/<br />
tonne range.<br />
• The outlook <strong>for</strong> coal prices is <strong>for</strong> 10 to 15<br />
years to remain systematically cheaper<br />
than gas and China’s demand growth is<br />
well matched by supply.<br />
• EU proposals covering CCS have strong<br />
EU Parliamentary and majority member<br />
state support, and are part matched by<br />
China and others. This is reflected in<br />
UK legislation both in implementing EU<br />
policy to reduce greenhouse gases and<br />
in implementing the UK Climate Change<br />
Act and meet energy diversity goals with<br />
specific plans to <strong>for</strong> CCS implementation.<br />
Planning changes to include CO2 pipelines<br />
as strategic and EU cooperation to<br />
develop North Sea storage and EOR.<br />
• UK takes a lead by 2010 to commit<br />
to use ETS auctioned revenues from<br />
2012 to enable 4, 900MW scale IGCC<br />
demonstration CCS plants, 1 oxy fuel and<br />
a second post combustion demonstrator<br />
with associated infrastructures oversized<br />
to encourage more capture projects.<br />
• The competing uses <strong>for</strong> generation<br />
investment of nuclear, CCGTs and wind<br />
are less attractive in company portfolios.<br />
• The Yorkshire and Humber area has a low<br />
cost base <strong>for</strong> transport and storage of<br />
CO2 from capture sources with a strong<br />
cluster of four large demonstration plants<br />
and additional CCS capacity operational<br />
between 2014 and 2020.<br />
To maintain a growth in CO2 reductions<br />
beyond the initial government encouraged<br />
demonstrations and continuing the above<br />
international commodity market drivers<br />
through the 2020s will be moderated by<br />
factors such as:<br />
• Good progress in significantly reducing<br />
the technical risks around capture,<br />
transport and storage. This includes<br />
secure storage, acceptable transport<br />
parameters, and operating up times and<br />
costs <strong>for</strong> the capture technologies.<br />
• Private-public focus on training skills<br />
ability of industry to man up <strong>for</strong> new coal<br />
and nuclear rebuilds. Sufficient knowledge<br />
and skill development to rank the UK a<br />
leading CCS country. Clear redirection<br />
of ef<strong>for</strong>t from Olympic Games type work<br />
to power coal and nuclear power station<br />
construction from 2011 on.<br />
• Low carbon power demand increases<br />
the demand <strong>for</strong> CCS to meet increased<br />
energy replacement of oil <strong>for</strong> transport<br />
by use of hydrogen and electricity.<br />
• Attractive growth in the local <strong>network</strong> size<br />
allows early investment in pipe capacity<br />
and storage and maintains the Yorkshire<br />
and Humber area as a low cost base <strong>for</strong><br />
transport and storage.<br />
• Good public understanding of the CCS<br />
principles and support <strong>for</strong> the concept.<br />
The long-term investment decisions towards<br />
the end of the 2020s will have sufficient<br />
confidence in the following issues:<br />
• The long-term energy sources <strong>for</strong> the UK,<br />
including long HVDC links, H2 corridors,<br />
energy <strong>for</strong> transport, and the potential <strong>for</strong><br />
fusion, are understood enough to make it<br />
easy to decide to invest in CCS.<br />
• Steady improvement in CCS technology<br />
makes better use of coal and natural gas<br />
CO2 capture is viable.<br />
• Smaller, varied emitters, such as biomass<br />
CHP plants, and industrial processes have<br />
access to a range of capture technologies<br />
and are driven by allocation of allowances<br />
and some demonstrator schemes to<br />
enable them to capture CO2 and inject<br />
into the low cost regional infrastructure.<br />
8.5 STAND-ALONE COMpARISON<br />
The alternative to a <strong>network</strong> approach,<br />
particularly initially when driven by individual<br />
projects, is the standalone solution of one<br />
source, transport, and a storage site.<br />
Reviewing the Tier 0 sources, which emit<br />
over 1mt/year, the obviously ideal location<br />
<strong>for</strong> a standalone scheme is the Saltend site.<br />
This has the benefit of being close to the<br />
coast and a gas terminal, with a number<br />
of storage sites as noted in the section on<br />
storage. It is also isolated by the cost of an<br />
estuary crossing to join up with the cluster<br />
of emitters at Immingham. These factors<br />
make it a good test case when compared<br />
to say testing Ferrybridge with a standalone<br />
CCS system.<br />
Saltend was there<strong>for</strong>e used as comparison<br />
case. It is to be stressed that this was done<br />
without any alignment with whatever plans<br />
that site may have, but only to illustrate the<br />
impact of a <strong>network</strong> solution.<br />
An analysis was done <strong>for</strong> the central case<br />
with the three discount rates using the<br />
same cost data. It so happens that in this<br />
case the Tier 0 emissions at Saltend are<br />
assumed to start to be captured in 2023,<br />
as well as the Tier 1 emissions from a<br />
<strong>for</strong>eseen development at the site, both<br />
capturing and storing 90% of the <strong>for</strong>eseen<br />
CO2 emissions, and is assumed to continue<br />
at the same rate to 2050. This gives an<br />
ideal case of a significant flow rate from an<br />
ideal site of 3.1 mt/year. The target storage<br />
site is Ravenspurn which has the required<br />
injectivity <strong>for</strong> the source flows. Note that<br />
Amethyst, West Sole and small depleted<br />
fields are also potential targets. There is<br />
also potential reuse, at least <strong>for</strong> some years,<br />
of existing pipelines and use of offshore<br />
compression. These potentials also apply<br />
to the <strong>network</strong> solution, and to make the<br />
point <strong>for</strong> comparative evaluation both the<br />
standalone and <strong>network</strong> use the same<br />
assumptions of new pipelines and minimal<br />
offshore facilities. Please note that this is<br />
not a statement about any plans that in fact<br />
asset owners in this local area may have.<br />
8.6 SCENARIO QUANTITIES<br />
The flow rates <strong>for</strong> these scenarios is<br />
illustrated in figure 8.2.
As discussed above the flows are primarily<br />
from Tier 0 emitters because their volumes<br />
are the determinant of any sizing of a large<br />
scale transport solution, which in turn will<br />
enable smaller emitters to be connected.<br />
There demonstration and initial plant will<br />
bring learning and cost reduction which will<br />
gradually make the capture of smaller scale<br />
emissions more economic. No scenario<br />
includes Tier 2 flows be<strong>for</strong>e 2030. The<br />
“Low” scenario does not have Tier 1 be<strong>for</strong>e<br />
2030. “Central” and “High” have 0.3mt/year<br />
from 2023 and 2020 respectively, and<br />
“High” has increased Tier 1 flow to 1 mt/<br />
year by 2030.<br />
The cumulative total volumes are as<br />
shown in the table overleaf. Note that<br />
flows are extended through to 2050 based<br />
on continuing the trend in the scenario.<br />
This was done to stress test the <strong>network</strong><br />
capacity and indicates the potential to store<br />
CO2 in the context of the UK targets to<br />
address climate change.<br />
Table 8.1 Cumulative carbon dioxide stored <strong>for</strong> scenarios<br />
Network scenarios – cumulative flows million tonnes<br />
Figure 8.2 Stored carbon dioxide per year <strong>for</strong> scenarios<br />
2014 2015 2016 2017 2018 2019 2020 2021 2022 2023<br />
“Low” 2 4 7 9 15 21 28<br />
“Central” 3 9 16 23 29 38 47 57 68 85<br />
“High” 5 12 28 44 60 76 96 118 144 171<br />
Scenarios – cumulative flow without Saltend<br />
“Low” 2 4 7 9 15 21 28<br />
“Central” 3 9 16 23 29 38 47 57 68 82<br />
“High” 5 12 28 44 60 76 93 112 135 159<br />
Network scenarios – cumulative flows million tonnes<br />
2024 2025 2026 2027 2028 2029 2030 2040 2050<br />
“Low” 37 45 59 76 100 125 149 661 1241<br />
“Central” 109 136 163 194 233 281 328 917 1537<br />
“High” 200 234 273 317 365 418 471 1090 1737<br />
Scenarios – cumulative flow without Saltend<br />
Carbon Capture and Storage Network 33<br />
60<br />
50<br />
40<br />
30<br />
20<br />
10<br />
Low<br />
Central<br />
High<br />
Stored CO2 per year<br />
0<br />
2013 2014 2015 2016 2017 2018 2019 2020 2021 2022 2023 2024 2025 2026 2027 2028 2029 2030<br />
Year<br />
“Low” 37 45 56 71 92 113 135 641 1216<br />
“Central” 103 127 150 179 215 259 303 889 1506<br />
“High” 184 215 251 292 337 387 437 1052 1697
34<br />
9.0 ECONOMICS<br />
9.1 INTRODUCTION<br />
The transport and storage <strong>network</strong> <strong>for</strong><br />
the capture of carbon is focused on the<br />
period 2013 to 2030, which is most likely<br />
to host key investment decisions around<br />
capture plants and local depleted gas<br />
reservoirs. The objective of the economic<br />
analysis is to find a realistic estimate of the<br />
transport cost components (onshore and<br />
offshore) of a decision to invest in carbon<br />
capture and storage. At this stage of the<br />
project, the main emphasis is focused on<br />
costs rather than a comparison between<br />
costs, revenues, financing and benefits.<br />
Decision makers will be left with the issue of<br />
evaluating potential outcomes and choosing<br />
policies to achieve these outcomes in the<br />
presence of the intense complexity of the<br />
CCS <strong>network</strong>. These complexities will not<br />
be captured at this stage, but hope to be<br />
considered in a later stage. Management<br />
options can be developed comparing the<br />
three scenarios (low, central and high)<br />
described here, to cover the range of timing<br />
and scale uncertainty in the development of<br />
a transport system in the study period.<br />
This study refers to the volumes of<br />
transported and stored CO2. Please note<br />
that this is not the same as abated CO2,<br />
the measure of CO2 used in climate change<br />
analysis and national allocation plans which<br />
under pin revenue values of CO2. Abated<br />
CO2 is the net savings in CO2 emissions<br />
from a plant capturing or not capturing<br />
CO2. The difference is the additional energy<br />
used to capture, transport and store the<br />
CO2. This varies substantially between<br />
capture processes, but as it all has to be<br />
transported all figures here refer to stored,<br />
not abated volumes. To a small extent<br />
contaminants will also make the actual<br />
greenhouse gases stored a different amount<br />
than the volumes transported.<br />
Carbon Capture and Storage Network<br />
A context in which to consider the costs in<br />
this study is to look at the general market<br />
<strong>for</strong>ecasts <strong>for</strong> CO2 and CCS. European Union<br />
Allowances (CO2 prices) are <strong>for</strong>eseen in<br />
the 2008 to 2020 period to be €35/tonne<br />
(Deutsche Bank, Global Markets Research<br />
23rd July 2007 and repeated since). In<br />
another analysis by McKinsey <strong>for</strong> Vattenfall<br />
the merit order of abatement costs is plotted<br />
[10] which shows CCS as a large and<br />
necessary component in abating CO2 in<br />
the €25 - €34 tonne CO2 range. Scenario<br />
work by Shell [11] highlights the role of CCS<br />
but suggests needing €50 to €100/tonne<br />
to be commercial.<br />
Looking towards about 2030 under the<br />
Central scenario, with €50/tonne CO2 and<br />
volumes adjusted by a factor of 0.7 <strong>for</strong><br />
abated capture revenues, the economic<br />
activity added by the carbon capture and<br />
storage users of this <strong>network</strong> may amount<br />
to £1.2bn per year.<br />
9.2 COST BENEFIT ANALYSIS<br />
The ideal method of analysis with a project<br />
of this nature is to compare the costs and<br />
benefits of the economic, environmental<br />
and social aspects. The capture, transport<br />
and storage of CO2 is a complex activity<br />
and if the full benefits of the project are not<br />
considered the real value of the scheme will<br />
be undermined. Led by the Stern Review,<br />
there has been an increasing call from<br />
many quarters to subject all government<br />
programs to better cost benefit analysis,<br />
(CBA), because it provides a means of<br />
comparing complex projects, even when<br />
benefits and costs occur during different<br />
time periods. The steering group discussed<br />
this and considered that the wider impact<br />
of CCS on the area needed further study.<br />
Yorkshire Forward there<strong>for</strong>e commissioned<br />
a sustainable development study which will<br />
use input from this transport study.<br />
9.3 UNCERTAINTY IN INpUTS<br />
As noted earlier there are several cost data<br />
uncertainties that may affect this project,<br />
such as the price of steel and the market<br />
<strong>for</strong> lay-barges. These may have large<br />
uncertainties, <strong>for</strong> example +/- 50%, <strong>for</strong><br />
doing work in the near term, let alone in 20<br />
years time. For this study this uncertainty is<br />
mitigated in three ways:<br />
• Firstly there are multiple phases over the<br />
period, with many different components,<br />
so that a distribution of results arises<br />
when combined. This ensures that the<br />
overall cost will be more accurate than<br />
the individual component accuracy.<br />
• Secondly in order to be robust we<br />
have used current technology and new<br />
build infrastructure, and assumed that<br />
there will be no offshore compression<br />
which simplifies the interface to storage<br />
sites. Agreement to enable incremental<br />
investment does require more than one<br />
major emitter to commit, but routes and<br />
especially the onshore pipeline <strong>network</strong><br />
does not require many emitters to commit<br />
in the early stages of the <strong>network</strong>.<br />
• Thirdly the choices made in arriving at<br />
the presented results have been done in<br />
a consistent and comparative way. This<br />
means that it is possible to rework the<br />
IEA Mersey-Dee [14] study to compare<br />
with these figures, though the output<br />
analysis is not immediately comparable<br />
without applying the same assumptions.<br />
Within this study the comparison between<br />
the <strong>network</strong> and standalone figures are<br />
valid, but in doing a business case <strong>for</strong> a<br />
standalone or a project in the <strong>network</strong><br />
different details and timings will give<br />
different actual costs.
9.4 DISCOUNT RATE<br />
The decision to use an appropriate discount<br />
rate to evaluate the cost of CCS is highly<br />
important. There are a variety of discount<br />
rates that could be used in this study.<br />
Choosing the correct rate <strong>for</strong> a cost analysis<br />
or CBA is important because society wishes,<br />
in principle, to undertake a mix of public and<br />
private investments that can maximize social<br />
well-being. To undertake an investment, the<br />
expected return on that investment must<br />
cover all costs (investment, operation and<br />
maintenance costs), including the rate of<br />
interest. Under fairly restrictive assumptions,<br />
one can argue that the investment will<br />
continue until returns across alternatives<br />
are the same and just balance the returns<br />
required by savers. Under these conditions,<br />
one can argue that a single interest rate and<br />
a single rate of return on capital will prevail<br />
throughout the economy. In reality, however,<br />
there are a number of reasons that multiple<br />
rates prevail. The choice facing the decision<br />
maker is which of these many rates may<br />
apply in a CBA.<br />
There are several important points that need<br />
to be considered when we make a decision<br />
on the discount rate:<br />
Higher interest rate verses lower<br />
interest rates – although it is possible to<br />
define the reasons that differentiate interest<br />
rates, it does not mean that choosing a<br />
rate <strong>for</strong> analysis is a simple task. On the<br />
contrary, in the final analysis the choice of<br />
a rate is fairly arbitrary. For this reason, it is<br />
typically the case that individuals who are<br />
in favour of larger government investments<br />
to protect the environment can make<br />
arguments <strong>for</strong> low rates, whereas those who<br />
would prefer less government involvement<br />
in the economy can make equally plausible<br />
arguments <strong>for</strong> higher rates. It is clearly the<br />
case that higher interest rates will lead<br />
to fewer projects presenting positive net<br />
present values than lower ones.<br />
Carbon Capture and Storage Network 35<br />
Un<strong>for</strong>tunately, the arguments used<br />
to support both these positions are<br />
complicated and fail to lead to a definitive<br />
solution. Undertaking an additional public<br />
project will be possible through displacing<br />
private consumption, private investment<br />
or some fraction of both. If one displaces<br />
consumption by undertaking the public<br />
investment, then the appropriate discount<br />
rate is the consumer’s after tax time<br />
preference, a relatively low rate of return.<br />
If one displaces private investment the<br />
investment displaced is at a higher, be<strong>for</strong>e<br />
tax rate of return. Because the purpose of<br />
CBA is to increase public well-being, it does<br />
not want to use parameter variables that<br />
lower the effective national rate of return<br />
on investment or variables that displace<br />
consumption by consumers inappropriately.<br />
There are several approaches that have<br />
been suggested to cope with this problem.<br />
If one knew the proportion at which<br />
the public investment displaced private<br />
investment and private consumption<br />
he/she could weigh the two and <strong>for</strong>m an<br />
average discount rate accordingly. Taking<br />
the above into consideration, perhaps,<br />
more appropriately one could apply a more<br />
complicated model to take into account the<br />
fact that the costs and benefits specifically<br />
related to the displaced private consumption<br />
and displaced private investment occur<br />
at different points in time. In practice,<br />
in<strong>for</strong>mation needed <strong>for</strong> either approach<br />
is generally unavailable. Thus, the debate<br />
appears to return to personal preference <strong>for</strong><br />
public investment.<br />
Inflation – It is difficult to model the range<br />
of expectations, but, unless specifically<br />
defined and modelled, there is implicit rate<br />
within a total discount rate that reduces a<br />
series of numbers over time to a present<br />
value. We currently have a period of low<br />
inflation that sees 1.5 to 3% inflation as<br />
normal. For the purposes of time adjustment<br />
to input costs, and including implicitly within<br />
discount rates a single figure has been used<br />
<strong>for</strong> this study.<br />
Impact of taxes – Conflict in choosing a<br />
rate generally arises over the role that taxes<br />
play in determining interest rates. Because<br />
of corporate income taxes and personal<br />
income taxes, the rate of return on a private<br />
investment is greater than the after tax<br />
return. It is also true that the consumer<br />
after tax rate of return time preference is<br />
lower than the be<strong>for</strong>e tax rate of return. This<br />
means that consumers make the decision<br />
of how much to save based on the after tax<br />
rate of return, while business investors make<br />
the decision of how much to invest based<br />
on be<strong>for</strong>e tax rates of return.<br />
Climate change issues – Debates over<br />
long-term environmental issues such as<br />
global climate change (control of CO2<br />
release) tend to focus on inter-generational<br />
equity, rather than intra-generational<br />
efficiency. The choice of an interest rate is<br />
largely a pursuit to help the public sector<br />
choose investments that will improve the<br />
over-all level of national economic well-being<br />
<strong>for</strong> a given set of consumers and investors.<br />
Many investments take place over long timespans,<br />
some of which are long enough to be<br />
inter-generational. A decision to undertake<br />
CO2 abatement to reduce the probability of<br />
global warming is a decision to <strong>for</strong>go the<br />
increment of consumption or retirement<br />
<strong>for</strong>ever. Moreover, because most benefits<br />
will occur long into the future, almost any<br />
reasonable discount rate, even one reflecting<br />
consumption time preference, rather than<br />
private rate of return, will suggest that the<br />
project is inefficient. For these reasons,<br />
attention turns from efficiency concerns,<br />
getting the right rate of private and public<br />
rates of return, to equity concerns, taking<br />
into account the rights of future generations.<br />
Economists argue generally a social rate<br />
of time preference is appropriate <strong>for</strong> intergenerational<br />
discounting, which would be<br />
composed of two components.
36<br />
The first is a “pure” time preference that<br />
is arguably zero, in the sense that a<br />
significant positive rate would preclude<br />
intergenerational investments. A zero<br />
rate means that the well-being of future<br />
generations is given equal weight to the<br />
well-being of the current generation.<br />
However, due to a second component,<br />
that rate need not be negative. The second<br />
component reflects the fact that future<br />
generations will likely be much better off<br />
economically than the present generation,<br />
even at modest rates of economic growth.<br />
Hence, policies to sacrifice current<br />
consumption in favour of future consumption<br />
essentially transfer wealth from the poorer<br />
current generation to the wealthier future<br />
generation. Thus, a small, but positive social<br />
rate of time preference is justified. This rate<br />
combines the fact that economic growth<br />
will occur, adjusted <strong>for</strong> the fact that marginal<br />
increases in wealth will yield increasingly<br />
smaller increases in economic satisfaction.<br />
Considering these factors a decision was<br />
made to use fairly straight<strong>for</strong>ward discount<br />
rates to compare cost of three different<br />
scenarios which may be visualised as based<br />
on a Bank of England rate of 5%, as:<br />
• A lower, wider economic rate, bearing in<br />
mind the impact that this investment has<br />
on most other future investments (effective<br />
government support).<br />
• A likely rate <strong>for</strong> a transport company well<br />
integrated by ownership and contracts<br />
with the source and sink companies <strong>for</strong><br />
whom this is just a part of an overall<br />
investment in CCS (80% debt).<br />
• A standalone company without any other<br />
interests (70% debt).<br />
However this is only one perspective; the<br />
range of rates is given so that they can be<br />
interpreted from whichever rate is necessary.<br />
The chosen discount rates are 6.5%, 11%<br />
and 14%. If not stated reported figures are<br />
based on an 11% rate.<br />
Carbon Capture and Storage Network<br />
9.5 METHOD AND<br />
INTERpRETATION OF COST<br />
CALCULATIONS<br />
The discounting of costs over time is a way<br />
of reconciling expenditures that occur over<br />
a number of years where you are making<br />
decisions between the attractiveness of<br />
different investments. To do so, all options<br />
are calculated relative to the same year.<br />
Starting with the cost in<strong>for</strong>mation <strong>for</strong> the<br />
<strong>network</strong> we can say that if it was all built in<br />
2008, that is all the pipelines, pumps and<br />
plant, it would cost about £2.0bn. If you<br />
built it in the future we expect some inflation<br />
of those costs, say a long-term average<br />
of 2% per year, so in 2013 the same plant<br />
would cost £2.2bn and <strong>for</strong> the <strong>network</strong><br />
“Central” example with different timing of<br />
parts over the period out to 2040 the cost is<br />
£2.6bn allowing <strong>for</strong> inflation.<br />
However not everything needs to be built<br />
today, so if as a organisation you could<br />
invest some money at the same risk as<br />
spending on the <strong>network</strong>, at say <strong>for</strong> example<br />
11%, until you needed to actually spend it<br />
on the <strong>network</strong>. This return on investment<br />
more than offsets the inflation of costs.<br />
The same applies to the operating costs.<br />
Between 2008 and 2040 these are £6.3bn<br />
at 2008 costs, but obviously most of this<br />
expenditure is many years ahead.<br />
Adding the capital and operating spends<br />
<strong>for</strong> each year, adjusted <strong>for</strong> inflation, the<br />
total cost in 2008 is £8.9bn. But given the<br />
opportunity to invest between now and<br />
when the expenditure actually occurs, at<br />
a rate of 11%, we can discount the future<br />
expenditure by 11% per year. This gets all<br />
the costs of making the decision to invest<br />
in the <strong>network</strong> back to 2008 values which<br />
allows comparison of the concept of a<br />
<strong>network</strong> with alternative ways of transporting<br />
CO2. It also provides data <strong>for</strong> adding to a<br />
business case <strong>for</strong> a full carbon capture and<br />
storage scheme which can then include<br />
revenue, taxation and other issues not<br />
included in this analysis.<br />
Doing this reduces the amount the decision<br />
costs in 2008 to £1.44bn, made up of<br />
£0.75bn capital spend and £0.69bn of<br />
operating costs. The £2bn costing of the<br />
plant if all built now is reduced to £0.75bn<br />
due to time effects. Once you decide what<br />
your discount rate is, in this example 11%,<br />
a cost of £1.44bn, combining capital costs<br />
and operating costs, is there<strong>for</strong>e the correct<br />
way to look at the decision to invest in<br />
the <strong>network</strong>.<br />
To further illustrate this say that no<br />
choice about the whole system was<br />
made until 2015 and the system started<br />
transporting the first CO2 in 2016. In that<br />
case all comparisons are recalculated and<br />
referenced to 2015 pounds and there is less<br />
time <strong>for</strong> the effect of deferred expenditure to<br />
reduce the apparent costs of the decision<br />
in that year. The period considered is still<br />
out to 2040. This is an arbitrary choice of<br />
a 25 year evaluation. Because inflation and<br />
discounting is a rate per year it compounds<br />
so that the present cost of £100 in 2015 but<br />
spent in 2040 is only £12 in 2015 value.<br />
The cost in 2015 can be said to be £2.8bn<br />
expressed in 2015 pounds.<br />
The amount of CO2 transported by the<br />
system can indicate the <strong>network</strong> cost. Care<br />
must be taken in use of this as it depends<br />
on how long the system is operational as<br />
the design life of most of the capital cost is<br />
greater than 25 years the average cost is<br />
reduced by more years of operation. In the<br />
“Central” scenario the amount transported<br />
by 2040 is 846 million tonnes, or 0.85bn<br />
t/CO2.<br />
For a 2008 decision the present cost per<br />
tonne is £1.44bn/0.85btCO2, or £1.7/tonne.<br />
For a 2015 decision the 2015 cost is<br />
£2.8bn/0.85btCO2, or £3.3/tonne in<br />
2015 costs.
The UK is relatively expensive <strong>for</strong> transport<br />
due to the high cost base and the need<br />
to transport offshore. Route lengths are<br />
at least 100km to 400km. This compares<br />
with some US examples where storage<br />
can be adjacent to the site or sold to an<br />
existing EOR pipe <strong>network</strong>. The Yorkshire<br />
and Humber area is however, in UK terms,<br />
attractive <strong>for</strong> the distances required,<br />
especially given the large volumes.<br />
We stress that the revenue to recover this<br />
cost is much greater. A £100 today, with<br />
the same inflation and investment value<br />
as above, is the same present value as<br />
receiving £828 in 25 years. The bulk of<br />
revenue occurs much later than the capital<br />
expenditure, so the effect of its benefit in<br />
present value is also lessened. To illustrate<br />
this <strong>for</strong> the case of 2% inflation and 2%<br />
discount the cost per tonne expressed in<br />
terms of capital and operating cost may be<br />
£1/tonne, but expressed in terms of revenue<br />
timing maybe £5/tonne.<br />
A number of other issues affect revenue<br />
requirements and without a commercial<br />
structure <strong>for</strong> the <strong>network</strong> it is premature<br />
to advise the minimum revenue to recover<br />
the transport costs, but is certainly greater<br />
than the above due to the time difference<br />
between expenditure and revenue. Similarly<br />
a full economic analysis requires the wider<br />
economic benefits to be calculated over<br />
time. The costs in this study can be used<br />
as input costs to those financial and<br />
economic evaluations.<br />
Carbon Capture and Storage Network 37<br />
9.6 RESULTS<br />
Simple analysis of the cost comparison of<br />
high, central and low scenarios of onshore<br />
and offshore CCS is given below.<br />
The capital expenditure, expressed in 2008<br />
terms and shown by cumulative amounts<br />
up to the date given is shown in the table<br />
overleaf.
38 Carbon Capture and Storage Network<br />
Table 9.1 Cumulative capital cost<br />
Cumulative capital cost £ million Cost to accommodate only<br />
pre 2030 sources<br />
Discount Year 2020 2030 2040 2050 2050<br />
Low 725 908 961 725<br />
6.5% Central 825 1,205 1,205 1,205 1,073<br />
High 1,007 1,304 1,304 1,304 1,132<br />
Low 297 434 499 514 434<br />
11% Central 579 763 763 763 708<br />
High 763 899 899 899 827<br />
Low 230 316 349 356 316<br />
14% Central 465 579 579 579 550<br />
The variability of timing in line with growth<br />
of inputs and filling of storage sites gives<br />
rise to some steps in the data. In addition if<br />
only the sources connected to the <strong>network</strong><br />
be<strong>for</strong>e 2030 are served by the <strong>network</strong><br />
through to 2050 then some expenditure just<br />
be<strong>for</strong>e 2030 is not necessary, as well as<br />
capital spend after 2030. The effect of this<br />
reduced capital expenditure is illustrated in<br />
the right hand column of table 9.1.<br />
Table 9.2 Cumulative carbon dioxide stored<br />
High 640 723 723 723 682<br />
For all scenarios the spend to 2050 if all the<br />
<strong>network</strong> was built today is £2bn, but if the<br />
capacity was limited to 2030 flow rates the<br />
costs would vary from £1.3bn to £1.7bn.<br />
Cumulative CO2, million tonnes to date With capital to only accommodate<br />
pre 2030 flow rates<br />
Year 2020 2030 2040 2050 2050<br />
Low 9 149 526 1,072 632<br />
Central 35 314 846 1,450 1,263<br />
High 96 471 1,048 1,681 1,543<br />
The cost per tonne stored is based on<br />
capital costs and operating costs, expressed<br />
as 2008 costs, divided by the cumulative<br />
amount of CO2 stored. The initial flows start<br />
between 2014 and 2018, and <strong>for</strong> a 25 year<br />
project analysis the 2040 figures are the<br />
most relevant, but the 2050 figures are most<br />
relevant <strong>for</strong> climate change targets. The costs<br />
per tonne are shown in the table opposite.
Table 9.3 Cumulative average cost £/tonne<br />
Cumulative average cost £/tonne CO2 stored<br />
Discount Year 2040 2050 2050 only <strong>for</strong> 2030 sources<br />
Low 3.34 1.98 2.85<br />
6.5% Central 3.28 2.21 2.27<br />
High 2.76 1.92 2.02<br />
Low 1.57 0.88 1.30<br />
11% Central 1.71 1.06 1.12<br />
High 1.57 1.01 1.09<br />
Low 1.02 0.53 0.84<br />
14% Central 1.18 0.71 0.76<br />
High 1.16 0.73 0.79<br />
The conclusion is that <strong>for</strong> the central case<br />
by 2040 846 million tonnes would be<br />
transported <strong>for</strong> an average cost of £1.71/<br />
tonne. Due to timing of investments and<br />
design differences the other cases in this<br />
instance have a lower cost per tonne, but<br />
the table shows that different discount rates<br />
have more influence on costs per tonne than<br />
do the differences between scenarios.<br />
If not otherwise noted the costs per tonne<br />
refer to the 2040 volumes and cumulative<br />
costs at 11% discount using £1.70/tonne.<br />
Analysis of the most favourable standalone<br />
case of a near coastal source using just<br />
Ravenspurn North <strong>for</strong> storage from the<br />
same date as the central scenario shows<br />
the following comparison:<br />
Table 9.4 Cumulative average cost £/tonne best stand-alone comparison<br />
Cumulative average cost £/tonne CO2 stored<br />
Year 2040 2050<br />
Ideal standalone 1.83 1.33<br />
Central 1.71 1.06<br />
An inland site has additional pipeline costs<br />
and future business case analysis may show<br />
revenue requirement differences which make<br />
the standalone case less attractive, but the<br />
first emitter to commit to CO2 capture and<br />
storage does face higher costs whether<br />
or not their pipeline becomes part of an<br />
evolving <strong>network</strong>. There is there<strong>for</strong>e a need<br />
to address the problem of <strong>network</strong> initiation.<br />
Carbon Capture and Storage Network 39
40<br />
10.0 CONCLUSION<br />
The first step in meeting the aims of the<br />
Carbon Capture and Storage Partnership<br />
<strong>for</strong> Yorkshire and Humber was to focus<br />
work on the economic costs of the transport<br />
component, excluding capture and storage<br />
costs, of a carbon capture and storage<br />
(CCS) area <strong>network</strong> solution serving multiple<br />
sources and offshore geological storage.<br />
The major commercial concern regarding<br />
CCS is uncertainty of the value of CO2. For<br />
a particular plant the major cost decision<br />
faced by an individual plant operator is that<br />
required to capture their CO2, as the capture<br />
largest cost component of CCS. This study<br />
does not address the value or revenue or<br />
accounting aspects of CCS.<br />
This study provides a regional level transport<br />
feasibility study. It shows that a <strong>network</strong><br />
decision at an economic level is relatively<br />
cost attractive, which is important in terms<br />
of choices regarding what the UK should<br />
do to reduce CO2 emissions.<br />
The inputs <strong>for</strong> individual investments<br />
cascade down from a global level, well<br />
beyond local concerns, but what can be<br />
achieved at regional level is the provision of<br />
a route and storage option <strong>for</strong> a local emitter<br />
considering capture of their CO2.<br />
Carbon Capture and Storage Network<br />
The amount of storage near to Yorkshire<br />
and Humber is large, but not much larger<br />
than the potential maximum supply from the<br />
region to 2050, or if emitters from outside<br />
the region decide to store CO2 in the same<br />
area of the southern North Sea. Even<br />
though the potential <strong>for</strong> use of depleted<br />
gas fields is very good, access, injectivity<br />
and volumes require to be confirmed.<br />
Furthermore, there is a definite need to<br />
establish the availability or otherwise of<br />
saline aquifer storage. The preferred offshore<br />
routing reduces access costs to the larger<br />
aquifers, 2 or routes to enough depleted<br />
gas fields to accommodate output from<br />
emitters starting to capture be<strong>for</strong>e 2030 and<br />
continuing to store until 2050. To have the<br />
most security of choice <strong>for</strong> local storage,<br />
including post 2050 storage, without use of<br />
deep saline aquifers, all the large depleted<br />
gas fields are needed to meet the CO2<br />
capture scenarios.<br />
To develop a CCS <strong>network</strong> to service more<br />
than one plant, the additional issues of<br />
transport and storage of CO2 need to be<br />
in place to support an investment decision<br />
on CO2 capture at multiple sites.<br />
The next steps to do this are described<br />
in the recommendations section.<br />
Considering what commitment is required to<br />
create a <strong>network</strong> some of the choices within<br />
the scenarios suggests that a general aim to<br />
deploy CCS at large scale is important as it<br />
enables economies of scale. However, the<br />
detailed timing and level of emissions from<br />
a single source are only important over a<br />
shorter term, i.e. within about a 5 to 7 year<br />
window. In other words in the short term the<br />
sizing and routing decisions are affected by<br />
significant (>200,000t/year) volumes. Thus<br />
long-term commitments enables pipelines,<br />
generic way leave planning and agreements<br />
on storage sites, short term commitments<br />
enables incremental pipe sizing and offshore<br />
well developments.<br />
The initiation of a <strong>network</strong> remains a<br />
particularly difficult problem as the first<br />
user takes a much higher risk and greater<br />
costs than someone joining after it is<br />
well established.<br />
A key recommendation is to address how<br />
to provide the first parts of the <strong>network</strong>.<br />
The main thrust is to aim to re-use existing<br />
infrastructure when the first commitment<br />
is relatively small. This must reduce costs<br />
and will also have value if it can defer costs.<br />
The uncertainties include timing, technical<br />
suitability, decommissioning and ownership<br />
transfers or agreement on asset costs, store<br />
licensing and liabilities
A second part of this initial phase, and<br />
<strong>for</strong> each large capacity increase, will be<br />
the aggregation of commitments. For this<br />
we see the Carbon Capture and Storage<br />
Partnership <strong>for</strong> Yorkshire and Humber as the<br />
starting point.<br />
Looking to the local community,<br />
communication and engagement will<br />
have to develop so that the benefits are<br />
understood and people have the facts<br />
available when particular questions and<br />
consultations arise so that timely and<br />
appropriate decisions are made.<br />
Outward communication and awareness<br />
will also be important. Firstly to attract a<br />
cluster of early CCS projects, secondly to<br />
ensure national political support and thirdly,<br />
because of the excellent potential to do so,<br />
to materially contribute to meeting the UK’s<br />
climate change targets.<br />
Stern states that a disproportionately<br />
large share of the burden <strong>for</strong> achieving<br />
the required cuts will have to be borne by<br />
the power-generation sector (Reference 1<br />
pxiii):“Large-scale uptake of a range of clean<br />
power, heat, and transport technologies<br />
is required <strong>for</strong> radical emission cuts in the<br />
medium to long term. The power sector<br />
around the world will have to be at least<br />
60%, and perhaps as much as 75%,<br />
decarbonised by 2050 to stabilise at or<br />
below 550ppm CO2e.” Given the substantial<br />
power sector in the Yorkshire and Humber<br />
region the scale of the transport <strong>network</strong><br />
covered by this study will support<br />
this requirement.<br />
Carbon Capture and Storage Network 41<br />
The range of scenarios <strong>for</strong> the <strong>network</strong><br />
covers transport of, in total, between 150<br />
and 470 million tonnes carbon dioxide by<br />
2030 and by 2050 between 630 million<br />
tonnes (with no further sources added after<br />
2030) to 1700 million tonnes (with high and<br />
continuing CCS after 2030).<br />
The capital cost spend is about £2.0<br />
billion if it was all built today, but spreading<br />
expenditure over time and adjusting <strong>for</strong><br />
inflation, the present cost of a decision to<br />
build a <strong>network</strong> depends on the discount<br />
rate you choose to apply, but <strong>for</strong> a 6.5%<br />
discount the capital costs vary by scenario<br />
from £0.7bn to £1.0bn, and with a 14%<br />
discount rate the present cost of the<br />
decision is to spend £0.3bn to £0.6bn.<br />
The “Central” scenario and 11% discount<br />
gives a £0.7bn present cost.<br />
Operating costs are also modelled and<br />
the combined capital and operating spend<br />
divided by the amount of carbon dioxide<br />
transported is used to calculate the present<br />
value using a range of discount rates<br />
to reflect the time and risk value of the<br />
expenditure. These costs, as explained<br />
previously, are not the revenues required.<br />
The cost per tonne transported is<br />
there<strong>for</strong>e dependent on how long the<br />
system operates and under what financial<br />
assumptions, but <strong>for</strong> a fixed asset<br />
maximising volumes per year means lower<br />
costs per tonne and a longer period are<br />
cheaper per tonne. However cutting the<br />
period of consideration to from about 2015<br />
to 2040, about 25 years of operation, the<br />
unit costs are more representative, though<br />
we are still only in 2008. The different<br />
scenarios, <strong>for</strong> a given discount rate, show<br />
very little difference in unit costs. For<br />
example <strong>for</strong> an 11% discount rate the cost<br />
per tonne varies from £1.5 to £1.7/tonne.<br />
Due to investment timing the “Central”<br />
scenario has the higher rate, and that<br />
cost of £1.70/tonne has been used as the<br />
illustrated result. The conclusion is that the<br />
discount rate is more important than the<br />
scenarios when looking at transport costs<br />
per tonne.<br />
Given a range of discount rates of 6.5%<br />
to 14% the costs per tonne of £1.2/tonne<br />
($2.1, €1.6/tonne) to £3.4/tonne ($6,<br />
€4.7/tonne), with a mid point of 11% of a<br />
round £1.7/tonne ($3.1, €2.4/tonne) CO2<br />
transported as at 2008 <strong>for</strong> the period 2015<br />
to 2040.
42<br />
The recommendations following this study<br />
are detailed and specific to the aims of the<br />
Carbon Capture and Storage Partnership<br />
<strong>for</strong> Yorkshire and Humber. Though this<br />
report shows the benefits of large scale<br />
co-operation in addressing climate change<br />
using CCS, it rests on effective initiation<br />
to the ability to transport CO2. This will<br />
best be enabled by a cluster of projects,<br />
driven by UK government policy and other<br />
mechanisms, to quickly reduce both capture<br />
costs, transport and storage costs. Strategic<br />
leadership at the highest level is required<br />
to ensure that this project develops at the<br />
necessary pace and scale to contribute<br />
to the draft Climate Change bill target to<br />
cut CO2 emissions compared to 1990 by<br />
26% to 32% by 2020. Potentially, it could<br />
capture a significant proportion of those<br />
emissions by 2020. The recommendations<br />
are grouped as follows:<br />
Carbon Capture and Storage Network<br />
11.0 RECOMMENDATIONS<br />
11.1 GOVERNMENT<br />
Yorkshire Forward promote a cluster of CCS<br />
projects to be an early material action in<br />
addressing climate change and justify an<br />
efficient CO2 transport and storage system<br />
driven by the co-operation by the capture<br />
site organisations and public bodies.<br />
The UK government, through whatever<br />
process including zero emissions power<br />
projects, funding support, provision of<br />
infrastructure or other means, designate a<br />
cluster approach apply to the first phase<br />
of CCS projects in the UK demonstrating<br />
CCS at least at the scale of the current<br />
demonstration proposal. This should be<br />
in line with at least the time scales of the<br />
“Central” scenario with operation in 2016 in<br />
order to materially address the cumulative<br />
emissions of CO2 from this country.<br />
An early decision is needed to establish a<br />
long-term, secure funding stream from UK<br />
revenues derived from the EU Emissions<br />
Trading Scheme, both in phase II and phase<br />
III of the ETS to deploy CCS.<br />
Provide further evidence of regional<br />
CCS benefits.<br />
Enable regulation to secure way leaves in<br />
the same way as <strong>for</strong> natural gas pipelines.<br />
Progress the ability to transport and store<br />
CO2 from non-UK sources.<br />
11.2 ECONOMIC WORK<br />
Cost benefit analysis on the sustainable<br />
development of CCS; this has already been<br />
initiated by Yorkshire Forward.<br />
Adopt or develop example business cases<br />
<strong>for</strong> the complete CCS activity including<br />
capture and storage to illustrate public<br />
discussions <strong>for</strong> a number of Tier 0 (Over<br />
1m tonne/year) emitters with CO2 value<br />
and various financial assumptions using the<br />
<strong>network</strong> transport costs as an input.<br />
Evaluate the potential to reduce the initial<br />
costs of establishing the <strong>network</strong> by re-use<br />
of existing infrastructure.<br />
Develop the value added aspects of CCS<br />
including enhanced oil recovery, shared use<br />
of way leaves, synergy of decommissioning<br />
gas fields, importation of CO2 <strong>for</strong> storage,<br />
physical offsetting between sources on the<br />
<strong>network</strong>, and impacts <strong>for</strong> smaller emitters.<br />
More detailed scenarios to understand the<br />
possible scope and benefits <strong>for</strong> the local<br />
supply of H2 via pipeline to conveniently<br />
located smaller power and combined<br />
heat and power installations to demonstrate<br />
the possibilities.<br />
Linear programming and sensitivity analysis<br />
to show the most effective project scenario,<br />
fundamental variables and incremental<br />
benefits or impacts from manipulating<br />
project variables.
11.3 TECHNICAL<br />
Research into offshore storage site<br />
availability: viability of depleted gas fields,<br />
current decommissioning details, dates of<br />
use, possibility of using existing pipelines,<br />
wells and structures, and likely monitoring<br />
issues and approaches.<br />
Research into southern North Sea saline<br />
aquifers; identify uncertainties associated<br />
with them and the methods, timescales and<br />
costs to prove them as stores <strong>for</strong> CO2.<br />
Further investigation of selected fields<br />
to model what actual injectivity can be<br />
achieved to determine the costs and<br />
benefits of field investment and timing<br />
of transport links.<br />
11.4 CARBON<br />
Research into carbon footprint of whole<br />
CCS <strong>network</strong> from each plant to storage:<br />
calculate how much carbon will be used in<br />
the whole process i.e. including converting<br />
plants/capture/transport/storage. Abated<br />
value analysis compared to stored costs.<br />
Evaluate CCS compared to improved<br />
demand side/efficiencies, nuclear, CHP<br />
and renewable energy as a low carbon<br />
energy source.<br />
Carbon Capture and Storage Network 43<br />
11.5 SOCIAL<br />
Research into public and industry<br />
perceptions of CCS; how current population<br />
feels/how to increase knowledge/how to<br />
improve perception etc.<br />
More detailed research into environmental<br />
impacts of CO2 transport, both pipelines<br />
and shipping.<br />
Further research into detailed benefits both<br />
social/environmental it will bring to region<br />
as a whole.<br />
11.6 SAFETY<br />
Continue support <strong>for</strong> the health and safety<br />
work of the CCSA and UKCCSC.<br />
Detailed safety case of CO2 transportation<br />
onshore including consultation with the HSE.<br />
The issues of a shared way-leave between<br />
CO2, natural gas and H2 pipes be<br />
understood and, <strong>for</strong> certain routes, wayleaves<br />
are designed with this option in mind.
44<br />
12.0 CCS GLOSSARY<br />
Anthropogenic source Source which is man-made as opposed to natural.<br />
Aquifer Geological structure containing water and with significant permeability to allow flow; it is bound by seals.<br />
BAT Best available technology<br />
Carbon Capture A process by which CO 2 is extracted from flue gases <strong>for</strong> the purposes of sequestering the carbon rather than<br />
releasing into the atmosphere.<br />
Carbon Dioxide (CO 2 ) A colourless, odourless gas that is produced by respiration or the combustion and decomposition of carboncontaining<br />
materials. Carbon dioxide is essential to the photosynthesis process that sustains plant and animal life,<br />
however, it can accumulate in the air and trap heat near the Earth’s surface (the “greenhouse effect”).<br />
CCGT Combined Cycle Gas Turbine.<br />
CCS Carbon Capture and Storage, sometimes referred to as Carbon Capture and Sequestration.<br />
COMAH Control Of Major Accident Hazards. Major UK legislation governing chemical plants, refineries and power plants.<br />
Depleted Reservoir Refers to a hydrocarbon reservoir oil or gas that has had the economically recoverable hydrocarbon removed.<br />
HVDC High Voltage Direct Current. Means of connecting power stations to the national grid.<br />
EOR Enhanced Oil Recovery. In EOR fluids such as water and carbon dioxide are injected in to hydrocarbon reservoirs<br />
to enable the hydrocarbon to be extracted.<br />
EU-ETS European Union Emissions Trading Scheme. Process by which the allocation of carbon dioxide emission<br />
allowances <strong>for</strong> an emitter can be traded <strong>for</strong> users with excess allowable emissions to those with who require<br />
higher allowances.<br />
GHG Greenhouse Gas.<br />
H 2 S Hydrogen sulphide, a pungent gas produced when sulphur containing material such as coal is burnt. The gas<br />
exists in small volumes in flue gases from combustion processes.<br />
IEA GHG International Energy Agency Greenhouse Gas Programme.<br />
IGCC Integrated Combined Cycle. A pre-combustion process <strong>for</strong> the use of coal <strong>for</strong> power generation encompassing<br />
carbon capture.<br />
IPCC Intergovernmental Panel on Climate Change.<br />
kWh Kilo Watt Hour.<br />
NOx The group of chemicals nitrogen oxides including nitrogen dioxide, common contaminant found in flue gases of<br />
combustions processes.<br />
OEM Operational Engineering Manager.<br />
Carbon Capture and Storage Network<br />
OSPAR Oslo Paris Convention. 1992 agreement guiding international co-operation on the protection of the marine<br />
environment of the north east Atlantic.<br />
Post-Combustion Capture A system <strong>for</strong> CO 2 capture from a fossil fuel conversion/combustion where the fuel is combusted in air<br />
and resulting CO 2 is scrubbed, absorbed, or otherwise captured from the flue gas, which is primarily CO 2<br />
and nitrogen.
Pre-Combustion Capture A system <strong>for</strong> CO 2 capture from a fossil fuel conversion where the fuel is decarbonised via gasification, pyrolysis,<br />
or re<strong>for</strong>ming prior to combustion. The synthesis gas from de-carbonatisation is primarily a mixture of CO 2 and<br />
hydrogen. The CO 2 is captured from the hydrogen be<strong>for</strong>e the hydrogen is combusted.<br />
PSR Pipeline Safety Regulations.<br />
Reservoir A subsurface, porous, permeable rock body surrounded by impermeable rock and containing oil, gas, or water.<br />
Most reservoir rocks consist individually or collectively of limestone, dolomites, or sandstone.<br />
Saline Also referred to as Brine. A solution of water and sodium chloride, common salt, other metal salts may also be<br />
present. Saline/brine requires extensive desalination treatment be<strong>for</strong>e it could be consumed as drinking water.<br />
Saline Aquifer Geologic <strong>for</strong>mation of porous rock that is filled with saline/brine.<br />
Carbon Capture and Storage Network 45<br />
SOx The group of chemicals sulphur oxides including sulphur dioxide, sulphur trioxide, common contaminants found<br />
in flue gases from sulphur bearing fuels.<br />
Stern Review Titled “The Economics of Climate Change”, the Stern Review, commissioned by the UK Government and led<br />
by renown economists Sir Nicholas Stern. The report examined the economic impact of climate change based<br />
on projections up to 2006, predicting cost of predicted changes to the global economy in addition to cost<br />
comparisons <strong>for</strong> abatement options.<br />
ZEP Zero Emissions Plat<strong>for</strong>m. EU programme to enable European fossil fuel power plants to have zero CO 2 emissions<br />
by 2020.
46<br />
1. STERN REVIEW: The Economics of Climate Change www.<br />
sternreview.org.uk. HM Treasury 30 Oct 2006<br />
2. Report on Infrastructure, Availability and Costs <strong>for</strong> CO2<br />
Transportation and Storage Offshore – Southern North Sea, East<br />
of England Energy Group (EEEGR), Feb 2006<br />
3. An assessment of carbon sequestration potential in the UK<br />
– Southern North Sea case study. By Michelle Bentham, Tyndall<br />
Centre <strong>for</strong> Climate Change Research and British Geological<br />
Survey. Tyndall Centre Working Paper No. 85, January 2006<br />
4. Storing CO2 under the North Sea Basin, A key solution <strong>for</strong><br />
combating climate change. A report by the North Sea Basin Task<br />
Force, June 2007. By the Norwegian Ministry of Petroleum and<br />
Energy and the UK Department of Trade and Industry, June 2007<br />
5. Development of a CO2 transport and storage <strong>network</strong> in the<br />
North Sea. A report to the North Sea Basin Task Force. In<br />
association with Element Energy Limited, Pöyry Energy, British<br />
Geological Survey, UK Department <strong>for</strong> Business Enterprise &<br />
Regulatory Re<strong>for</strong>m, November 2007<br />
6. IPCC Specail Report on carbon dioxide Capture and Storage,<br />
IPCC, Cambridge University Press, Cambridge, 2005<br />
7. 4th Assessment Report: Climate Change 2007, IPCC,<br />
Cambridge University Press, 2007<br />
8. http://www.encoreoil.co.uk/pages/news/index<br />
asp?NewsID=107<br />
Carbon Capture and Storage Network<br />
REFERENCES & APPENDICES<br />
9. EU research on use of hydrogen, quote from press release<br />
and HyWays report<br />
http://ec.europa.eu/research/energy/nn/nn_pu/hyways/<br />
article_0001_en.htm and at http://www.hyways.de/<br />
10. Vattenfall AS at http://www.vattenfall.com/www/ccc/ccc/<br />
569876nextx/573533globa/index.jsp and in McKinsey<br />
Quarterly 2007 No1. mckinseyquarterly.com<br />
11. Shell scenarios 2005 at www.shell.com and presentation at the<br />
Society of Petroleum Engineers in London, January 2008<br />
12. http://www.encoreoil.co.uk/pages/news/index.<br />
asp?NewsID=107<br />
13. Meeting the Energy Challenge – A white paper on energy – DTI<br />
– May 2007<br />
14. Feasibility Study on the distributed collection and transmission<br />
of CO2 – Gastec at Cre – Oct 2006<br />
15. The EU flagship programme – ZEP – Oct 2007<br />
16. Capturing CO2 – IEA Greenhouse gas R & D programme –<br />
May 07<br />
17. Dynamis CO2 Qulaity recommendations, de Visser, E et al.<br />
Ecofys, Dynamis Consortium 2006-2009, 2008
APPENDICES<br />
Appendix A<br />
Regional map<br />
Carbon Capture and Storage Network 47
48<br />
Appendix B<br />
Study<br />
ID No.<br />
NAp<br />
ID<br />
Operator<br />
Name<br />
1 328 Drax Power Ltd Drax Power Station<br />
PO Box 3<br />
Selby<br />
North Yorkshire<br />
YO8 8PQ<br />
Installation Address EU-ETS<br />
Sector<br />
2 332 British Energy Eggborough Power Station<br />
Eggborough<br />
Goole<br />
East Yorkshire<br />
DN14 0BS<br />
3 1 Corus UK Ltd Scunthorpe Integrated Iron &<br />
Steel Works<br />
Scunthorpe Works<br />
PO Box 1<br />
Brigg Road<br />
Scunthorpe<br />
North Lincolnshire<br />
DN16 1BP<br />
4 325 Scottish and Southern<br />
Energy Ltd<br />
Ferrybridge “C” Power<br />
Station<br />
P.O Box 39<br />
Stranglands Lane<br />
Knottingley<br />
West Yorkshire<br />
WF11 8SQ<br />
5 369 International Power Saltend Cogeneration<br />
Company Limited<br />
Saltend<br />
Hedon Road<br />
Hull HU12 8GA<br />
6 348 CENTRICA SHB Ltd Centrica SHB Ltd<br />
South Humber Bank<br />
Power Station<br />
SOUTH MARSH ROAD<br />
STALLINGBOROUGH<br />
NORTH EAST<br />
LINCOLNSHIRE<br />
DN41 8BZ<br />
7 2254 Immingham CHP<br />
Limited Liability<br />
Partnership<br />
Immingham CHP Power<br />
Station<br />
Immingham CHP<br />
Immingham CHP<br />
Rosper Road<br />
Immingham<br />
North Lincolnshire<br />
DN40 3DZ<br />
8 4077 ConocoPhillips Limited Humber Refinery<br />
Eastfield Road<br />
South Killingholme<br />
IMMINGHAM<br />
North Lincolnshire<br />
DN40 3DW<br />
9 360 E.ON UK plc Killingholme power station<br />
Killingholme power station<br />
PO Box 11<br />
Immingham<br />
Grimsby<br />
NE Lincolnshire<br />
DN40 3NG<br />
10 2960 Total UK Limited Lindsey Oil Refinery<br />
Eastfield Road<br />
North Killingholme<br />
Immingham<br />
North Lincolnshire<br />
DN40 3LW<br />
11 357 Scottish and Southern<br />
Energy Ltd<br />
Carbon Capture and Storage Network<br />
Keadby Power Station<br />
Keadby Power Station<br />
Trentside<br />
Keadby<br />
Scunthorpe<br />
North Lincolnshire<br />
DN17 3EF<br />
Large Electricity<br />
Producers<br />
Large Electricity<br />
Producers<br />
Tier 0<br />
tpa<br />
Tier 1<br />
tpa<br />
Tier 2<br />
tpa<br />
>1M 50k - 1M
Appendix B<br />
Study<br />
ID No.<br />
NAp<br />
ID<br />
Operator<br />
Name<br />
12 358 Centrica Generation<br />
Limited<br />
Installation Address EU-ETS<br />
Sector<br />
Centrica Energy Killingholme<br />
Power Station<br />
Chase Hill Road<br />
North Killingholme<br />
Immingham<br />
North Lincolnshire<br />
Dn40 3eh<br />
101 366 Centrica Brigg Ltd Glan<strong>for</strong>d Brigg Generating<br />
Station<br />
Scawby Brook<br />
Brigg<br />
North Lincolnshire<br />
DN20 9LT<br />
102 640 CEMEX UK Cement<br />
Limited<br />
South Ferriby Works<br />
South Ferriby Cement Plant<br />
South Ferriby<br />
Barton-Upon-Humber<br />
North Lincolnshire<br />
DN18 6JL<br />
103 662 Singleton Birch Limited Melton Ross Limeworks<br />
Melton Ross Quarries<br />
Melton Ross Quarries<br />
Barnetby<br />
North Lincolnshire<br />
DN38 6AE<br />
104 93 Humber Energy Limited Humber Energy Limited<br />
Grimsby Power Station<br />
PO Box 24<br />
Great Coates<br />
Grimsby<br />
North East Lincolnshire<br />
DN31 2SS<br />
105 691 Redfearn Glass Ltd Redfearn Glass Ltd<br />
Burton Road<br />
Monk Bretton<br />
Barnsley<br />
South Yorkshire<br />
S71 2QG<br />
106 23 CORUS UK LIMITED CORUS ENGINEERING<br />
STEELS - ROTHERHAM<br />
ROTHERHAM WORKS<br />
ROTHERHAM WORKS<br />
PO BOX 5<br />
ALDWARKE LANE<br />
ROTHERHAM<br />
SOUTH YORKSHIRE<br />
S6O 1DW<br />
107 2454 Guardian Industries<br />
UK Ltd<br />
Guardian Industries UK Ltd<br />
Goole<br />
Rawcliffe Road<br />
Goole<br />
East Riding of Yorkshire<br />
DN14 8GA<br />
108 127 BP Chemicals Ltd BP Chemicals Ltd, Hull<br />
Saltend<br />
Hull<br />
East Yorkshire<br />
HU12 8DS<br />
109 2522 NPOWER COGEN<br />
LIMITED<br />
TIOXIDE GRIMSBY CHP<br />
PLANT<br />
HUNTSMAN TIOXIDE<br />
GRIMSBY<br />
MOODY LANE<br />
GRIMSBY<br />
NORTH EAST<br />
LINCOLNSHIRE<br />
DN31 2SW<br />
110 2788 Rockware Glass Rockware Glass - Wheatley<br />
Wheatley<br />
Rockware Glass<br />
Barnby Dunn Road<br />
Doncaster<br />
South Yorkshire<br />
DN2 4RH<br />
Carbon Capture and Storage Network 49<br />
Large Electricity<br />
Producers<br />
Large Electricity<br />
Producers<br />
Tier 0<br />
tpa<br />
Tier 1<br />
tpa<br />
Tier 2<br />
tpa<br />
>1M 50k - 1M
50<br />
Appendix B<br />
Study<br />
ID No.<br />
NAp<br />
ID<br />
Operator<br />
Name<br />
111 283 Millennium Inorganic<br />
Chemicals Ltd.<br />
112 249 E.ON UK Cogeneration<br />
Ltd<br />
113 2811 Saint-Gobain Glass<br />
UK Ltd.<br />
114 2748 E.ON UK Cogeneration<br />
Ltd<br />
Installation Address EU-ETS<br />
Sector<br />
CHP Plant<br />
Millennium Inorganic<br />
Chemicals Ltd.<br />
Laporte Road<br />
Stallingborough<br />
Grimsby<br />
NE Lincs<br />
DN40 2PR<br />
Thornhill power station<br />
Calder Road<br />
Ravensthorpe<br />
Dewsbury<br />
West Yorkshire<br />
WF12 9EA<br />
Saint-Gobain Glass UK Ltd.<br />
Eggborough Plant<br />
Weeland Road<br />
Eggborough<br />
East Riding of Yorkshire<br />
DN14 0FD<br />
Castle<strong>for</strong>d Power Station<br />
Castle<strong>for</strong>d Power Station<br />
Wheldon Road<br />
Castle<strong>for</strong>d<br />
West Yorkshire<br />
WF10 2JT<br />
115 2216 Centrica Storage Ltd Centrica Storage Ltd<br />
Easington Terminal<br />
Dimlington Road<br />
Easington, Nr. Hull<br />
East Yorkshire<br />
HU12 0SX<br />
116 2840 Viking UK Gas Limited Knapton Generating Station<br />
Knapton Generating Station<br />
Knapton Generating Station<br />
East Knapton<br />
Malton<br />
North Yorkshire<br />
YO17 8JF<br />
117 148 Ciba Specialty<br />
Chemicals Water<br />
Treatments Ltd<br />
Ciba Specialty Chemicals Ltd<br />
- Brad<strong>for</strong>d<br />
Brad<strong>for</strong>d<br />
P. O. Box 38<br />
Low Moor<br />
Brad<strong>for</strong>d<br />
West Yorkshire<br />
BD12 OJZ<br />
118 703 Rockware Glass Rockware Glass - Headlands<br />
Headlands<br />
Headlands Lane<br />
Knottingley<br />
West Yorkshire<br />
WF11 0HP<br />
119 142 British Sugar Plc York Sugar Factory<br />
P.O. Box 17<br />
Boroughbridge Road<br />
York<br />
North Yorkshire<br />
YO26 6XF<br />
120 129 BP Exploration<br />
Operating Company Ltd<br />
Carbon Capture and Storage Network<br />
Dimlington-Easington Shore<br />
Terminal<br />
Dimlington-Easington Shore<br />
Terminal<br />
Easington<br />
Kingston upon Hull<br />
East Riding of Yorkshire<br />
HU12 0ST<br />
Tier 0<br />
tpa<br />
Tier 1<br />
tpa<br />
Tier 2<br />
tpa<br />
>1M 50k - 1M
Appendix B<br />
Study<br />
ID No.<br />
NAp<br />
ID<br />
Operator<br />
Name<br />
121 289 Syngenta Limited Syngenta Limited<br />
Huddersfield<br />
PO Box A38<br />
Leeds Road<br />
HUDDERSFIELD<br />
West Yorkshire<br />
HD2 1FF<br />
122 683 Allied Glass Containers<br />
Ltd<br />
Installation Address EU-ETS<br />
Sector<br />
Allied Glass Containers Ltd<br />
- Leeds<br />
Leeds Works<br />
South Accomodation Road<br />
Leeds<br />
West Yorkshire<br />
LS10 1NQ<br />
123 182 Georgia Pacific GB Ltd Oughtibridge Mill<br />
Georgia-Pacific GB Ltd,<br />
Oughtibridge Mill<br />
Main Road, Wharncliffeside,<br />
Oughtibridge<br />
SHEFFIELD<br />
South Yorkshire<br />
S35 0DN<br />
124 2614 Dalkia Utilities Services Leeds Infirmary Generating<br />
Station Complex<br />
Leeds Infirmary<br />
Clarendon Way<br />
Leeds<br />
West Yorkshire<br />
LS1 3EX<br />
125 8 The Monckton Coke and<br />
Chemical Company Ltd<br />
The Monckton Coke and<br />
Chemical Company Ltd<br />
Lundhil Lane<br />
Royston<br />
Barnsley<br />
South Yorkshire<br />
S71 4BE<br />
126 2831 Scottish Courage Ltd John Smith’s Brewery,<br />
Tadcaster<br />
The Brewery<br />
Tadcaster<br />
North Yorkshire<br />
LS24 9SA<br />
127 2381 Elyo UK Industrial Nestlé York CHP<br />
Nestlé York<br />
Nestle Rowntree<br />
61 Wigginton Road<br />
York<br />
YO1 1XY<br />
128 1642 Glazteknology (Glaztek)<br />
UK Limited<br />
129 2061 Outokumpu Stainless<br />
Ltd<br />
201 707 Hepworth Building<br />
Products Ltd<br />
Carbon Capture and Storage Network 51<br />
Harworth<br />
Snape Lane<br />
Harworth<br />
Doncaster<br />
South Yorkshire<br />
DN11 8NF<br />
SMACC Site<br />
Outokumpu Stainless Ltd<br />
(Formerly AvestaPolarit Ltd)<br />
PO Box 161<br />
Shepcote Lane<br />
Sheffield<br />
South Yorkshire<br />
S9 1TR<br />
Hazlehead<br />
Hepworth Building Products<br />
Ltd<br />
Hazlehead<br />
Crow Edge<br />
Sheffield<br />
South Yorkshire<br />
S36 4HG<br />
Tier 0<br />
tpa<br />
Tier 1<br />
tpa<br />
Tier 2<br />
tpa<br />
>1M 50k - 1M
52<br />
Appendix B<br />
Study<br />
ID No.<br />
NAp<br />
ID<br />
Operator<br />
Name<br />
Installation Address EU-ETS<br />
Sector<br />
202 705 Beatson Clark plc Beatson Clark plc -<br />
Rotherham<br />
Rotherham Container Glass<br />
Works<br />
Greasbrough Road<br />
Rotherham<br />
South Yorkshire<br />
S60 1TZ<br />
203 240 Novartis Grimsby Ltd Novartis Grimsby Ltd<br />
Novartis Grimsby Ltd<br />
Pyewipe<br />
Grimsby<br />
N E Lincolnshire<br />
DN31 2SR<br />
204 2781 Rigid Paper Limited Selby Paper Mill<br />
Rigid Paper Ltd<br />
Denison Road<br />
Selby<br />
North Yorkshire<br />
YO8 8DB<br />
205 702 Allied Glass Containers<br />
Ltd.<br />
Allied Glass Containers Ltd.<br />
- Knottingley<br />
Knottingley Works<br />
Fernley Green Road<br />
Knottingley<br />
West Yorkshire<br />
WF11 8DJ<br />
206 302 Nationa Grid Gas Plc Scunthorpe Compressor<br />
Station<br />
Butterwick Road<br />
Messingham<br />
Scunthorpe<br />
Lincolshire<br />
DN17 3PN<br />
207 2985 UK COAL Mining Ltd. Harworth Colliery<br />
Harworth Colliery<br />
Scrooby Road<br />
Bircotes, Harworth<br />
Doncaster<br />
South Yorkshire<br />
DN11 8AB<br />
208 157 Croda Chemicals<br />
Europe Ltd<br />
Croda Chemicals Europe<br />
- Hull<br />
Oak Road Site<br />
Oak Road<br />
Hull<br />
East Yorkshire<br />
209 2330 Mill Nurseries Ltd. Mill CHP<br />
Mill Nurseries<br />
Ottringham Road<br />
Keyingham<br />
Kingston-Upon-Hull<br />
East Yorkshire<br />
HU12 9RX<br />
210 3108 Tate & Lyle Industries<br />
Limited<br />
211 2747 E.ON UK Cogeneration<br />
Ltd<br />
Carbon Capture and Storage Network<br />
Tate & Lyle Citric Acid<br />
Selby<br />
Denison Road<br />
Selby<br />
North Yorkshire<br />
YO8 8EF<br />
Brad<strong>for</strong>d CHP plant (AH<br />
Marks)<br />
AH Marks<br />
Wyke<br />
Brad<strong>for</strong>d<br />
West Yorkshire<br />
BD12 9EJ<br />
Tier 0<br />
tpa<br />
Tier 1<br />
tpa<br />
Tier 2<br />
tpa<br />
>1M 50k - 1M
Appendix B<br />
Study<br />
ID No.<br />
NAp<br />
ID<br />
Operator<br />
Name<br />
212 720 Sandtoft Roof Tiles<br />
Limited<br />
Installation Address EU-ETS<br />
Sector<br />
Broomfleet Works<br />
Broomfleet Tileries<br />
Broomfleet Works<br />
Broomfleet, Brough<br />
East Yorkshire<br />
HU15 1RS<br />
213 3134 SSE Generation Ltd Wheldale Power Station<br />
Wheldale Green Energy Park<br />
Wheldon Road<br />
Castle<strong>for</strong>d<br />
West Yorkshire<br />
WF10 2RR<br />
214 2658 McCain Foods (GB) Ltd McCain Steam Boilers<br />
- Scarborough<br />
McCain Foods (GB) Ltd<br />
- Scarborough<br />
Havers Hill<br />
Eastfield<br />
Scarborough<br />
North Yorkshire<br />
YO11 3BS<br />
215 3478 Total Solutions For<br />
Industry (Power<br />
Resources 1) Limited<br />
216 3125 Warwick Energy<br />
Exploration and<br />
Production Limited<br />
Sonoco CHP Plant<br />
Sonoco Board Mills<br />
Dog Lane<br />
Stainland<br />
Halifax<br />
West Yorkshire<br />
HX4 9PY<br />
Caythorpe Generating Plant<br />
Caythorpe Wellsite<br />
Rudston<br />
Near Driffield<br />
East Yorkshire<br />
YO25 4JD<br />
217 5014 Aarhus United UK Ltd Aarhus United UK Ltd<br />
King George Dock<br />
Hull<br />
Yorkshire<br />
HU9 5PX<br />
218 2302 Degussa Knottingley Ltd Degussa Knottingley Ltd<br />
Common Lane<br />
Knottingley<br />
West <strong>yorkshire</strong><br />
WF11 8BN<br />
219 3175 E.ON UK CoGeneration<br />
Ltd<br />
St James Hospital CHP<br />
Plant (St. James University<br />
Hospital)<br />
St James University Hospital<br />
Beckett Street<br />
Leeds<br />
Yorkshire<br />
LS9 7TF<br />
220 5013 T G Power Limited Power House Complex<br />
RAF Fylngdales<br />
RAF Fylingdales<br />
Pickering<br />
North Yorkshire<br />
YO18 7NT<br />
221 690 Beatson Clark plc Beatson Clark plc - Barnsley<br />
Barnsley Container Glass<br />
Works<br />
Hoyle Mill Road<br />
Stairfoot<br />
Barnsley<br />
South Yorkshire<br />
S70 3EU<br />
222 2645 Hanson Clay Products<br />
Ltd.<br />
Carbon Capture and Storage Network 53<br />
Howley Park Factory<br />
Howley Park<br />
Quarry Lane<br />
Howley Park<br />
Dewsbury<br />
West Yorkshire<br />
WF12 7JJ<br />
Tier 0<br />
tpa<br />
Tier 1<br />
tpa<br />
Tier 2<br />
tpa<br />
>1M 50k - 1M
54<br />
Appendix B<br />
Study<br />
ID No.<br />
NAp<br />
ID<br />
Operator<br />
Name<br />
223 704 Stolzle Flaconnage<br />
Limited<br />
Installation Address EU-ETS<br />
Sector<br />
Stolzle Flaconnage Limited<br />
Weeland Road<br />
Knottingley<br />
West Yorkshire<br />
WF11 8AP<br />
224 753 Plasmor Limited Plasmor Limited<br />
Great Heck<br />
Green Lane<br />
Great Heck<br />
Goole<br />
East Yorkshire<br />
DN14 0BZ<br />
225 3480 SSE Generation Ltd Hedon Salads Burstwick<br />
Energy Centre<br />
Hedon Salads Burstwick<br />
Main Road<br />
Burstwick<br />
East Yorkshire<br />
HU12 9DZ<br />
226 709 Naylor Drainage Naylor Drainage<br />
Cawthorne<br />
Clough Green<br />
Cawthorne<br />
Barnsley<br />
South Yorkshire<br />
S75 4AD<br />
227 706 Carlton Main Brickworks<br />
Ltd<br />
Carlton Main Brickworks Ltd<br />
Grimethorpe<br />
Clay Burn Road<br />
Grimethorpe<br />
Barnsley<br />
South Yorkshire<br />
S72 7BG<br />
228 3223 Muntons plc Muntons plc<br />
Flamborough Maltings<br />
Jewison Lane<br />
Bridlington<br />
East Yorkshire<br />
YO15 1DY<br />
229 2187 Carlsberg UK Limited Joshua Tetley Brewery Leeds<br />
Hunslet Road<br />
PO Box<br />
Leeds<br />
West Yorkshire<br />
LS1 1QG<br />
230 3497 Sheffield Teaching<br />
Hospitals NHS Trust<br />
231 3498 Sheffield teaching<br />
Hospitals NHS Trust<br />
Carbon Capture and Storage Network<br />
Northern General Hospital<br />
- Boiler House<br />
Northern General Hospital<br />
Sheffield Teaching Hsopitals<br />
NHS Trust<br />
Herries Road<br />
Sheffield Teaching Hosp<br />
NHS<br />
South Yorkshire<br />
S5 7AU<br />
Royal Hallamshire Hospital<br />
Boiler House<br />
Sheffield Teaching Hospitals<br />
NHS Trust<br />
Glossop Road<br />
Sheffield Teaching Hosp<br />
NHS<br />
South Yorkshire<br />
S10 2JF<br />
232 759 Ibstock Brick Ltd. Ibstock Brick Ltd - Nostell<br />
Nostell Factory<br />
Ibstock Brick Ltd.<br />
Swine Lane, Nostell<br />
Wakefield<br />
West Yorkshire<br />
WF4 1QH<br />
Tier 0<br />
tpa<br />
Tier 1<br />
tpa<br />
Tier 2<br />
tpa<br />
>1M 50k - 1M
Appendix B<br />
Study<br />
ID No.<br />
NAp<br />
ID<br />
Operator<br />
Name<br />
233 155 Croda Chemicals<br />
International Ltd<br />
Installation Address EU-ETS<br />
Sector<br />
Croda Chemical Europe<br />
- Goole<br />
Rawcliffe Bridge<br />
Rawcliffe Bridge<br />
Station Road<br />
Goole<br />
East Yorkshire<br />
DN14 8PN<br />
234 8091 British Gypsum Ltd Sherburn Gypsum Works<br />
Sherburn<br />
Fenton Lane<br />
Sherburn In Elmet<br />
Nr Leeds<br />
Yorkshire<br />
LS25 6EZ<br />
235 2647 Hanson Clay Products<br />
Ltd.<br />
236 3547 DONCASTER<br />
& BASSETLAW<br />
HOSPITALS NHS<br />
TRUST<br />
Swillington Factory<br />
Swillington<br />
Wakefield Road<br />
Swillington<br />
Leeds<br />
West Yorkshire<br />
LS26 8BT<br />
Doncaster Royal Infirmary<br />
Boiler House<br />
Doncaster Royal Infirmary<br />
Armthorpe Road<br />
Doncaster<br />
South Yorkshire<br />
DN2 5LT<br />
237 2175 Cadbury Trebor Bassett Energy Centre - Sheffield<br />
Cadbury Trebor Bassett<br />
Sheffield<br />
PO Box 8<br />
Livesey Street<br />
Sheffield<br />
Yorkshire<br />
S6 2AP<br />
238 2646 Hanson Clay Products<br />
Ltd.<br />
Stairfoot Factory<br />
Stairfoot<br />
Wombwell Lane<br />
Stairfoot<br />
Barnsley<br />
South Yorkshire<br />
S70 3NS<br />
239 2709 P Garnett & Son Ltd P Garnett and Son Ltd<br />
Otley Paper Mill<br />
Mill Lane<br />
Wharfeside<br />
Otley<br />
West Yorkshire<br />
LS21 1QJ<br />
241 6027 Smith & Nephew<br />
Medical Ltd<br />
Smith & Nephew Medical Ltd<br />
PO Box 81<br />
Hessle Road<br />
Hull<br />
HU3 2BN<br />
242 8075 Hazlewood Grocery Ltd Selby Sauces and Pickles<br />
Greencore Grocery, Selby<br />
Barlby Road<br />
Selby<br />
North Yorkshire<br />
YO8 5BJ<br />
243 2377 Elyo UK Industrial Nestlé Halifax Boiler House<br />
Nestlé Halifax<br />
Nestlé Rowntree<br />
Albion Mills<br />
Halifax<br />
West Yorkshire<br />
HX3 9XT<br />
Carbon Capture and Storage Network 55<br />
Tier 0<br />
tpa<br />
Tier 1<br />
tpa<br />
Tier 2<br />
tpa<br />
>1M 50k - 1M
56<br />
Appendix B<br />
Study<br />
ID No.<br />
NAp<br />
ID<br />
Operator<br />
Name<br />
244 4036 Humber Growers Ltd Poolbank CHP<br />
Poolbank Salads<br />
(Humber VHB)<br />
Common Lane<br />
Welton<br />
Brough<br />
East Yorkshire<br />
HU15 1UT<br />
245 2557 John Roberts Holdings<br />
Ltd.<br />
246 38 Sheffield Forgemasters<br />
Engineering Limited<br />
Installation Address EU-ETS<br />
Sector<br />
Langcliffe Paper Mill<br />
Langcliffe<br />
Settle<br />
North Yorkshire<br />
BD24 9NX<br />
Sheffield Forgemasters Steel<br />
Melting Shop<br />
River Don Works<br />
P.O. Box 286<br />
Brightside Lane<br />
Sheffield<br />
South Yorkshire<br />
S9 2RW<br />
247 2258 Coors Brewers Limited Tower Brewery<br />
Coors Brewers Ltd<br />
Wetherby Road<br />
Tadcaster<br />
North Yorkshire<br />
LS24 9SD<br />
248 3549 Hull & East Yorkshire<br />
Hospitals NHS Trust<br />
249 2461 Hanson Building<br />
Products<br />
Hull & East Yorkshire<br />
Hospitals NHS Trust<br />
Castle Hill Hospital<br />
Castle Road<br />
Cottingham<br />
East Yorkshire<br />
HU16 5JQ<br />
Hanson Building Products<br />
- Calder Works<br />
Calder Works<br />
Lower Edge Road<br />
Elland<br />
West Yorkshire<br />
HZ5 9PY<br />
250 4027 Bardmilne Ltd University of York<br />
Heslington<br />
York<br />
North Yorkshire<br />
YO10 5DD<br />
251 8058 YORK HOSPITALS NHS<br />
TRUST<br />
252 3504 Barnsley Hospital NHS<br />
Foundation Trust<br />
YORK HOSPITAL<br />
BOILERHOUSE<br />
YORK HOSPITAL<br />
WIGGINTON ROAD<br />
YORK HOSPITAL<br />
NORTH YORKSHIRE<br />
YO31 8HE<br />
Barnsley Hospital NHS<br />
Foundation Trust<br />
Barnsley Hospital NHS<br />
Foundation Trust<br />
Gawber Road<br />
Barnsley<br />
South Yorkshire S75 2EP<br />
253 3035 Whiteley Ltd Whiteley Ltd<br />
Whiteley Ltd<br />
Pool Paper Mills<br />
Pool-in-Wharfedale<br />
West Yorkshire<br />
LS21 1RP<br />
254 3116 Dyson Industries Ltd Dyson Industries Limited<br />
- Totley<br />
Dyson Refractories,<br />
Totley Works<br />
Owler Bar<br />
Sheffield<br />
South Yorkshire<br />
S17 3BJ<br />
Carbon Capture and Storage Network<br />
Tier 0<br />
tpa<br />
Tier 1<br />
tpa<br />
Tier 2<br />
tpa<br />
>1M 50k - 1M
Appendix B<br />
Study<br />
ID No.<br />
NAp<br />
ID<br />
Operator<br />
Name<br />
Known proposed Future Emitters<br />
Carbon Capture and Storage Network 57<br />
Installation Address EU-ETS<br />
Sector<br />
Total <strong>for</strong> Tier<br />
Total included in Study<br />
Total Proposed Emitters<br />
in Study<br />
% of Region Total (not<br />
including future emitters)<br />
% of Study Area Total<br />
Tier 0<br />
tpa<br />
Tier 1<br />
tpa<br />
Tier 2<br />
tpa<br />
>1M 50k - 1M 1M<br />
ConocoPhillips Immingham IGCC 1,761,298<br />
EON Killingholme EON Killinghome IGCC Power Station 2,400,000<br />
Powerfuel Power Ltd Hatfield IGCC Power Station 4,800,000<br />
4173242<br />
2864681<br />
3164681<br />
6.17%<br />
4.23%<br />
1172533<br />
501618<br />
501618<br />
1.73%<br />
0.67%<br />
Tier 1<br />
tpa<br />
50k - 1M<br />
BP Bioethanol 300,000<br />
8,961,298 300,000<br />
Included in<br />
Study /Notes<br />
67615953<br />
74597775<br />
74676810<br />
Tier 2<br />
tpa<br />
58<br />
Disclaimer<br />
The in<strong>for</strong>mation, analysis, scenario and<br />
discussion within this report are the result<br />
of an independent review and report <strong>for</strong><br />
Yorkshire Forward. Whilst potential emitters<br />
and stakeholders have been engaged with<br />
the project the in<strong>for</strong>mation presented here<br />
does not represent any stakeholder’s policy<br />
towards carbon capture and storage in the<br />
Yorkshire and Humber region. Scenarios<br />
presented within are based on publicly<br />
available in<strong>for</strong>mation, stake holder and<br />
project discussions and should not be taken<br />
as stating or implying regional or a specific<br />
entity’s policy.<br />
Authors<br />
AMEC<br />
AMEC House<br />
Yarm Road<br />
Darlington<br />
County Durham DL1 4JN<br />
United Kingdom<br />
Telephone: +44(0)1325 744400<br />
Fax: +44(0)1325 744404<br />
Email: alastair.rennie@amec.com<br />
Website: www.amec.com<br />
Carbon Capture and Storage Network<br />
Acknowledgements<br />
The authors and Yorkshire Forward are<br />
grateful <strong>for</strong> the Steering Group inputs but<br />
any errors are our own.<br />
The steering group comprised:<br />
Mike Smith, Chairman, Yorkshire Forward<br />
Dr Stephen Brown, Project Manager,<br />
Yorkshire Forward<br />
Tim Hill, Eon UK<br />
John Mitchell, Scottish and Southern Energy<br />
Nigel Burdett, Drax Power Ltd<br />
Ishfaq Ahmed, Conoco Phillips<br />
Phillip Pearson, TUC<br />
Michael Gibbons, Powerfuel Power Ltd<br />
Chris Treadgold, Corus<br />
Stefan Cousquer, Hydrogen Energy<br />
Malcolm Stephenson, Shell<br />
Alastair Rennie, AMEC<br />
Important notice<br />
This report was prepared exclusively <strong>for</strong><br />
Yorkshire Forward by AMEC plc, (AMEC),<br />
Industrial division, Darlington. The quality<br />
of in<strong>for</strong>mation, conclusions and estimates<br />
contained herein is consistent with the level<br />
of ef<strong>for</strong>t involved in AMEC’s services and<br />
based on:<br />
i) in<strong>for</strong>mation available at the time of<br />
preparation,<br />
ii) data supplied by outside sources and<br />
iii) the assumptions, conditions and<br />
qualifications set <strong>for</strong>th in this report. This<br />
report is intended to be used by Yorkshire<br />
Forward and consortium partners only,<br />
subject to the terms and conditions of its<br />
contract with AMEC. Any other use of, or<br />
reliance on, this report by any third party is<br />
at that party’s sole risk.
CONtACt US<br />
If you want more in<strong>for</strong>mation about the<br />
carbon capture and storage <strong>network</strong><br />
<strong>for</strong> Yorkshire and Humber, contact our<br />
sustainable development team on<br />
0113 394 5672 or visit<br />
www.<strong>yorkshire</strong>-<strong>for</strong>ward.com<br />
Yorkshire Forward<br />
Victoria House<br />
2 Victoria Place<br />
Leeds LS11 5AE<br />
www.<strong>yorkshire</strong>-<strong>for</strong>ward.com<br />
Printed in the region on recycled paper (75% post consumer waste and totally chlorine-free (TCF)) 05_08 100203