A cArbon cApture And storAge network for yorkshire And humber
A cArbon cApture And storAge network for yorkshire And humber
A cArbon cApture And storAge network for yorkshire And humber

You also want an ePaper? Increase the reach of your titles
YUMPU automatically turns print PDFs into web optimized ePapers that Google loves.
1<br />
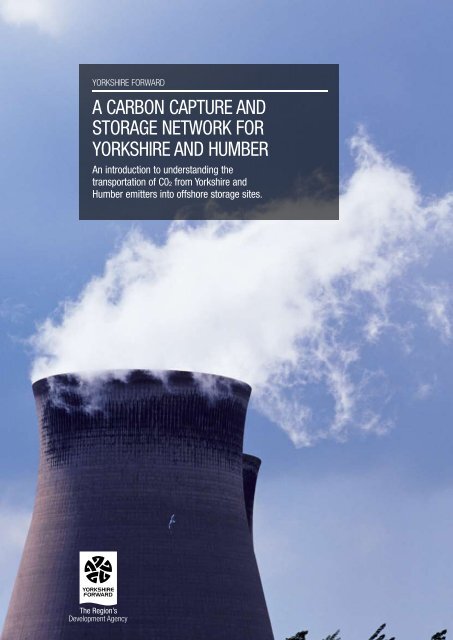
YORKSHIRE FORWARD<br />
A <strong>cArbon</strong> <strong>cApture</strong> <strong>And</strong><br />
<strong>storAge</strong> <strong>network</strong> <strong>for</strong><br />
<strong>yorkshire</strong> <strong>And</strong> <strong>humber</strong><br />
An introduction to understanding the<br />
transportation of c02 from <strong>yorkshire</strong> and<br />
<strong>humber</strong> emitters into offshore storage sites.
2<br />
CONTENTS<br />
Carbon Capture and Storage Network<br />
1.0 Non-technical summary 4<br />
2.0 Introduction 6<br />
3.0 Scope of works 8<br />
3.1 Introduction 8<br />
3.2 Study area 8<br />
3.3 Tiered sources 9<br />
3.3.1 Division by emitter flow 9<br />
3.3.2 Tier 0 sources 9<br />
3.3.3 Tier 1 sources 9<br />
3.3.4 Tier 2 sources 9<br />
3.3.5 Proportion of emissions 9<br />
3.4 Study period 11<br />
3.5 Hydrogen <strong>network</strong> 11<br />
3.6 EU Flagship Programme <strong>for</strong> CCS 11<br />
4.0 Yorkshire and Humber region emitters 12<br />
4.1 Introduction 12<br />
4.2 In<strong>for</strong>mation on Tier 0 emitters 12<br />
5.0 Carbon dioxide entry specification 14<br />
5.1 Introduction 14<br />
5.2 Possible impurities 14<br />
5.3 Properties of carbon dioxide 14<br />
5.4 Contamination issues 14<br />
5.5 Properties of carbon dioxide mixtures 14<br />
5.6 Technical impact 15<br />
5.7 Legislative requirements 16<br />
5.8 Offshore legislation 16<br />
5.9 Typical stream compositions post capture 16<br />
5.10 Water content 18<br />
5.11 Safety impacts 19<br />
5.12 Project specification 19<br />
6.0 Onshore and <strong>network</strong> design 20<br />
6.1 Network and scenario definitions 20<br />
6.2 Network 20<br />
6.2.1 Primary factors <strong>for</strong> pipeline route selection 20<br />
6.2.2 Design assumptions 20<br />
6.2.3 Operating philosophy 20<br />
6.2.4 Design life 20<br />
6.2.5 Metering 21<br />
6.2.6 Corrosion protection 21<br />
6.2.7 Network phasing 21<br />
6.2.8 Network design tool 21<br />
6.3 Area analysis 21<br />
6.3.1 General description 21<br />
6.3.2 Area restrictions 21<br />
6.4 Network <strong>for</strong>mation 22<br />
6.4.1 Ring main 22<br />
6.4.2 Tree/distributed structure 22<br />
6.5 Selection of export terminal location 23<br />
7.0 Offshore routes and storage 24<br />
7.1 Storage options 24<br />
7.2 Data sources 24<br />
7.3 Alternate storage and competing uses<br />
<strong>for</strong> depleted gas fields 24<br />
7.4 Co-ordination of decommissioning and<br />
re-use of existing assets 24<br />
7.5 Injection pressure 25<br />
7.6 Saline aquifers 25<br />
7.7 Gas field selection 25<br />
7.7.1 Availability timeline 25<br />
7.7.2 Distance selection 25<br />
7.7.3 Injectivity 25<br />
7.7.4 Decommissioning of gas fields in the study period 25<br />
7.8 Pipeline routes 28<br />
7.9 Summary of core routes 29<br />
7.10 Offshore route choice 29<br />
7.11 Decommissioning of offshore pipelines 29
8.0 Deployment scenarios 30<br />
8.1 Development of the <strong>network</strong> 30<br />
8.2 Central scenario 30<br />
8.2.1 Scenario concept 30<br />
8.3 Low growth scenario 31<br />
8.3.1 Scenario concept 31<br />
8.4 High scenario 32<br />
8.4.1 Scenario concept 32<br />
8.5 Stand-alone comparison 32<br />
8.6 Scenario quantities 32<br />
9.0 Economics 34<br />
9.1 Introduction 34<br />
9.2 Cost benefit analysis 34<br />
9.3 Uncertainty in inputs 34<br />
9.4 Discount rate 35<br />
9.5 Method and interpretation of cost calculations 36<br />
9.6 Results 37<br />
10.0 Conclusion 40<br />
11.0 Recommendations 42<br />
11.1 Government 42<br />
11.2 Economic work 42<br />
11.3 Technical 43<br />
11.4 Carbon 43<br />
11.5 Social 43<br />
11.6 Safety 43<br />
12.0 Glossary 44<br />
References & appendices 46<br />
Appendix a 47<br />
Appendix b 48<br />
Tables<br />
Table 3.1 Definition of Tier emitter classifications 9<br />
Table 5.1 Coal fired plant post comb capture 18<br />
Table 5.2 Coal fired plant IGCC 18<br />
Table 5.3 Coal fired plant oxy fuel 18<br />
Table 5.4 Weyburn / Dakota gasification plant<br />
entry specification 18<br />
Table 5.5 Dynamis SP3 recommended<br />
entry specification 19<br />
Table 5.6 Recommended entry specification 19<br />
Table 7.1 Potential storage sites – gas field 27<br />
Carbon Capture and Storage Network 3<br />
Table 7.2 Potential storage sites – saline aquifer 27<br />
Table 7.3 Summary of core routes 29<br />
Table 8.1 Cumulative carbon dioxide stored<br />
<strong>for</strong> scenarios 33<br />
Table 9.1 Cumulative capital cost 38<br />
Table 9.2 Cumulative CO2 carbon dioxide stored 38<br />
Table 9.3 Cumulative average cost £/tonne 39<br />
table 9.4 Cumulative average cost £/tonne best<br />
standalone comparison 39<br />
Figures<br />
Figure 1.1 Schematic of possible CCS systems 5<br />
Figure 1.2 Emitters and storage possibilities<br />
in the Humber 5<br />
Figure 2.1 Global emission scenarios 7<br />
Figure 3.1 General study area 8<br />
Figure 3.2 Study area with Tier 0 emitters<br />
and existing gas terminals 8<br />
Figure 3.3 Emitter locations in study area 10<br />
Figure 3.4 Proportion of emissions 10<br />
Figure 4.1 Carbon capture systems 13<br />
Figure 4.2 Predicted operating costs <strong>for</strong><br />
power station technologies 13<br />
Figure 5.1 Carbon dioxide phase diagram 15<br />
Figure 5.2 Property deviations <strong>for</strong> carbon dioxide<br />
– nitrogen 16<br />
Figure 5.3 Variation in critical parameters<br />
<strong>for</strong> carbon dioxide – nitrogen 17<br />
Figure 5.4 Phase envelope changes with increasing impurity 17<br />
Figure 6.1 Example of phased <strong>network</strong> pipelines 21<br />
Figure 6.2 Pipeline route congestion point – Hull<br />
– Beverley gap 22<br />
Figure 6.3 Pipeline route congestion point<br />
– Trent crossing 22<br />
Figure 6.4 Schematic example of a ring main <strong>network</strong> 23<br />
Figure 6.5 Schematic example of a tree<br />
structure <strong>network</strong> 23<br />
Figure 7.1 Overview of UK oil and gas fields<br />
including the Utsira aquifer 26<br />
Figure 8.1 General <strong>network</strong> route showing<br />
alternative offshore routes 30<br />
Figure 8.2 Stored carbon dioxide per year <strong>for</strong> scenarios 33
4 Carbon Capture and Storage Network<br />
1.0 NON-TECHNICAL SUMMARY<br />
Climate change is a reality that we now have<br />
to face. Over the last century emissions into<br />
the atmosphere of greenhouse gases has<br />
risen exponentially and now threatens to<br />
fundamentally change the world in which<br />
we live. It is now accepted that this<br />
increased growth must be stopped by<br />
controlling our energy needs and developing<br />
new industrial processes and ways of<br />
generating power that emit far less of these<br />
harmful gases. The single largest contributor<br />
to this change is the level of atmospheric<br />
carbon dioxide (CO2) from use of fossil fuels.<br />
It is this gas that is the focus of a global<br />
ef<strong>for</strong>t to reduce emissions.<br />
The challenge <strong>for</strong> policymakers and<br />
industry is to accelerate deployment of<br />
capture technology and developing the<br />
necessary transportation and storage<br />
infrastructure. Key to this acceleration is in<br />
understanding the technical and economical<br />
issues of developing infrastructure, and<br />
the timeframes involved, in order to allow<br />
investment decisions to be made.<br />
The Yorkshire and Humber region produces<br />
around 90mt of CO2 emissions annually, the<br />
majority from single point industrial or power<br />
generation sources. The region also has a<br />
coastline adjacent to the rapidly depleting<br />
gas reservoirs of the southern North Sea.<br />
This unique coincidence of high levels of<br />
CO2 emissions and proximity to storage<br />
sites means that the development of a low<br />
cost CO2 transport <strong>network</strong> would position<br />
the region to be the first and potentially<br />
lowest cost user of these depleting gas<br />
fields <strong>for</strong> carbon storage.<br />
Carbon capture and storage (CCS) is<br />
one approach that is considered by the<br />
Stern Review as essential to provide a<br />
lower carbon future. Fitted first to large<br />
point sources of CO2, CCS will allow the<br />
continued use of fossil fuels through carbon<br />
abatement, until replacement low carbon<br />
processes can come to maturity. There<strong>for</strong>e<br />
CCS is an essential requirement to combat<br />
climate change whilst maintaining security of<br />
energy supply.<br />
It is important to understand how CCS<br />
works and the elements involved. It begins<br />
when CO2 is produced by an industrial<br />
process such as burning coal or natural<br />
gas. The CO2 produced is first separated,<br />
then normally compressed into a liquid<br />
and transported by pipeline to a suitable<br />
storage or sequestration site where the CO2<br />
can be permanently stored. The transport<br />
system encompasses compressors,<br />
pumps, onshore and an offshore pipeline<br />
to deliver the CO2 to the storage site. This<br />
study considers the provision of a transport<br />
system <strong>for</strong> the Yorkshire and Humber<br />
region, illustrated by the sections show<br />
in blue in figure 1.1.<br />
This work was commissioned under the<br />
auspices of the Carbon Capture and<br />
Storage Partnership <strong>for</strong> Yorkshire and<br />
Humber. This is a stakeholder group<br />
convened by Yorkshire Forward to stimulate<br />
the development of a CCS <strong>network</strong> in<br />
the region. The study was managed by a<br />
steering group led by Yorkshire Forward with<br />
contributions from steering group members.<br />
The study aimed to understand the options<br />
<strong>for</strong> the most economic <strong>network</strong> <strong>for</strong> transport<br />
of CO2 to storage from the emitters in the<br />
region, based mostly on publicly available<br />
data. The area of concern is essentially a<br />
rectangle, bound by the coast in the east<br />
and Castle<strong>for</strong>d in the west. The northern<br />
boundary to the study area is taken as a<br />
line across the southern edge of Beverley<br />
whilst the southern boundary by a line from<br />
the southern edge of Scunthorpe, see figure<br />
1.2. Contained within this area are 12 large<br />
emitters plus 10 medium and 14 small<br />
emitters. The large emitters alone represent<br />
over 60 million tonnes of CO2 emissions a<br />
year, approximately 10% of the total CO2<br />
emissions <strong>for</strong> the UK.<br />
The report uses scenarios covering all<br />
currently <strong>for</strong>eseen stationary emitters of over<br />
5 thousand tonnes CO2/year, and capturing<br />
between 33% and 73% of emissions by<br />
2030. The study shows that there is storage<br />
available under all scenarios <strong>for</strong> these<br />
emissions out to at least 2050.<br />
To address the health, safety and<br />
environmental questions regarding CO2<br />
transport this study has allowed <strong>for</strong> the<br />
maximum use of existing infrastructure,<br />
however further discussions will be required<br />
with the Health and Safety Executive and<br />
other stakeholders to ensure consent <strong>for</strong><br />
any new infrastructure. It is <strong>for</strong>tunate that<br />
the area already has much larger and more<br />
complex industrial activities which the local<br />
community and work <strong>for</strong>ce has experience<br />
of and can use <strong>for</strong> comparison when<br />
considering this new infrastructure.<br />
The study shows that with an appropriate<br />
level of industrial co-operation including the<br />
re-use of suitable existing infrastructure,<br />
a transport <strong>network</strong> can be initiated at<br />
reasonable cost using existing pipelines to<br />
complement the need <strong>for</strong> new infrastructure.<br />
Furthermore, continuing R&D on CCS<br />
processes should also enable a reduction<br />
in costs.<br />
Currently each carbon capture project has<br />
to develop its own transport and storage<br />
solution. Earlier studies have assumed that<br />
CO2 transport <strong>network</strong>s would develop<br />
as a matter of course. In reality strategic<br />
leadership will be required to bring them<br />
to fruition.<br />
On a like <strong>for</strong> like basis, and with the support<br />
of public and private bodies to initiate a<br />
<strong>network</strong> in Yorkshire and Humber, this<br />
study shows that <strong>for</strong> every emitter<br />
linking into a <strong>network</strong> is more cost<br />
effective than a stand-alone solution.<br />
Even <strong>for</strong> the ideally located emitter with ideal<br />
emissions profile, entering a <strong>network</strong> is the<br />
cheapest option and other emitters, both<br />
large and small, have higher CO2 transport<br />
costs in the absence of a <strong>network</strong>.<br />
This study assumes that the current level<br />
of industrial activity will continue. However,<br />
a viable CO2 transport <strong>network</strong> could also<br />
attract new economic activity attracting<br />
companies seeking a system <strong>for</strong> safe and<br />
cost effective CO2 transport and storage.<br />
By 2030 CO2 capture and storage using<br />
this <strong>network</strong> could be adding about £1.2bn<br />
per year of economic activity to the region<br />
through EU-ETS credits alone.<br />
If the transport <strong>network</strong> was constructed in<br />
2008 the total investment described in this<br />
study has a cost of approximately £2 billion.<br />
This excludes the investment in capture<br />
plant at the emission source and the<br />
storage site facilities, which are not within<br />
the scope of this transport study.<br />
The system described in this study could<br />
transport approximately 320 million tonnes<br />
of CO2 in total up to 2030, 850 million<br />
tonnes in total by 2040, and may store<br />
1,500 million tonnes of CO2 by 2050. To<br />
give a sense of scale 1,500 million tonnes<br />
is equivalent to the emissions from all the<br />
present cars in the UK <strong>for</strong> 75 years.<br />
For the central scenario used in this<br />
study the average present cost is<br />
approximately £1.70 per tonne <strong>for</strong> all<br />
the CO2 transported by 2040, depending<br />
on the assumptions used.
This study presents a cost, as opposed<br />
to a revenue model. There<strong>for</strong>e, it is not<br />
linked to the European Emissions Trading<br />
Scheme price of CO2 or financing of the<br />
investment in the transport infrastructure.<br />
In addition the commercial rate paid by<br />
an emitter will depend on how quickly<br />
the <strong>network</strong> grows and how ownership<br />
of the <strong>network</strong> is managed. Of particular<br />
importance is the financial cost of the timing<br />
difference between expenditure in transport<br />
infrastructure and revenue from transporting<br />
CO2. For example an early plant unable<br />
to share a transport pipeline and linked to<br />
one store will have high costs, but strategic<br />
coordination of capture plant, pipelines and<br />
equipment with shared offshore storage will<br />
reduce costs.<br />
The ability to develop a cluster of large<br />
capture sites and suitable storage<br />
sites will be the key to a successful<br />
<strong>network</strong>. Depleted gas reservoirs must<br />
be decommissioned to be available <strong>for</strong><br />
use as CO2 storage sites. The study area<br />
compactly offers a timely combination of<br />
these opportunities as shown in figure 1.2.<br />
The study recommends that Yorkshire<br />
Forward and other regional bodies promote<br />
the development of a cluster of carbon<br />
capture ready industrial sites to be an early<br />
material action to justify investment in an<br />
efficient CO2 transport and storage system,<br />
driven by the co-operation by the capture<br />
site organisations and regional bodies.<br />
The UK government clarifies a process <strong>for</strong><br />
funding support through an appropriate<br />
mechanism to facilitate investment in this<br />
clustered approach to CCS deployment.<br />
<strong>And</strong> that Yorkshire Forward commissions<br />
a cost benefit analysis to understand the<br />
wider economic, social and environmental<br />
enhancements that would arise from a<br />
region wide CCS <strong>network</strong>.<br />
In conclusion this study has evolved the<br />
work of the North Sea Basin Task Force by<br />
focusing on a key region by considering in<br />
some detail the CO2 transport component<br />
of a regional CCS <strong>network</strong>. The study<br />
provides realistic costs <strong>for</strong> consideration by<br />
government, regional bodies and industry<br />
when planning <strong>for</strong> the strategic options to<br />
significantly reduce CO2 emissions in the UK<br />
through the development of carbon capture<br />
and storage.<br />
Carbon Capture and Storage Network 5<br />
Figure 1.1 Schematic of possible CCS systems<br />
Reproduced courtesy of the IPCC from IPCC Special Report on<br />
carbon dioxide capture and storage, page 4 Fig SPM.1<br />
Figure 1.2 Emitters and storage possibilities in the Humber
6<br />
2.0 INTRODUCTION<br />
Removal of CO2 from flue gases in<br />
power stations or other large single point<br />
emitters and storing it underground is<br />
potentially one of the most cost effective<br />
methods of tackling climate change.<br />
The UK government is keen to develop and<br />
deploy CCS, and the study area represents<br />
the largest cluster of CO2 sources in the<br />
UK. The UK also has an abundance of<br />
underground storage possibilities in the<br />
<strong>for</strong>m of depleted North Sea oil and gas<br />
fields, saline aquifers, salt caverns and<br />
disused coal mines.<br />
The Energy White Paper of 2007 [13]<br />
highlights two major challenges <strong>for</strong> the<br />
UK; tackling CO2 emissions and the<br />
maintenance of secure and af<strong>for</strong>dable<br />
energy supplies. The deployment of CCS is<br />
one approach of addressing both challenges<br />
and the White Paper makes the case <strong>for</strong><br />
CCS, particularly in conjunction with cleaner<br />
coal power generation. Coal still offers an<br />
abundance of relatively cheap, reliable<br />
energy that can be sourced from UK and,<br />
is likely to remain one of the UK’s main<br />
sources of power generation <strong>for</strong> at least<br />
the next 25 years.<br />
Carbon Capture and Storage Network<br />
The Stern Review [1] investigated the<br />
impact of climate change on the world’s<br />
economy. It highlighted that carbon capture<br />
and storage has a role in the medium term,<br />
whilst alternative energies and industrial<br />
processes are given time to develop and<br />
mature. To prevent the consequences<br />
mentioned in the Stern Review and detailed<br />
by the IPCC [6], levels of CO2 must peak in<br />
the near future with concentrations of CO2<br />
stabilising between 440ppm and 550ppm.<br />
Figure 2.1 opposite identifies possible<br />
scenarios on global CO2 emissions. CCS<br />
has the potential to contribute up to 55% of<br />
the CO2 mitigations required to ensure that<br />
emissions peak early.<br />
Government legislation could drive this<br />
market; however, global CCS deployment<br />
necessitates a stable, global price <strong>for</strong><br />
carbon, above the costs required <strong>for</strong> this<br />
technology, to ensure a reasonable rate of<br />
return. Applications of CCS to China and<br />
India’s coal powered plants are crucial to<br />
ensure that global emissions peak as shown<br />
in the graph.<br />
Current methods of extraction can remove<br />
around 90% of the CO2 from flue gases;<br />
however this then must be cleaned, dried<br />
and compressed <strong>for</strong> transportation via<br />
pipeline to the storage locations. This report<br />
will examine the transportation issues and<br />
solutions, producing <strong>network</strong> designs to<br />
accommodate various scenarios envisaged,<br />
finally arriving at a cost <strong>for</strong> transportation<br />
of the CO2.<br />
This study arose from discussion between<br />
Yorkshire Forward and AMEC, and<br />
engagement with the major emitters in<br />
the Yorkshire and Humber area and some<br />
operators of southern North Sea gas fields,<br />
unions, and other interested parties.<br />
A meeting of the Carbon Capture and<br />
Storage Partnership <strong>for</strong> Yorkshire and<br />
Humber led to this work, funded by<br />
Yorkshire Forward with contributions from<br />
AMEC, ConocoPhillips, Corus, Drax Power<br />
Ltd, E.ON UK, Hydrogen Energy, Power<br />
Ltd, Scottish & Southern Energy plc, and<br />
Shell. A steering group to oversee the study<br />
comprised these organisations and the<br />
TUC. The steering group was chaired<br />
by Yorkshire Forward.<br />
The work builds on a previous study done<br />
<strong>for</strong> the International Energy Authority<br />
Greenhouse Gas R&D Programme (IEA<br />
GHG) which included discussion of a<br />
potential <strong>network</strong> <strong>for</strong> the Mersey-Dee area<br />
on the west coast [14]. The model used <strong>for</strong><br />
that study was used with kind permission of<br />
IEA GHG, with additional analysis. It differs<br />
by more economic analysis, doing stepwise<br />
development of the <strong>network</strong> through time<br />
under different growth scenarios, and<br />
multiple offshore storage constraints.
Figure 2.1 Global emission scenarios<br />
Global Emissions (GtCO2e)<br />
70<br />
60<br />
50<br />
40<br />
30<br />
20<br />
10<br />
Carbon Capture and Storage Network 7<br />
0<br />
2000 2020 2040 2060 2080 2100<br />
2015 High Peak – 1.0%/yr<br />
2020 High Peak – 2.5%/yr<br />
2030 High Peak – 4.0%/yr<br />
2040 High Peak – 4.5%/yr (overshoot)<br />
2020 Low Peak – 1.5%/yr<br />
2030 Low Peak – 2.5%/yr<br />
2040 Low Peak – 3.0%/yr
8 Carbon Capture and Storage Network<br />
3.0 SCOPE OF WORKS<br />
Yorkshire and Humber Region<br />
Figure 3.1 General study area<br />
Figure 3.2 Study area with Tier 0 emitters and existing gas terminals<br />
Study Area<br />
Motorways<br />
A Roads<br />
A/B Roads<br />
Railway<br />
Boundary<br />
Local<br />
Authority<br />
Boundary<br />
Docks<br />
Airport<br />
3.1 INTRODUCTION<br />
The scope of this project and subsequent<br />
report is summarised in three aims:<br />
• Develop the most economic <strong>network</strong> to<br />
transport available CO2 emissions from<br />
stationary emitters in the region from<br />
capture to permanent storage.<br />
• Provide CO2 emitters an effective route<br />
to storage that is on balance (cost, safety,<br />
environmental consenting, planning<br />
approvals, public perception, timely)<br />
more attractive to them than a<br />
standalone solution.<br />
• Create a <strong>network</strong> group to mutually in<strong>for</strong>m<br />
members, execute work including studies<br />
and public engagement and generate<br />
collective value that is jointly owned.<br />
As a first step to achieve these aims<br />
a number of tasks were undertaken:<br />
• Data collection <strong>for</strong> the region<br />
• Discussion with emitters and storage<br />
site owners<br />
• Evaluating storage solutions<br />
• D evelop a technical basis <strong>for</strong> gas quality<br />
entering the system<br />
• Develop <strong>network</strong> scenarios<br />
• Model and cost the <strong>network</strong>.<br />
3.2 STUDY AREA<br />
The area indicated in figure 3.2 represents<br />
the catchment area <strong>for</strong> the stationary<br />
emitters of CO2. This area falls within<br />
Yorkshire Forward’s boundaries and<br />
contains the main clusters of large emitters<br />
in the region. The area around Immingham<br />
and Grimsby has a high concentration of<br />
emitters in the <strong>for</strong>m of refineries, steelworks<br />
and power stations. Three large coal-fired<br />
power stations, located along the M62,<br />
are also captured in this study area. The<br />
steel plant at Scunthorpe also lies within<br />
the study area. The Humberside area,<br />
figure 3.1, is considered feasible <strong>for</strong> carbon<br />
capture and storage as it has a large<br />
amount of emitters located close to possible<br />
storage sites.
Table 3.1 Definition of Tier emitter classifications<br />
Figure 1.2 shows the location of the larger<br />
emitters (over 1mtCO2/year) in the study<br />
area. Large thermal power plants are<br />
indicated by red squares and blue dots,<br />
whilst the purple squares represent possible<br />
future projects. Non-energy producers<br />
of CO2 are shown in orange. Yellow dots<br />
shown indicate potential export points;<br />
both shown are Easington (northerly) and<br />
Theddlethorpe (southerly). Although the<br />
existing pipelines and gas export facilities<br />
will not be utilised, it was assumed that it<br />
would be easier to obtain planning consent<br />
if the proposed pipelines crossed the coast<br />
at the same point.<br />
3.3 TIERED SOURCES<br />
3.3.1 Division by emitter flow<br />
Emitters can be ranked by their allowances<br />
allocated under the EU-ETS. This allows<br />
the consideration of an area in terms of not<br />
only size of emitter but also the capability<br />
and economic ability of an emitter to join<br />
a transmission <strong>network</strong>. This methodology<br />
was previously used in a project <strong>for</strong> the<br />
International Energy Agency (IEA GHG)<br />
[14] to test a <strong>network</strong> design and costing<br />
programme. Table 3.1 shows the definitions<br />
applying to the classification of an emitter by<br />
size, and a detailed list of emitters can be<br />
found in Appendix B.<br />
Carbon Capture and Storage Network 9<br />
Tier Classification Emitter Size Emitter Range Typical Emitter Types<br />
(Generalisation) Tonnes CO2/year<br />
0 Large +1 million Coal fired power station<br />
Major hydrocarbon refinery<br />
Major steel works<br />
Large CCGT power station<br />
1 Medium 50,000 to 1 million Chemical, glass, food processors,<br />
large CHP & power stations<br />
CCGT power station<br />
2 Small 1,000 to 50,000 CHP units, hospitals,<br />
Varied Industrial process<br />
In considering a <strong>network</strong> and how emitters<br />
can connect to it a number of factors<br />
must be considered including the size of<br />
the emitter, the capacity to capture and<br />
transmit CO2, and the location of the site.<br />
Small emitters such as hospitals will not<br />
necessarily have the technical capability to<br />
operate complex compression equipment<br />
<strong>for</strong> example. By applying tiers to the<br />
emitters in any area a simple but coarse<br />
measure can be applied and some sources,<br />
even whole tiers can be discounted.<br />
It may be more appropriate <strong>for</strong> Tier 1 and<br />
2 sources to be part of a suction system,<br />
transmitting low pressure CO2 to a central<br />
collection point such as larger capable<br />
Tier 0 or Tier 1 sites.<br />
A map of the location of the emitters in<br />
the region is included in figure 3.1 and<br />
Appendix A.<br />
3.3.2 Tier 0 sources<br />
Sources with volumes of CO2 greater than<br />
1mt/year are categorized as Tier 0 sources.<br />
Sources of this magnitude in this area are<br />
power stations, refineries and steel works.<br />
Carbon capture and storage is most<br />
economical in Tier 0 sources due to large<br />
amounts of CO2 available <strong>for</strong> capture, as well<br />
as the availability of land at these sites <strong>for</strong><br />
extraction units. There are 12 such sources<br />
<strong>for</strong> this study.<br />
3.3.3 Tier 1 sources<br />
Sources with volumes of CO2 ranging from<br />
0.05mt/year to 1mt/year are categorized<br />
as Tier 1. These include power and CHP<br />
plants, chemical producers, cement & lime<br />
works, large food & drink producers and<br />
glassworks. Extraction and conditioning<br />
of CO2 from most of these sources is<br />
considered less economic and there is less<br />
drive to reduce CO2 emissions below Best<br />
Available Techniques (BAT).<br />
3.3.4 Tier 2 sources<br />
Those ranging from 1kt CO2/year to<br />
0.5mt CO2/year are Tier 2 sources.<br />
These smaller emitters include local small<br />
power generators, services, hospitals, food<br />
& drink manufacturers as well as small<br />
chemical producers. The relatively small<br />
amounts of CO2 produced at these sites<br />
make them uneconomic or unpractical<br />
<strong>for</strong> CCS, furthermore most are scattered<br />
throughout the area, or located in densely<br />
populated areas, making transportation<br />
of the gas problematic.<br />
3.3.5 proportion of emissions<br />
Emissions taken from the EU-ETS have<br />
resulted in the following proportions shown<br />
in the chart below. The current bulk of the<br />
emissions, 92%, are from Tier 0 sources<br />
and only 8% from combined Tier 1 and<br />
Tier 2 sources, figure 3.4a. Adding future<br />
proposed programmes changes this<br />
proportion to 95.4% <strong>for</strong> Tier 0, figure 3.4b.<br />
This suggests that the trunk line could be<br />
sized to accommodate the Tier 0 emitters,<br />
as there is little impact from smaller emitters<br />
joining the <strong>network</strong>.
10<br />
Figure 3.3 Emitter locations in study area<br />
A larger version of this drawing can be found in Appendix A<br />
Figure 3.4 Proportion of emissions<br />
Tier 1: 6.17%<br />
Tier 2: 1.73%<br />
Tier 0: 92.09%<br />
(a) Current proportions<br />
of emitters in study area<br />
Carbon Capture and Storage Network<br />
Tier 1: 4.23%<br />
Tier 2: 0.67%<br />
Tier 0: 95.10%<br />
(b) proportion of emitters<br />
in study area, including<br />
known future projects
3.4 STUDY pERIOD<br />
This report considers the development of<br />
a CCS <strong>network</strong> over the period of 2013 to<br />
2030. This study period was agreed upon<br />
by the steering group, based on a number<br />
of factors. These being:<br />
• Perceived lifetimes of new builds and<br />
existing emitters and the proposed<br />
timescale <strong>for</strong> new builds in the area.<br />
• The range of dates that coincide with the<br />
availability of depleted gas fields in the<br />
southern North Sea.<br />
• CO2 capture may become a broadly<br />
commercially attractive proposition during<br />
this period as, <strong>for</strong> example, the EU-ETS<br />
matures and CCS is demonstrated.<br />
• That the perceived impact from new<br />
technologies (such as nuclear fusion) has<br />
little effect on emissions in this area over<br />
the specified study period.<br />
3.5 HYDROGEN NETWORK<br />
The steering group wished to review<br />
the interaction of transport of CO2<br />
and hydrogen because of the possible<br />
production of the economic production of<br />
de-carbonised hydrogen in the context of<br />
developing CCS <strong>for</strong> other reasons.<br />
The production of hydrogen occurs during<br />
the capture of CO2 in the pre-combustion<br />
process, see figure 4.1, where CO2 is<br />
separated be<strong>for</strong>e hydrogen and air is used<br />
<strong>for</strong> power production. The hydrogen can<br />
be simply processed and piped rather than<br />
used immediately once it is produced.<br />
This enables large quantities to be made<br />
available <strong>for</strong> other users.<br />
Comparing the spending <strong>for</strong> hydrogen<br />
production, supply and vehicles with<br />
the savings to be gained from replacing<br />
conventional fuel and conventional vehicles<br />
over time, the simulations of the EU HyWays<br />
project [9] predict that the break-even point<br />
would be most likely reached between<br />
2025 and 2035. There are a wide range<br />
of applications <strong>for</strong> hydrogen; in 2030 there<br />
may be 16 million hydrogen cars and the<br />
Carbon Capture and Storage Network 11<br />
total cumulative investment <strong>for</strong> infrastructure<br />
build-up will amount to €60 billion. This<br />
report [9] states that “CCS technologies<br />
extends the time available to develop a full<br />
and durable solution <strong>for</strong> a sustainable power<br />
and fuel provision. The use of hydrogen<br />
in electricity production will broaden the<br />
sectors where such a carrier can be<br />
used in a sustainable way. It will provide<br />
the opportunity to utilise the advantages<br />
offered by hydrogen as demonstrated in the<br />
transport sector, enabling the power sector<br />
to diversify its feedstock’s with very low<br />
CO2 emissions.”<br />
There is another comment that <strong>for</strong> the<br />
UK besides production of hydrogen from<br />
natural gas, biomass and wind energy,<br />
nuclear energy was seen as an option as<br />
was the use of coal. The report showed<br />
that the production of hydrogen from fossil<br />
fuels using carbon capture and storage<br />
could make a significant contribution to<br />
reducing CO2 emissions. Furthermore, the<br />
introduction of hydrogen into the energy<br />
system offers the opportunity to increase<br />
the ratio of renewable energy, and help<br />
the large-scale introduction of intermittent<br />
resources such as wind energy through its<br />
use as a temporary energy storage option.<br />
De-carbonising the fuel is one solution to<br />
the mitigation of CO2 emissions. Sources<br />
of pure hydrogen are already located in<br />
the area in the <strong>for</strong>m of refineries and steel<br />
works. Steel works and refineries are also<br />
major hydrogen customers. There are a<br />
range of applications <strong>for</strong> hydrogen in other<br />
industrial processes but to date there is<br />
no reason to capture the CO2 by-product<br />
except <strong>for</strong> some relatively small uses.<br />
The advent of CCS opens the possibility<br />
of a new low carbon energy vector at a<br />
significant scale.<br />
Whilst the transport and domestic fuel<br />
sectors are longer term, the shorter term<br />
opportunity <strong>for</strong> CSS is its use in the power<br />
industry, to supply de-carbonised fuel to<br />
neighbouring CCGT’s and CHP plant via a<br />
local pipeline. There are fewer drivers <strong>for</strong><br />
extraction of CO2 from CCGT’s, <strong>for</strong> reasons<br />
covered in section 4.2, and many existing<br />
turbines will not be convertible to run purely<br />
on hydrogen. Replacing burners and utilising<br />
suitable gas turbines will enable a number<br />
of power stations to burn a percentage<br />
of piped hydrogen with natural gas, thus<br />
eliminating the need <strong>for</strong> a discrete carbon<br />
capture unit.<br />
Developing a wider hydrogen pipe system<br />
on the back of the CO2 <strong>network</strong> may be a<br />
cost effective development of these new<br />
market opportunities, and will gradually link<br />
to the “hydrogen highways” concepts which<br />
is suggested to extend north to Teesside.<br />
We have found it too early to be specific<br />
about the scale of a viable <strong>network</strong>, but<br />
recommend that the issues of a shared<br />
way-leave between CO2 and H2 pipes be<br />
understood and, <strong>for</strong> certain routes, wayleaves<br />
are designed with this option in mind.<br />
3.6 EU FLAGSHIp pROGRAMME<br />
FOR CCS<br />
To enable commercial deployment of CCS<br />
by 2020, the EU plans to partly fund 10 to<br />
12 full-scale CCS demonstration projects, all<br />
to be operational by 2015. To maximize the<br />
benefits of this scheme, the selection criteria<br />
will be based on:<br />
• Plant process and capture technology<br />
• Method of CO2 storage<br />
• Transport and communications<br />
infrastructure<br />
• Related public communications<br />
• Risk profile<br />
The scheme envisaged that 10 to 12 x<br />
400MW power plants would require a total<br />
funding of €6 to €10billion investment,<br />
based on a Capital Expenditure range of<br />
1500-2300€/kW [15]. This programme<br />
could provide funding <strong>for</strong> a ‘cluster’ of large<br />
emitters, initiating the Yorkshire and Humber<br />
CO2 <strong>network</strong>.
12<br />
4.0 YORKSHIRE AND HUMBER REGION EMITTERS<br />
4.1 INTRODUCTION<br />
Identification of CO2 emitters, planned and<br />
existing, was carried out in conjunction with<br />
Gastec at CRE Ltd. Emitters highlighted<br />
in the EU/UK ETS National Allocation Plan<br />
data as well as knowledge of proposed<br />
facilities through questionnaire response,<br />
and discussion with these organisations<br />
and desktop research, provided the basis<br />
<strong>for</strong> a detailed examination. Feasibility of<br />
each of the emitters joining the <strong>network</strong> will<br />
also effect the likely dates of entry into the<br />
<strong>network</strong>; this is considered in this section of<br />
the report.<br />
4.2 INFORMATION ON<br />
TIER 0 EMITTERS<br />
Feasibility of CCS <strong>for</strong> each of the emitters<br />
greatly depends on the process involved;<br />
there<strong>for</strong>e each will be categorised<br />
by process.<br />
• Existing coal fired power stations<br />
- Drax (Drax Power Ltd)<br />
- Eggborough (British Energy)<br />
- Ferrybridge “C” (Scottish and<br />
Southern Energy)<br />
• Potential IGCC schemes<br />
- Hatfield (Powerfuels Power Ltd)<br />
- Killingholme (E.ON UK)<br />
- ConcocoPhillips<br />
• Existing CCGT power stations/CHP<br />
- South Humber Bank (Centrica)<br />
- Killingholme (Centrica),<br />
- Killingholme (E.ON UK),<br />
- Immingham CHP (phase 1)<br />
- Keadby (Scottish and Southern Energy)<br />
- Saltend Congeneration Plant<br />
(International Power)<br />
• Steel making facility<br />
- Scunthorpe (Corus)<br />
• Refineries<br />
- Lindsay Oil (Total)<br />
- Immingham (ConocoPhillips)<br />
The capture technology used varies with<br />
each process; figure 4.1 simply depicts the<br />
processes involved.<br />
Carbon Capture and Storage Network<br />
Coal fired power stations represent the bulk<br />
of the emissions and would derive greater<br />
benefits from CCS. Any energy intensive<br />
industry that uses coal may be inclined to<br />
seriously consider CCS as the allowances<br />
allocated under the National Allocation Plan<br />
reduces in line with UK and EU targets.<br />
Integrated gasification combined cycle<br />
(IGCC) power stations are based on<br />
gasification technology also used in large<br />
process plants. CCS is perceived to be<br />
less problematic <strong>for</strong> IGCC power stations<br />
as the re<strong>for</strong>med syngas is purely CO2 and<br />
hydrogen. This option <strong>for</strong> production of decarbonised<br />
fuel allows the facility to operate<br />
continuously to produce power or hydrogen,<br />
which then can be sold on to neighbouring<br />
CCGTs or other users. This increased<br />
flexibility will result in higher average<br />
efficiencies if the gasifier component<br />
operates continuously whilst the power<br />
island matches electrical demand.<br />
Combined cycle gas turbines burn natural<br />
gas to produce relatively low concentrations<br />
of CO2, as the fuel is less carbon intensive<br />
and the process has a higher efficiency<br />
compared with coal-fired power plants. The<br />
economics of operating CCS at a CCGT plant<br />
do not compare favourably with IGCC and<br />
post-combustion coal. This is mainly due to<br />
the lower concentrations of CO2 in the flue<br />
gases, as well as the increased fuel costs<br />
to counter the drop in plant efficiency. This<br />
discussion is explored in more detail in the<br />
“Capturing CO2” document produced by the<br />
IEA GHG R&D Programme [16]. Figure 4.2<br />
provides an insight into the predicted costs of<br />
operating power plants of varying processes.<br />
Estimated costs per kWh reflect the predicted<br />
price of fuels; however do not consider the<br />
transportation and storage of CO2.<br />
Based on current knowledge and<br />
understanding, the following assumptions<br />
are made <strong>for</strong> each process category.<br />
IGCCs able to produce hydrogen as well<br />
as electrical power benefit greatly from<br />
CCS. The ability to operate the gasifier<br />
continuously would be a major advantage<br />
to an IGCC and there<strong>for</strong>e it is expected that<br />
they would be the first to join a CO2 pipeline<br />
<strong>network</strong>, assuming it was feasible to do so.<br />
Due to economics of scale, it is assumed<br />
that post combustion coal power plants will<br />
enter the <strong>network</strong> around the 2020s. They<br />
are unlikely to enter earlier, unless supported<br />
by incentive schemes.<br />
CCGTs are inherently flexible and cleaner,<br />
thus overcoming the issues with coal. CCS<br />
would appear less cost effective and not as<br />
beneficial; there<strong>for</strong>e it is assumed that half<br />
the CCGTs will enter the <strong>network</strong> at the tailend<br />
of the study period, with the remaining<br />
half operating with a mix of hydrogen or<br />
simply decommissioned.<br />
Non-energy producers account <strong>for</strong> a<br />
reasonable portion of CO2 emitted in this<br />
region, each with varying processes and<br />
methods of capture to consider. Arguments<br />
<strong>for</strong> whether CCS will be adopted at these<br />
facilities would be based on the impact the<br />
EU-ETS will have on their businesses.<br />
• Steel making industry<br />
- It may be that emissions allowances<br />
will enable global competitive<br />
production, assuming that BAT is<br />
adopted, but what the effect of changes<br />
in the National Allocation Plan <strong>for</strong> this<br />
industry is not certain.<br />
• Refineries<br />
- Requirements of the EU-ETS will<br />
probably be upgrades to the ageing<br />
UK refineries, again adopting BAT.<br />
Allocation of allowances will be<br />
problematic as processes and emissions<br />
at refineries vary with changes in feed<br />
stocks (light, sweet North Sea oil being<br />
replaced by imported, sour, heavy crude<br />
oil from the Middle East), changing<br />
products (demands <strong>for</strong> aviation fuels<br />
increasing) and accommodation <strong>for</strong><br />
biofuels processing.<br />
Despite the difficulties surrounding the<br />
allocation of carbon credits in the second<br />
phase of the EU-ETS, further reductions<br />
and increasing CO2 costs could encourage<br />
industries to cut their emissions below<br />
BAT. In this sense, the opportunity to join<br />
a low cost <strong>network</strong> would seem attractive,<br />
assuming a suitable CO2 capture unit can<br />
be found to suit the process.
Figure 4.1 Carbon capture systems<br />
post combustion<br />
pre combustion<br />
Oxyfuel<br />
Industrial processes<br />
Reproduced courtesy of the IPCC from IPCC Special Report<br />
on carbon dioxide Capture and Storage, Fig TS-3<br />
Figure 4.2 Predicted operating costs <strong>for</strong> power station technologies<br />
Cost of electricity, c/kWh<br />
12<br />
10<br />
8<br />
6<br />
4<br />
2<br />
0<br />
Overview of CO2 capture processes and systems<br />
Fuel<br />
O+M<br />
Capital<br />
Coal<br />
Gas<br />
Biomass<br />
Coal<br />
Biomass<br />
Coal<br />
Gas<br />
Biomass<br />
Coal<br />
Gas<br />
Biomass<br />
Gasification<br />
Gas, Oil<br />
Carbon Capture and Storage Network 13<br />
Power & Heat CO2 Separation<br />
PF IGCC IGCC PF IGCC IGCC PF post NGCC NGCC NGCC<br />
no cap (dry feed) no cap post (dry feed) cap comb. no cap oxy<br />
comb. oxy<br />
Air<br />
Air/O2 Steam<br />
Air<br />
Air/O2<br />
Re<strong>for</strong>mer +CO2<br />
Separation<br />
H2<br />
Air<br />
Power & Heat<br />
Air Seperator<br />
Process + CO2<br />
Separation<br />
N2<br />
O2<br />
CO2<br />
Power & Heat<br />
Raw material Gas, Ammonia, Steel<br />
CO2<br />
CO2<br />
N2 O2<br />
N2<br />
CO2<br />
CO2<br />
Compression<br />
& Dehydration
14<br />
5.0 CARBON DIOXIDE ENTRY SPECIFICATION<br />
5.1 INTRODUCTION<br />
The quality of carbon dioxide (CO2) entering<br />
any system may have a significant impact<br />
on the storage and transportation aspects<br />
of any CCS <strong>network</strong>. Any capture process<br />
is a balance providing a cost and energy<br />
efficient solution <strong>for</strong> extracting the CO2. This<br />
process will inevitably mean that some of<br />
the other contaminants are captured as well,<br />
which may have negative impact on CCS<br />
schemes in several ways:<br />
• Health and safety implications<br />
• Capture energy usage and power station<br />
efficiency<br />
• Transportation implications, property<br />
changes and costs.<br />
There<strong>for</strong>e the quality of the CO2 stream<br />
needs to be defined. For proposed<br />
<strong>network</strong>s this definition becomes the entry<br />
specification to the <strong>network</strong> to which<br />
emitters must comply in order to enter<br />
the system.<br />
5.2 pOSSIBLE IMpURITIES<br />
The impurities present in a CO2 stream<br />
depend greatly on the source. For nonanthropogenic<br />
sources carbon monoxide,<br />
hydrogen sulphide and methane are common<br />
impurities. Anthropogenic, man-made,<br />
sources will inevitably vary but will commonly<br />
produce the following contaminants.<br />
• Methane<br />
• Carbon monoxide<br />
• Water<br />
• Hydrogen<br />
• Oxygen<br />
• Nitrogen<br />
• Argon<br />
• Hydrogen sulphide<br />
• Sulphur oxides<br />
• Nitrogen oxides<br />
The impurities can be treated and removed<br />
to a certain extent, and would have to be<br />
<strong>for</strong> a successful CCS scheme. However<br />
trace amounts will remain and a limit<br />
needs to be set to enable the design of<br />
the cleaning operations particularly <strong>for</strong> H2S,<br />
SOx and NOx. The cause of the impurities<br />
is the combustion processes itself and the<br />
fuel stock. Considering a clean coal IGCC<br />
then an incomplete shift gas reaction will<br />
Carbon Capture and Storage Network<br />
introduce methane, carbon monoxide and<br />
water as well as hydrogen into any process<br />
gas stream. Consequently when the CO2<br />
is recovered so will some of the impurities.<br />
Hence the affect of these impurities on<br />
a CO2 stream need to be understood<br />
and controlled.<br />
5.3 pROpERTIES OF<br />
CARBON DIOXIDE<br />
Carbon dioxide is a common gas, and<br />
widely used in the food, pharmaceuticals<br />
and chemicals industry. However its physical<br />
characteristics make transportation complex.<br />
Unlike other commonly transmitted gases<br />
such as methane, hydrogen or ethylene the<br />
critical conditions of CO2 are relatively low, 74<br />
bar and 31°C, as shown in figure 5.1.<br />
This means that the transportation of<br />
CO2 can occur as a solid, gas, liquid, or<br />
as a supercritical fluid over a relatively<br />
narrow range of conditions. Typically CO2<br />
is transported as a gas or liquid, to local<br />
sources or into process or as a liquid <strong>for</strong> bulk<br />
transfer. In the case of a CCS <strong>network</strong> the<br />
denser the fluid the better as this generally<br />
reduces the pipe diameter required. However<br />
above the critical point the supercritical fluid<br />
state allows <strong>for</strong> a mixture of gas and liquid<br />
properties, the fluid has the density of a<br />
liquid with the compressibility and viscosity<br />
of a gas. These physical conditions make<br />
transportation in this state attractive given the<br />
efficiency gains from lower friction and lower<br />
pressure drops.<br />
It should be noted that in<strong>for</strong>mation on the<br />
properties of CO2 with contaminants is<br />
scarce. No specific testing has been carried<br />
out in the public domain, although some<br />
work is ongoing. Modelling of properties<br />
is possible using Equations of State such<br />
as Peng Robinson, although this modelling<br />
must be validated against test results to<br />
validate its accuracy. This is particularly<br />
important when considering a supercritical<br />
fluid mixture.<br />
5.4 CONTAMINATION ISSUES<br />
The purity of potential industrial CO2 sources<br />
is dependent on the combustion process<br />
and the method of capture. For example is<br />
the source a power station, pre-combustion<br />
or IGCC, ammonia or amine capture,<br />
desiccant drying or glycol? Typically the<br />
common contaminants are:<br />
• Methane<br />
• Non-condensable gases, nitrogen,<br />
oxygen, argon, hydrogen<br />
• Hydrogen sulphide<br />
• Sulphur oxides<br />
• Nitrogen oxides<br />
• Carbon monoxide<br />
Other contaminants may include mercury<br />
or complex chemicals such as dioxins<br />
or furans depending on the feed stock<br />
and process.<br />
The presence of methane as a contaminant<br />
may be possible <strong>for</strong> some processes.<br />
However the discussion around methane<br />
as a contaminant applies more to the<br />
geological sources of CO2 where methane is<br />
a much more common contaminant.<br />
There are two effects to consider, the<br />
safety impact and that on the physical<br />
properties. Key physical parameters of a<br />
fluid will be altered given a change in the<br />
mixture; specifically of interest to CCS is<br />
the change in the critical point and the<br />
phase boundaries. The importance of<br />
understanding this relationship is critical, as<br />
a change in the levels of one contaminant<br />
could adversely affect the properties of the<br />
mixture such that a phase change may<br />
occur, or a change from a supercritical to<br />
liquid phase.<br />
5.5 pROpERTIES OF CARBON<br />
DIOXIDE MIXTURES<br />
The properties of CO2 mixtures typical<br />
to CCS schemes are not well examined<br />
by industry or academia. Experience in<br />
the USA so far has been of CO2 from<br />
either anthropogenic (man-made) sources<br />
(25%) or geological sources (75%) that<br />
are relatively clean and these are used <strong>for</strong><br />
enhanced oil recovery (EOR).<br />
In the UK there are no geological sources.<br />
Industrial sources range from those used to<br />
produce food grade CO2 to contaminated<br />
CO2 emitted under environmental consents.<br />
The considerable variation in the quality<br />
of gas has an appreciable effect on the<br />
physical properties. For instance a pipeline<br />
run at 84 bar is 10 bar above the critical<br />
point <strong>for</strong> pure CO2 and providing pressure<br />
drop is low two phase flow will not occur.<br />
Introduce a contaminant and the critical<br />
point changes as does other properties.
Figure 5.1 Carbon dioxide phase diagram<br />
Pressure, bar<br />
73.0<br />
5.11<br />
1<br />
Solid<br />
If the critical pressure were to increase <strong>for</strong><br />
the mixture, or the contaminant change the<br />
phase to vapour, then the system hydraulics<br />
will change.<br />
The following figure shows one example<br />
as an illustration. Figure 5.2 and figure 5.3<br />
shows the deviation from pure CO2 caused<br />
by the presence of nitrogen. In all cases<br />
pure CO2 is one, the deviations are from this<br />
baseline, <strong>for</strong> example a data point of<br />
1.2 <strong>for</strong> density shows that the mixture is<br />
20% denser than pure CO2.<br />
As can be seen from the chart a 4%<br />
concentration of nitrogen imposes an<br />
11% increase in pressure drop. The critical<br />
points <strong>for</strong> this mixture become 26.6°C and<br />
82.3 bar.<br />
Similar effects can be seen considering the<br />
other contaminants. Typically the common<br />
contaminants generally correlate to a +/-<br />
20% deviation in most properties at around<br />
5% mol in a binary mixture.<br />
For critical temperature and pressure the<br />
general pattern is that an increase in the<br />
percentage of a contaminant increases<br />
the critical pressure and decreases the<br />
critical temperature. There are three notable<br />
exceptions; H2S, SO2 and NO2 increase<br />
both critical temperature and pressure.<br />
Carbon Capture and Storage Network 15<br />
Liquid<br />
Temperature, ˚C<br />
Gas<br />
-78.5 -56.4 31.1<br />
Supercritical<br />
Changes in the critical point represent<br />
changes in the phase envelope. As the<br />
critical point shifts with contaminant<br />
concentration it could impact on the<br />
operating point or envelope of the main<br />
system. Introducing a high contaminant<br />
source could push the phase envelope past<br />
the operating point of the <strong>network</strong> and may<br />
cause a change in phase. Figure 5.4 shows<br />
the change in phase envelope <strong>for</strong> a CO2<br />
– nitrogen mixture with increasing levels<br />
of nitrogen.<br />
Consider point A on the graph as the<br />
optimum operating point of a pipeline<br />
normally operating in a 4% nitrogen in CO2<br />
mixture, just below critical temperature<br />
but with a 10%, in this case 8 bar margin<br />
on pressure. An increase of 2% to a 6%<br />
contamination level reduces the margin<br />
above critical pressure, but reduces<br />
the critical temperature, the fluid is<br />
now supercritical.<br />
To avoid these changes in physical<br />
properties within a pipeline the variance<br />
that can occur must be controlled. To this<br />
extent an entry specification provides a<br />
design point around which the pipeline can<br />
be designed as to eliminate phase changes<br />
within the operating <strong>network</strong>.<br />
5.6 TECHNICAL IMpACT<br />
Key to a pipeline’s design is not only the<br />
physical constituents of the fluid but also its<br />
condition. The pressure and temperature<br />
<strong>for</strong> entry must be kept at a near uni<strong>for</strong>m<br />
level to avoid local pressure problems<br />
such as two phase flow or changes in<br />
bulk temperature. There<strong>for</strong>e a specification<br />
must include a minimum pressure and a<br />
maximum temperature. Generally given<br />
the critical point, temperature is limited to<br />
a condition that it must be less than 30°C.<br />
For pressure the critical point should be<br />
avoided, there<strong>for</strong>e a minimum pressure of<br />
100 bar would be acceptable, this gives a<br />
30 bar margin from the critical point to allow<br />
<strong>for</strong> pressure drop within the system.<br />
For a <strong>network</strong> that has to deal with<br />
multiple individual sources the design must<br />
accommodate all reasonable variations<br />
of flow that may occur. To achieve this,<br />
a <strong>network</strong> specification is required to<br />
limit the variability of the fluid properties<br />
to a reasonable level so that equipment<br />
design has a narrow range of key physical<br />
properties as possible. It is generally<br />
accepted that a design factor of 10% is<br />
applied to process equipment based on<br />
the averages of the streams involved. If<br />
the variation in properties is wide then the<br />
overall design range may be excessive,<br />
a 20% variation in physical properties in
16<br />
addition to a 10% design factor places<br />
a very wide envelope when considering<br />
optimum equipment design and selection.<br />
Typically <strong>for</strong> staged implementation the<br />
equipment will be staged as well, <strong>for</strong><br />
example a <strong>network</strong> may start with two<br />
compressor booster stations but expands<br />
to four at <strong>network</strong> completion.<br />
5.7 LEGISLATIVE REQUIREMENTS<br />
The legislative framework <strong>for</strong> pipelines<br />
and associated fixed equipment is well<br />
established and understood. The applicability<br />
of the legislation to carbon dioxide pipelines<br />
however is less well defined.<br />
The transportation of CO2 is covered by<br />
existing legislation in the <strong>for</strong>m of the Pipeline<br />
Safety Regulation 1996, PSR, and COMAH.<br />
Currently CO2 is not a hazardous material<br />
under PSR but the Health and Safety<br />
Executive (HSE), consider that it should be<br />
in this context and new legal guidance <strong>for</strong><br />
CO2 is expected in 2008. In the interim the<br />
HSE stance is that the current regulations<br />
should be applied and CO2 would only be<br />
exempt where it can be proved that the<br />
legislation does not apply. There<strong>for</strong>e under<br />
the PSR CO2 and the other constituents of<br />
the stream will count as a hazardous fluid<br />
and should be considered as such.<br />
Figure 5.2 Property deviations <strong>for</strong> carbon dioxide - nitrogen<br />
1.2<br />
1.15<br />
1.1<br />
1.05<br />
1<br />
0.95<br />
0.9<br />
0.85<br />
0.8<br />
Carbon Capture and Storage Network<br />
5.8 OFFSHORE LEGISLATION<br />
The prime constraints on CCS schemes<br />
operating offshore are OSPAR and the<br />
London Protocol. These treaties regulate the<br />
activities that can occur in the ocean and<br />
apply in and around the UK.<br />
Both are now modified to allow <strong>for</strong> CCS/<br />
EOR activities. OSPAR was recently<br />
amended to include the provision <strong>for</strong><br />
CCS worded such that carbon dioxide<br />
sequestration would be exempt from the<br />
disposal at sea restrictions as long as:<br />
i. Disposal is into a sub-soil geological<br />
<strong>for</strong>mation<br />
Property Deviations – carbon dioxide with nitrogen<br />
% Contaminant by Mole<br />
ii. The streams consist overwhelmingly<br />
of carbon dioxide. They may contain<br />
incidental associated substances derived<br />
from the source material and the capture,<br />
transport and storage processes used<br />
iii. No wastes or other matter are added <strong>for</strong><br />
the purpose of disposing of those wastes<br />
or other matter<br />
iv. They are intended to be retained in these<br />
<strong>for</strong>mations permanently and will not lead<br />
to significant adverse consequences <strong>for</strong><br />
the marine environment, human health<br />
and other legitimate uses of the<br />
maritime area.<br />
0 0.5 1 1.5 2 2.5 3 3.5 4 4.5 5<br />
Mass Density [kg/m3] Molar Density [kgmole/m3] Molar Heat Capacity [kJ/kgm de-C]<br />
Mass Heat Capacity [kJ/kg-C] Molar Enthalpy [kJ/kgm de] Mass Enthalpy [kJ/kg]<br />
Mass Entropy [kJ/kg-C] Z Factor Molar Entropy [kJ/kgm ole-C]<br />
Thermal Conductivity [W/m-K] Viscosity [cP] Surface Tension [dyne/cm]<br />
Kinematic Ciscosity [cSt] Pressure Drop [kPa]<br />
OSPAR defines a CO2 stream as;<br />
“those streams that consist overwhelmingly<br />
of carbon dioxide from carbon dioxide<br />
capture processes <strong>for</strong> storage in geological<br />
<strong>for</strong>mations in the sub-soil of the OSPAR<br />
maritime area. Provided that no wastes or<br />
other matter are added <strong>for</strong> the purpose of<br />
disposing of those wastes or other matter,<br />
the carbon dioxide streams may contain<br />
incidental associated substances derived<br />
from the source material and the capture,<br />
transport and storage processes used.”<br />
The definition of “overwhelmingly of<br />
carbon dioxide” is vague, however a<br />
general acceptance of 95% or more CO2<br />
is considered appropriate. However the<br />
statement precludes the addition of other<br />
waste streams and additives, such as<br />
odourising agents that may have been<br />
considered <strong>for</strong> onshore pipelines.<br />
5.9 TYpICAL STREAM<br />
COMpOSITIONS pOST CApTURE<br />
Without significant facilities operating <strong>for</strong><br />
anthropogenic carbon capture the amount<br />
of in<strong>for</strong>mation available to define an entry<br />
specification is low. However a number<br />
of sources have been summarised by<br />
reference 6 and other projects.<br />
Table 5.1 to table 5.3 indicate quoted<br />
compositions of CO2 streams from<br />
proposed CCS power stations from the<br />
IPCC, Special Report on Carbon Capture<br />
and Storage, section 3 [6].
Figure 5.3 Variation in critical parameters <strong>for</strong> carbon dioxide - nitrogen<br />
60<br />
50<br />
40<br />
30<br />
20<br />
10<br />
0<br />
0<br />
0.00 0.46 0.92 1.37 1.82 2.26 2.70 3.14 3.57 4.00 4.43 4.85 5.27 5.68 6.09 6.50 6.90 7.30 7.70 8.09 8.48<br />
% Contaminant by Mole<br />
Critical Properties-1 – True Tc [C] Critical Properties-1 – True Pc [kPa]<br />
Figure 5.4 Phase envelope changes with increasing impurity<br />
100<br />
90<br />
80<br />
70<br />
60<br />
50<br />
40<br />
30<br />
20<br />
10<br />
Critical properties of carbon dioxide and nitrogen dioxide mixtures<br />
PT Phase Envelope carbon dioxide – Nitrogen<br />
0<br />
-140 -120 -100 -80 -60 -40 -20 -0 20 40<br />
Temperature ˚C<br />
Carbon Capture and Storage Network 17<br />
A<br />
10000<br />
5000<br />
8000<br />
7000<br />
6000<br />
5000<br />
4000<br />
3000<br />
2000<br />
1000<br />
CO2<br />
0.1 N2<br />
0.005 N2<br />
0.03 N2<br />
0.04 N2<br />
0.05 N2<br />
0.025 N2<br />
0.06 N2
18<br />
Table 5.1 Coal fired plant post comb capture<br />
Component Limit<br />
N2/Ar/O2 0.01%<br />
Hydrocarbons 0<br />
H2<br />
0<br />
H2S 0<br />
CO 0<br />
SOx
5.11 SAFETY IMpACTS<br />
Any specification <strong>for</strong> a CO2 pipeline must<br />
consider the safety issues associated<br />
not only with CO2 but with each of the<br />
contaminants. Whilst the consideration of<br />
the safety impact was not strictly within the<br />
scope of this report it has been considered<br />
in depth.<br />
The danger from a CO2 transmission system<br />
is essentially the occurrence of leaks both<br />
short term and long term. Whilst the CO2 is<br />
hazardous the impurities it may contain, such<br />
as hydrogen sulphide are significantly higher.<br />
There<strong>for</strong>e in considering dispersion and the<br />
effects of a release the contaminants must<br />
also be considered ensuring as a minimum<br />
they stay within their short term exposure<br />
limit (STEL) and the SLOT/SLOD data from<br />
the HSE.<br />
5.12 pROJECT SpECIFICATION<br />
Given the discussion in the previous<br />
section the specification from the Dynamis<br />
project provides a reasonable basis. The<br />
contaminant levels specified are such that<br />
they minimise the risk of hydrate and free<br />
water <strong>for</strong>mation, ensure the stability of the<br />
fluid at a typical pressure range. In addition<br />
the hazardous contaminants H2S, CO, SO2<br />
and NO2 have limits such that they are<br />
significantly lower than their accepted<br />
STEL values.<br />
Carbon Capture and Storage Network 19<br />
Table 5.5 Dynamis SP3 recommended entry specification<br />
Component Limit<br />
CO2 >95%<br />
N2<br />
Ar<br />
H2<br />
O2<br />
20<br />
6.1 NETWORK AND SCENARIO<br />
DEFINITIONS<br />
There are two distinct aspects to consider<br />
in the <strong>for</strong>mulation of a concept scenario<br />
<strong>for</strong> connecting the region’s emitters; the<br />
scenario and the shape of the <strong>network</strong>.<br />
The scenario defines the requirements of<br />
a <strong>network</strong>; who, what, when and to some<br />
extent where, when considered alongside<br />
the availability of potential storage sites.<br />
The <strong>network</strong> is the physical shape of the<br />
system to accommodate the scenarios,<br />
constrained by the process and mechanical<br />
design, local environment and implementation<br />
of regulations and good practice.<br />
6.2 NETWORK<br />
6.2.1 primary factors <strong>for</strong> pipeline<br />
route selection<br />
The design of any <strong>network</strong> should consider<br />
a number of factors and the acceptance<br />
that the shortest route may not be the most<br />
suitable. The primary factors that should be<br />
considered include:<br />
• Public and personnel safety<br />
• Pipeline fluid and operating conditions<br />
• Environmental impact including<br />
designated areas<br />
• Geological conditions, including<br />
topography, geotechnical and<br />
hydrographical conditions<br />
• Land use, existing and future, including:<br />
• Third-party activities<br />
• Agricultural practice<br />
• Existing facilities and services<br />
• Access<br />
• Transport facilities and utility services<br />
• Construction, testing, operation and<br />
maintenance<br />
• Security<br />
• Any other hazards.<br />
In order to develop the pipeline route<br />
efficiently, three phases of routing are<br />
usually adopted:<br />
1) Route corridor selection<br />
2) Route investigation and consultation<br />
3) Design and approval of final route.<br />
Carbon Capture and Storage Network<br />
6.0 ONSHORE AND NETWORK DESIGN<br />
This report is a high level feasibility study<br />
<strong>for</strong> the region. There<strong>for</strong>e the only one of the<br />
three phases appropriate is the selection of<br />
potential routes.<br />
6.2.2 Design assumptions<br />
The key design assumptions relate to the<br />
design of the pipeline, the <strong>network</strong> shape<br />
and constructability.<br />
The pipeline design is limited to 125 bar<br />
operating pressure, this places the fluid into<br />
the dense phase but not supercritical as the<br />
entry temperature will be limited to below<br />
the critical temperature.<br />
Onshore booster stations <strong>for</strong> pressure<br />
control will not be provided, the <strong>network</strong><br />
shape selected to route the pipeline<br />
acts as a central ‘rail’ with spurs to each<br />
emitter. Provision of an onshore booster<br />
station would necessitate a significant<br />
establishment along the pipe route or<br />
adjacent to an existing industrial site.<br />
To determine the optimum location of such<br />
a station a more detailed <strong>network</strong> analysis<br />
would be required than is available here.<br />
The provision of intermediate distance safety<br />
or block valves has been assumed to fall at<br />
15km <strong>for</strong> high pressure systems.<br />
Onshore pipeline sizes are limited to a<br />
maximum of 1000 mm diameter. The<br />
pipelines are buried and require significant<br />
top cover, typically 1.2m up to 1.8m <strong>for</strong><br />
special crossings such as railways. This<br />
would entail a trench depth in excess of 3m.<br />
To generate reasonable cost metrics the<br />
trench excavation depth was limited to 3m,<br />
thus limiting the pipe size.<br />
Flow rates to the <strong>network</strong> are taken as a<br />
viable percentage of total carbon dioxide<br />
based on DEFRA’s NATS tables. Where<br />
appropriate and permitted actual or planned<br />
capture figures have been used. Typically<br />
the capture efficiency is taken as 90%. For<br />
refinery complexes such as the Total and<br />
ConocoPhillips facilities on Humberside a<br />
much lower figure of 50% is utilised. The<br />
distributed nature of point sources of release<br />
on these mature facilities would require<br />
major design and infrastructure changes at<br />
each site. Other issues such as the nature<br />
of the emission would challenge the way<br />
carbon dioxide is captured, <strong>for</strong> example<br />
emissions from a flare would be impossible<br />
to capture. 50% is used as a generalisation<br />
of what might be expected to be within<br />
reach of capture technology.<br />
6.2.3 Operating philosophy<br />
The <strong>network</strong> is sized to accommodate<br />
the flows from the emitters with a margin<br />
allowance <strong>for</strong> peak excursions. The<br />
operational capacity of the emitters to<br />
capture CO2 in the area range from 50%<br />
– 98%. With such scales to consider, peak<br />
demands would necessitate multiple or a<br />
significantly larger, thicker pipeline, which,<br />
in turn, have a negative effect on the<br />
economics. Capture plant and stores will<br />
have various license terms which will have<br />
to be realistic <strong>for</strong> the processes used. The<br />
operating regime <strong>for</strong> the transport system<br />
will be primarily governed by commercial<br />
agreements on line use and recognise<br />
the risk of CO2 losses as a very low but<br />
a possible operational risk. There is no<br />
offline storage in the system except if it was<br />
connected to a shipping facility <strong>for</strong> the CO2.<br />
The lines are sized above the average flow<br />
to account <strong>for</strong> plant down time and peak<br />
flows from all sites, but there is an economic<br />
limit of the ETS CO2 value at which it is<br />
cheaper to not capture or export CO2.<br />
Given the points of failure in capture, transport<br />
and storage facilities the transport pipelines<br />
and pumps are not duplicated <strong>for</strong> 100%<br />
standby capacity. Maintenance regimes,<br />
equipment specifications and reliability and<br />
availability levels would all be considered and<br />
designed to accepted best practice. As the<br />
repair down time would be reasonably short,<br />
the value of the CO2 vented back at source<br />
due to the lack of or reduced amount of<br />
transmission capacity is low compared with<br />
additional capital spend on what is not a life<br />
critical or high marginal value product.<br />
It should be noted that government<br />
legislation in future might require that<br />
all facilities with CCS must endeavor<br />
to capture all available CO2, similar to<br />
those large power stations with flue gas<br />
desulphurisation units.<br />
6.2.4 Design life<br />
The design life of the onshore and offshore<br />
pipelines is 40 years, and compressors,<br />
valves, meters, etc is as typical as used <strong>for</strong><br />
that equipment. These design lives depend<br />
critically upon the dryness of the CO2<br />
entering the system and this and other risks<br />
are important issues to be addressed further<br />
by OEMs and system designers. Operational<br />
costs are assumed to cover necessary<br />
maintenance of that equipment and all<br />
equipment considered in this study will be<br />
new and designed with this lifespan in mind.
6.2.5 Metering<br />
As the impetus <strong>for</strong> building a distributed<br />
collection system is likely to be financial<br />
(based on selling carbon credits), metering<br />
of CO2 sent <strong>for</strong> disposal would be necessary<br />
at all sources prior to injection into the<br />
<strong>network</strong>. Metering would also be required<br />
at the point of storage/sequestration<br />
<strong>for</strong> regulatory purposes, i.e. to ensure<br />
that all CO2 injected into the <strong>network</strong> is<br />
sequestered.<br />
6.2.6 Corrosion protection<br />
Steel pipelines are routinely protected<br />
against external corrosion by the use of<br />
cathodic protection systems, and a design<br />
allowance in the wall thickness. These are<br />
included in the costs <strong>for</strong> steel pipelines<br />
presented here. Internal corrosion would<br />
only be a problem if water was present<br />
in the CO2 stream.<br />
6.2.7 Network phasing<br />
The key factor on the <strong>network</strong> design is that<br />
the <strong>network</strong> <strong>for</strong>ms in a number of phases<br />
to accommodate emitters that come online<br />
in similar time periods. This way no single<br />
emitter would be faced with the initial full<br />
cost of a pipeline without commitment from<br />
other parties. For example consider plants<br />
A, B & C, bringing CCS on line in 2015,<br />
2017 and 2030 respectively. Here simple<br />
sources A & B would be grouped with<br />
the pipeline coming on line in 2017 at the<br />
latest. The 2030 emitter would require a<br />
pipe solution in another deployment stage.<br />
This does mean however that there will exist<br />
multiple pipes running in proximity to each<br />
other at the end of the project particularly<br />
the shore line stations would have several<br />
incoming lines in the same pipe corridor.<br />
Figure 6.1 shows an example of part of<br />
a phased <strong>network</strong>. The red line indicates<br />
the projected path of a pipeline installed<br />
in 2017, the blue a pipeline installed in<br />
2030 to accommodate the second phase<br />
of development.<br />
6.2.8 Network design tool<br />
The <strong>network</strong> design and cost in<strong>for</strong>mation is<br />
provided using a pre-existing spreadsheet<br />
based tool created <strong>for</strong> the International<br />
Energy Agency Greenhouse Gas R&D<br />
Programme. Specifically designed <strong>for</strong><br />
the <strong>network</strong>ing of carbon dioxide the<br />
spreadsheet was created by AMEC and<br />
Gastec at CRE Ltd in 2006. The tool allows<br />
Carbon Capture and Storage Network 21<br />
<strong>network</strong>s to be created and cost estimated<br />
using several matrices <strong>for</strong> standard<br />
equipment and pipeline costs.<br />
The costing in<strong>for</strong>mation used in this model<br />
was generated by AMEC in 2006. It consists<br />
of in<strong>for</strong>mation from project and proposal<br />
databases on current and historical projects.<br />
Each cost was subject to scrutiny and<br />
the cost used was based on engineering<br />
assessment as to whether the price was<br />
valid. Where historical data was not available<br />
standard estimating metrics used in house<br />
by AMEC have been used.<br />
6.3 AREA ANALYSIS<br />
6.3.1 General description<br />
The Yorkshire and Humber region is ideally<br />
suited to carbon capture and storage<br />
schemes given the intensity of emitters and<br />
the availability of potential offshore storage<br />
solutions. In addition there already exist gas<br />
terminals at Theddlethorpe and Easington.<br />
Boundaries <strong>for</strong> the study area are defined<br />
loosely as the Humber sub-region, but more<br />
exactly by the regional border of Yorkshire to<br />
the south and the town of Castle<strong>for</strong>d to the<br />
west. The northern boundary <strong>for</strong> the study<br />
area is loosely defined as not further north<br />
than Beverley. Although there is a cluster<br />
of emitters in and around York they are not<br />
included in the study, due the distance to<br />
the nearest suitable tie-in point. Appendix A<br />
contains a project area map.<br />
To the west the area is also bound by the<br />
metropolitan areas of Leeds, Wakefield,<br />
Barnsley, Sheffield and Rotherham. Running<br />
significant piping solutions to emitters<br />
in this area was viewed as a challenge,<br />
particularly where some emitters would have<br />
required crossing the M1 motorway. For the<br />
purposes of the study, given that the area<br />
already defined captured all of the Tier 0<br />
emitters the area west of Castle<strong>for</strong>d and<br />
the A1 was not included.<br />
6.3.2 Area restrictions<br />
In examining an area <strong>for</strong> pipeline routing the<br />
area is scrutinised <strong>for</strong> major obstructions.<br />
Here given that the fluid is carbon dioxide,<br />
a precautionary routing of the pipeline is<br />
taken, trying where possible to maximise<br />
the distance away from residences and<br />
urban centres whilst optimising the pipeline<br />
length. As well as the conservative line run<br />
approach there a number of pinch points<br />
along the route.<br />
Firstly the area to the north of Hull, figure<br />
6.2, and south of Beverley is congested,<br />
a large number of distributed dwellings<br />
exist in the area. This means that the<br />
pipeline must snake through an area<br />
or encroach into urban areas. Whilst<br />
encroaching on residences is allowed to<br />
a specified separation distance, under the<br />
UK regulations and codes, it should where<br />
possible be avoided. The area does not<br />
preclude its use of a pipe run, but it would<br />
be a difficult area to traverse.<br />
Secondly to the west of Scunthorpe lies the<br />
River Trent the east bank of which <strong>for</strong>ms<br />
a steep gradient to the north of the town<br />
until the Humber, figure 6.3. Such inclines<br />
with rapid increases or decreases in height<br />
should be avoided if possible. Here the<br />
proximity to the river edge and the town<br />
itself does not lend itself easily to a pipe<br />
bridge solution.<br />
Two routes do exist, the first to the south of<br />
Scunthorpe represents a major detour from<br />
the direct path, and as can be seen from the<br />
basic map in Appendix A a band of <strong>for</strong>ests<br />
litter the area to the east, some of which<br />
and the surrounding area are SSSI’s. The<br />
second route would be to cross in the area<br />
to the north of Scunthorpe where the incline<br />
is not so pronounced.<br />
Figure 6.1 Example of phased<br />
<strong>network</strong> pipelines<br />
Source C, 2030<br />
Source A, 2015<br />
Source B, 2017<br />
Shoreline Terminal<br />
& Single Offshore<br />
Pipeline
22 Carbon Capture and Storage Network<br />
6.4 NETWORK FORMATION<br />
6.4.1 Ring main<br />
The simplest and most effective method<br />
of connecting distributed emitters is a ring<br />
main, much like those used to distribute<br />
a fluid rather than receive. The ring main<br />
could receive all fluids and route to one of<br />
two export points allowing sections to be<br />
dropped <strong>for</strong> inspection or the ring main to<br />
be built up gradually. Figure 6.4 shows a<br />
basic example of a ring main system <strong>for</strong><br />
the region. However the size of the <strong>network</strong><br />
would require a split main pipe, two parallel<br />
pipes working in operation of a significant<br />
size. This has obvious benefits <strong>for</strong> staging<br />
the development and capital outlay but has<br />
significant impact on the construction and<br />
operational elements. If several pipes are<br />
being used to per<strong>for</strong>m a function of a ring<br />
main then that suggests a more distributed<br />
approach, allowing a <strong>network</strong> to develop<br />
over time. For a ring main the first few users<br />
would bear the cost of a pipeline they may<br />
not have the capacity to use efficiently.<br />
6.4.2 Tree/distributed structure<br />
A tree structure, figure 6.5, is more suited<br />
to the efficient operation and construction<br />
of a <strong>network</strong> such as the one proposed <strong>for</strong><br />
Humberside. It allows phased development<br />
into stages that meet the requirement of<br />
emitters as they come on line not <strong>for</strong>cing<br />
future need costs on to early emitters. This<br />
system also lends itself more efficiently to<br />
the collection from the lower Tier sources.<br />
For the majority of Tier 1 and 2 sources<br />
it may not be appropriate to compress<br />
gases at site. Instead the lower tier sites are<br />
envisaged to be part of a suction system<br />
tied to a larger emitter station. At the larger<br />
emitters the lower tier gas is collected by<br />
compressors sucking the carbon dioxide<br />
away from the emitter. For the purposes of<br />
this study a tree structure has been adopted<br />
<strong>for</strong> the <strong>network</strong>s.<br />
Figure 6.2 Pipeline route congestion point – Hull - Beverley Gap<br />
Figure 6.3 Pipeline route congestion point – Trent Crossing
6.5 SELECTION OF EXpORT<br />
TERMINAL LOCATION<br />
To a certain extent the shape of the <strong>network</strong><br />
is also defined by the practical access to the<br />
offshore stores, with the onshore options<br />
being to the north or south of the Humber<br />
estuary in the shape of Easington/Dimlington<br />
and Theddelthorpe as both host existing<br />
gas import terminals, and there<strong>for</strong>e known<br />
facilities and track records <strong>for</strong> assessing<br />
beach and near shore pipe installations.<br />
The preferred <strong>network</strong> route is to the south,<br />
via Theddlethorpe <strong>for</strong> a number of reasons;<br />
• Area analysis indicates that the northern<br />
route around Kingston upon Hull<br />
is congested, particularly so when<br />
considering phased pipelines. Whilst<br />
it may possible to lay a single or two<br />
pipelines the required easement and<br />
way leaves would infringe on residences.<br />
• The bulk of the reservoir destinations are<br />
to the south east, nearer Theddlethorpe.<br />
• The majority of major emitters, by<br />
number of sources lay to the south of<br />
the Humber, crossing the river to gain<br />
entry to Easington would be a major<br />
expense and multiple crossings due to<br />
phased developments should preferably<br />
be avoided.<br />
A non-phased solution <strong>for</strong> the area including<br />
Tiers 1 and 2 would make Easington<br />
more attractive, however running the<br />
major pipeline required to facilitate Drax,<br />
Eggborough and Ferrybridge would be<br />
significantly difficult and disruptive.<br />
There<strong>for</strong>e the preferred destination is an<br />
export point on the shore in the general area<br />
of Theddlethorpe.<br />
Carbon Capture and Storage Network 23<br />
Figure 6.4 Schematic example of a ring main <strong>network</strong><br />
Figure 6.5 Schematic example of a tree structure <strong>network</strong>
24<br />
7.1 STORAGE OpTIONS<br />
Storage sites <strong>for</strong> CO2 from the Yorkshire and<br />
Humber area of any useful size are located<br />
to the east in the southern North Sea. These<br />
comprise many large producing natural gas<br />
reservoirs, which are the main focus of this<br />
study, but also saline aquifers (shown in<br />
figure 7.1). The interesting saline <strong>for</strong>mations<br />
in the area are a depth of between 1km<br />
and 1.5km and have been extensively<br />
drilled in the southern North Sea as many<br />
overlie natural gas fields. However they<br />
have not been characterised and whilst their<br />
theoretical storage potential is significant,<br />
their actual capacity and storage security<br />
are far from proven. In order to develop<br />
and produce from them, natural gas fields<br />
have been extensively characterised and it<br />
is by their nature to be more certain about<br />
their storage potential since they have<br />
contained natural gas <strong>for</strong> tens of millions of<br />
years. However, there is timing uncertainty<br />
about cessation of production and<br />
decommissioning of gas fields. But <strong>for</strong> this<br />
study all fields of useful size have assumed<br />
to be available <strong>for</strong> CO2 storage in the period<br />
between 2008 and 2050.<br />
7.2 DATA SOURCES<br />
Data <strong>for</strong> storage sites was derived<br />
primarily from the Tyndall working paper<br />
No 85 [3] with input from other public<br />
sources including WoodMac and DBERR<br />
publications including the North Sea Task<br />
Force report and study [4, 5 and 6]. There<br />
was sufficient consistency in their details <strong>for</strong><br />
the purpose of this study. The in<strong>for</strong>mation is<br />
summarised on table 7.1 and table 7.2.<br />
Carbon Capture and Storage Network<br />
7.0 OFFSHORE ROUTES AND STORAGE<br />
7.3 ALTERNATE STORAGE<br />
AND COMpETING USES FOR<br />
DEpLETED GAS FIELDS<br />
The northern North Sea includes the Utsira<br />
saline aquifer which has been proven by<br />
the Sleipner CO2 storage project. This<br />
Norwegian project has been injecting 1mt/y<br />
CO2 into the Utsira aquifer since 1996.<br />
This has been monitored and is proving<br />
very successful. Also associated with<br />
the northern North Sea is the possibility<br />
of enhanced oil recovery (EOR). Proven<br />
onshore, but not offshore or in the North<br />
Sea, this uses CO2 injected into oil<br />
<strong>for</strong>mations to help recover more of the oil<br />
through CO2’s solvent properties mobilising<br />
the oil in rock pores. When CO2 is recovered<br />
with the oil it is separated and re-injected<br />
so that it is contained, and following<br />
decommissioning of the oil field it is stored in<br />
the same manner as in a depleted gas field.<br />
Both of these possibilities require either<br />
shipping the CO2 or quite long pipelines.<br />
As solutions <strong>for</strong> the period of this study the<br />
costs are unattractive compared to local<br />
storage. However <strong>for</strong> EOR the additional<br />
oil is the main revenue driver. Testing the<br />
opportunities <strong>for</strong> EOR is recommended<br />
to compliment this study.<br />
It should be noted that some depleted<br />
gas fields may be converted to natural gas<br />
storage facilities. Such facilities already exist<br />
in the North Sea, <strong>for</strong> examples at the Rough<br />
Field, with proposals <strong>for</strong> the Esmond and<br />
Gordon fields but such fields are smaller<br />
than the fields in this study.<br />
7.4 CO-ORDINATION OF<br />
DECOMMISSIONING AND RE-USE<br />
OF EXISTING ASSETS<br />
There has been a presumption that<br />
it is desirable to co-ordinate the<br />
decommissioning of a gas field with the<br />
planning of CO2 storage. With respect<br />
to well abandonment and the re-use of<br />
existing infrastructure this is undoubtedly<br />
true. We have however had to assume the<br />
use of new pipelines due to the volumes,<br />
timescales and pressures of CO2 to be<br />
transported. The consensus is clearly that<br />
we must also assume the transport system<br />
terminates at new injection wells and<br />
plat<strong>for</strong>ms without offshore recompression.<br />
This is because of the high operating costs<br />
of the alternatives and the diversity of field<br />
combinations to be considered. It may be<br />
that in some instances the reuse of existing<br />
infrastructure is feasible, but it would be<br />
misleading to base this report on the<br />
assumption that asset re-use is economic.<br />
To justify investment in a long life asset, such<br />
as a high pressure and capacity pipeline<br />
and injection wells, and with <strong>network</strong> flow<br />
rates ranging from 2 to 40 million tonne per<br />
year (2-40mt/y) we reviewed the available<br />
fields and settled on a cut-off of a minimum<br />
40mt storage capacity <strong>for</strong> a depleted gas<br />
field. This may seem low but we wanted to<br />
ensure useful reservoirs along a pipe route<br />
were not overlooked.<br />
Barring inappropriate well abandonment it<br />
is reasonable to consider that substantial<br />
gas fields that are decommissioned be<strong>for</strong>e<br />
CO2 storage is required can be re-accessed.<br />
Storage site characterisation as distinct<br />
from the present gas characterisation<br />
would be required in accordance with the<br />
emerging regulatory regime. At this time only<br />
the Shell Indefatigable field is categorised<br />
as unavailable because it is abandoned,<br />
but it is included as a store available<br />
when the remainder of Indefatigable is<br />
decommissioned and is assumed to be<br />
used by the <strong>network</strong>.
7.5 INJECTION pRESSURE<br />
A pipeline pressure requirement of up to<br />
170 bar is recommended to be used <strong>for</strong><br />
the purposes of this study given the lack of<br />
detailed knowledge of the individual reservoir<br />
and well differences, and the need to serve<br />
multiple fields over the life of the offshore<br />
trunk pipelines. Though some fields do not<br />
require this high injection pressure the initial<br />
pipeline will be extended to higher pressure<br />
stores. The additional wall thickness does<br />
mean an increase in initial installation cost<br />
<strong>for</strong> the pipeline but the opportunity to<br />
operate at lower design loads must be <strong>for</strong><br />
well over 10 years to prompt installing a<br />
second pipeline due to the high fixed costs<br />
of offshore pipe construction.<br />
7.6 SALINE AQUIFERS<br />
There are no saline <strong>for</strong>mations that have<br />
been characterised sufficiently to have<br />
good estimates of their storage potential<br />
and leakage risk. They are also not closer<br />
than depleted gas fields. However, by coincidence<br />
three with storage capacities of<br />
over 1000mt over lay producing gas fields.<br />
Un<strong>for</strong>tunately there are no robust geological<br />
studies to suggest that these <strong>for</strong>mations are<br />
sealed unlike gas fields which have obviously<br />
trapped rising gases <strong>for</strong> a very long time.<br />
For those aquifers that lie at a shallower<br />
depth than an explored gas field there is<br />
data because of seismic and borehole<br />
results, though it requires analysis to focus<br />
on the aquifer rather than the much deeper<br />
gas field. However much analysis is done,<br />
the final proof is in drilling and injection and<br />
monitoring of a measurable amount of CO2,<br />
as that will provide confidence to rely on that<br />
geological store <strong>for</strong> CO2 <strong>for</strong> large volumes.<br />
Further to the Sleipner experience a number<br />
of other CO2 injection and monitoring<br />
aquifer injection trials are underway, all with<br />
extensive monitoring and modelling. Routing<br />
ideally needs to enable access to, and<br />
assessment of, these three aquifers because<br />
of their large storage potential.<br />
Carbon Capture and Storage Network 25<br />
7.7 GAS FIELD SELECTION<br />
7.7.1 Availability timeline<br />
For pre-2020 availability Leman has the<br />
best date and size features, followed by<br />
Perenco’s Indefatigable & SW, Viking, Victor,<br />
Vulcan, Hewett, Ravenspurn North, Audrey,<br />
Amethyst E & W, and Pickerill. Considerable<br />
caution is required about the availability of<br />
Leman as the operator of half the field is not<br />
likely to decommission be<strong>for</strong>e 2025. There<br />
is potential in a minority of scenario options<br />
<strong>for</strong> an overlap between gas recovery and<br />
CO2 injection which because of connectivity<br />
within the field may be a problem. This can<br />
be resolved be<strong>for</strong>e a pipe route committing<br />
to use Leman is sanctioned.<br />
7.7.2 Distance selection<br />
For a minimum distance <strong>for</strong> first stage<br />
capacity, or desirable if near a pipeline<br />
route to larger stores, the best fields are<br />
Amethyst E & W then Pickerill, followed by<br />
Ravenspurn North and, if via Theddlethorpe,<br />
then Hewett.<br />
7.7.3 Injectivity<br />
Ranking by injectivity, a measure of how<br />
easy it is to inject CO2 into a <strong>for</strong>mation<br />
and size the preferred fields are Viking<br />
and Indefatigable, and Leman and Hewett,<br />
with consideration to Victor, Sean N & S,<br />
Vulcan, Audrey, Barque & Barque S, and<br />
Ravenspurn North. Injectivity is primarily<br />
driven by rock permeability, but other<br />
geological and well design factors<br />
influence the flow rate that will be<br />
achieved in practice.<br />
Fields are often a complex of gas retaining<br />
structures which have varying degrees of<br />
interconnection. The amount of connectivity<br />
impacts the number and design of wells <strong>for</strong><br />
gas recovery, and the same will be true <strong>for</strong><br />
CO2. There<strong>for</strong>e the connectivity of a field’s<br />
storage volume is an important part of the<br />
overall economic flow rate <strong>for</strong> a storage site.<br />
Existing gas field data will help, but saline<br />
fields need more characterisation. More<br />
work on target fields is required to establish<br />
costs and injectivity flow rates be<strong>for</strong>e<br />
finalising a commitment to use a particular<br />
field <strong>for</strong> CO2 storage.<br />
7.7.4 Decommissioning of gas fields<br />
in the study period<br />
This study does not assume reuse of<br />
existing offshore facilities, however there<br />
should be cost reduction opportunities<br />
including the re-use of some wells, better<br />
geological and operational knowledge<br />
transfer into the new activities and deferred<br />
expenditures if CO2 storage neatly followed<br />
gas depletion. There are risks that other<br />
fields besides Shell Indefatigable (currently<br />
decommissioning) will have to commit<br />
to decommissioning be<strong>for</strong>e a CO2 store<br />
commitment can be made.<br />
These include:<br />
• Pickerill by about 2013<br />
• Amethyst E & W, Indefatigable & SW<br />
and Hewett by about 2015<br />
• Audrey by about 2017<br />
• Ravenspurn North by about 2018<br />
• Vulcan by 2020.<br />
Given the lack of a business case <strong>for</strong> storage<br />
it is difficult to see why existing operators will<br />
manage field decommissioning, including well<br />
abandonment details of penetrated aquifers,<br />
in a way that is ideal <strong>for</strong> future CO2 storage.<br />
Providing a viable business case, plus<br />
interpretation of current decommissioning<br />
plans in the light of potential CO2 storage,<br />
is there<strong>for</strong>e important in reducing costs.
26<br />
Carbon Capture and Storage Network<br />
Figure 7.1 Overview of UK oil and gas fields including the Utsira Aquifer
Table 7.1 Potential storage sites – gas field<br />
Gas Storage Field Availability Range Storage Capacity Distance from Distance from Injectivity<br />
(mt) Easington (km) Theddlethorpe (km)<br />
Leman 2013 2025+ 870 160 140 Good<br />
(Permenco + Shell)<br />
Indefatigable & SW 2012 2015 222 180 160 Reasonable<br />
Viking 2013 2018 214 180 170 Good<br />
West Sole 2020 2030 136 70 80 Tight<br />
Galleon 2022 2032 128 145 130 Tight<br />
Hewett 2010 2015 216 130 100 Good<br />
Indefatigable (Shell) 2005 2007 111 260 230 Reasonable<br />
Barque & Barque S 2020 2030 89 100 100 Good<br />
Victor 2015 2020 73 220 180 Good<br />
Ravenspurn North 2013 2018 59 70 90 Tight<br />
Vulcan 2015 2020 53 160 140 Reasonable<br />
Audrey 2012 2017 49 140 140 Reasonable<br />
Clipper N 2030 2035 46 135 125 Tight<br />
Amethyst E & W 2010 2015 46 45 55 Tight<br />
Sean N & S 2035 2040 44 220 200 Reasonable<br />
Schooner 2019 2024 41 155 170 Tight<br />
Pickerill 2008 2013 40 70 65 Tight<br />
Table 7.2 Potential storage sites - saline aquifer<br />
Carbon Capture and Storage Network 27<br />
Saline Aquifer Storage Capacity Depth Underlying Remarks<br />
(Tyndall ref) (mt) (m) Gas field(s) from Tyndall<br />
2/48 3169 1100 approximately Large normal fault cuts through<br />
congruent to the structure.<br />
West Sole<br />
3/48 2302 1200 linear under Barque Galleon nearby. Many faults in the seal on<br />
and Clipper N. the above lying Bunter sandstone.<br />
4/49 1114 1400 Viking block 48/17 Movement of salt has caused faulting on<br />
the flanks of the structure. Faults extend<br />
upwards to the seabed.
28 Carbon Capture and Storage Network<br />
For consistency all data is from the Tyndall<br />
report [3] except the capacity <strong>for</strong> Hewett<br />
is doubled given the in<strong>for</strong>mation in the<br />
EEGR report [2]. Injectivity assumptions<br />
in calculations of fill rates use the EEGR<br />
report figures. Other minor differences are<br />
by this study.<br />
In analysing the ability of a single field to<br />
meet demand out to 2030 only four targets<br />
stand out; Leman, Hewett, Indefatigable and<br />
Viking. This is a somewhat simple view given<br />
the ownership issues and multiple plat<strong>for</strong>m<br />
developments actually in place, but is useful<br />
from a trunk pipeline point of view.<br />
The total volumes available appear to be<br />
large, but leaving aside 308mt capacity of<br />
isolated and some low injectivity fields, and<br />
ignoring saline aquifers, the volume available<br />
is 2066 million tonnes. This is sufficient to<br />
meet high end projections out to 2050.<br />
With added sources after 2030 “Low” to<br />
2050 is 1072mt, “High” to 2050 is 1681mt.<br />
The residual storage after 2050 if storage<br />
was at a rate of 50mt/year is about 8 to 20<br />
years. This is not an immediate problem<br />
but consideration needs to be given to the<br />
likelihood that un<strong>for</strong>eseen circumstances<br />
make a large field unavailable, that the<br />
saline aquifers cannot contribute to local<br />
storage capacity, and that other regions<br />
are looking to store CO2 in this area. These<br />
plus options <strong>for</strong> storage after 2050 suggest<br />
that improving surety of local storage and<br />
routes to storage further away are areas<br />
<strong>for</strong> further study.<br />
7.8 pIpELINE ROUTES<br />
We discussed and agreed an assumption<br />
that route landfalls would be at either<br />
Dimlington-Easington or Theddlethorpe<br />
because of the existing facilities <strong>for</strong><br />
compression/pumping plant and a history<br />
of environmental approvals and construction<br />
experience <strong>for</strong> pipelines across the beach<br />
and near shore seabed profiles.<br />
The other major assumption was that<br />
storage site facilities would not be assumed<br />
to have CO2 compression/pumping<br />
equipment due to the cost of maintenance.<br />
The pipeline there<strong>for</strong>e must be able to<br />
deliver at the pressure required near the<br />
point of maximum storage capacity <strong>for</strong> the<br />
field or saline aquifer, at the required flow<br />
rate, though the well may be designed<br />
<strong>for</strong> a higher pressure. Unmanned offshore<br />
facilities are there<strong>for</strong>e possible when the<br />
pipeline pressure rating is sufficient.<br />
Routing design then focused on options<br />
between the two gas terminals and the<br />
major storage opportunities. However<br />
pipelines to those areas pass near to other<br />
smaller fields and it is this which makes the<br />
optimisation more difficult. Notably Leman,<br />
easily the most important area with over<br />
800mt storage, will see Shell looking to<br />
decommission a large part by 2025 whilst<br />
Perenco will continue production past 2030,<br />
thus requiring management to avoid the<br />
risk of interference between gas production<br />
and CO2 storage. Hewett is on the way to<br />
Leman from Theddlethorpe, with as early or<br />
earlier availability, so the obvious plan is to<br />
inject in Hewett until the early 2020s, then<br />
extend the trunk line to Leman. We label this<br />
the HL storage option. Hewitt and Leman<br />
lie south of the saline aquifers and are the<br />
most southerly fields. Additional storage<br />
requirements will need to be met<br />
by extending the route north and east.<br />
Indefatigable lies slightly further away than<br />
Viking and Leman and has an earlier gas<br />
decommissioning date. Given the size of<br />
Leman and dates they are less likely to be<br />
attractive as an extension of the HL storage<br />
option, but is an attractive area to route a<br />
trunk pipeline to as an alternative to Viking<br />
in the first instance. If Viking is used first,<br />
then Indefatigable, including the depleted<br />
Shell area, would be a valuable extension<br />
area once Viking is full. Viking represents the<br />
other major target area <strong>for</strong> trunk pipelines.<br />
Firstly, like Leman, there are closer fields<br />
lying on the route to Viking that offer a<br />
phased development of the pipeline. It is<br />
also overlain by a significant, and potentially<br />
most likely aquifer storage of 1114mt<br />
capacity which could be proven whilst Viking<br />
is used <strong>for</strong> CO2 storage. The problem with<br />
this option is the uncertainty about the use<br />
of saline aquifers, so a routing that picks up<br />
other stores is needed. Beyond Viking the<br />
Indefatigable field offers an excellent store<br />
as an alternative to an aquifer, and would<br />
extend the <strong>network</strong> to near the UK<br />
eastern limits.<br />
The intermediate storages that could be<br />
cheaply served by a pipeline to Viking<br />
include Amethyst E & W then Pickerill,<br />
Barque & Barque South, Galleon and<br />
Audrey, all lying on a line from the Dimlington<br />
/Easington terminal, and similarly from<br />
Theddlethorpe (maybe without Amethyst).<br />
As noted be<strong>for</strong>e some of these fields have<br />
low injectivity and would not be attractive<br />
unless easily served, have low flow rates<br />
and some re-use of facilities occur. This<br />
alignment also opens up future cost effective<br />
pipe options <strong>for</strong> the aquifers 2/48 and<br />
3/48, and Clipper. We label this Viking by<br />
increments route VI.<br />
The residual fields include Victor and Vulcan,<br />
possibly accessed from Leman or a Viking<br />
pipe route and making use of some existing<br />
pipelines, Sean as an eastern outlier and<br />
Schooner well to the north east. Ravenspurn<br />
North may be a special case as it deserves<br />
consideration as a possible step in a link to<br />
the northern North Sea or Schooner and<br />
saline aquifers, or as an opportunity <strong>for</strong> a<br />
pipeline from Dimlington.
Table 7.3 Summary of core routes<br />
Route Total distance km Note<br />
Easington VI 191 Includes Indefatigable<br />
HL 210 Pre 2030 only<br />
Theddlethorpe VI 195 Includes Indefatigable<br />
HL 190 Pre 2030 only<br />
Dimlington Ravenspurn 70<br />
7.9 SUMMARY OF CORE ROUTES<br />
On the basis of simplicity the HL option is<br />
best, particularly if high flow rates occur<br />
quickly and high well and field development<br />
costs mitigate against smaller storage sites.<br />
For uncertain timings of CO2 flows and a<br />
reasonable build up of flow the VI option<br />
appears best. It is possible to see that both<br />
routes would be developed if there is distinct<br />
phasing of the onshore system.<br />
The following lengths include allowances <strong>for</strong><br />
infield pipelines.<br />
The modelling of the filling schemes was<br />
done <strong>for</strong> both the HL and VI routes. Of<br />
particular note was the constraint of<br />
injectivity, meaning that all fields are found<br />
to be in use <strong>for</strong> at least 10 years with more<br />
than one field storing CO2 at all times<br />
after the start, thus mitigating the risk of a<br />
problem with a single field. It may be better<br />
<strong>for</strong> some fields to be further investigated<br />
to see what actual injectivity can be<br />
achieved as in general the timing of pipeline<br />
investment is driven by injection rates, not<br />
the storage capacity of the stores.<br />
Carbon Capture and Storage Network 29<br />
7.10 OFFSHORE ROUTE CHOICE<br />
The onshore design has led to a<br />
preference <strong>for</strong> a route from Theddlethorp.<br />
The choice between the VI and HL routes<br />
was determined by the relative costs,<br />
with VI not requiring early extension to<br />
Indefatigable if the adjacent aquifer is proven<br />
the HL being on average more costly. The<br />
major uncertainty, which affects both, is the<br />
potential use of saline aquifers. If no aquifer<br />
on the VI route is proven then VI would<br />
also be extended to Leman to provide<br />
secure storage. Conversely if the HL route<br />
was chosen the line extensions would be<br />
northwards to Indefatigable, Viking (including<br />
the aquifer), and Barque in order to meet<br />
possible scenarios.<br />
7.11 DECOMMISSIONING OF<br />
OFFSHORE pIpELINES<br />
The lives of the assets included in this<br />
study extend beyond 2050. We assume<br />
that decommissioning would be as is<br />
done <strong>for</strong> existing large diameter pipelines,<br />
which is that they are filled with inhibited<br />
seawater and left in-situ as the best current<br />
practice solution.
30<br />
8.1 DEVELOpMENT OF THE<br />
NETWORK<br />
This transport study is focused on the period<br />
2013 to 2030 to reflect the period in which<br />
key investment decisions in capture plants<br />
and local depleted gas reservoirs will most<br />
strongly interact. It is only focused on the<br />
needs of the Yorkshire and Humber area.<br />
This is in order to obtain a realistic estimate of<br />
the transport cost component of a decision<br />
to invest in carbon capture and storage.<br />
In the bigger picture, such as considered<br />
by the North Sea Task Force, enhanced oil<br />
recovery (EOR) in the northern North Sea,<br />
large scale saline aquifer storage, longer<br />
pipelines, and international trade in storing<br />
CO2 are important considerations. We<br />
assume that on balance these are positive<br />
opportunities <strong>for</strong> the further use of CCS in<br />
the Yorkshire and Humber area, and that<br />
additional and longer term use of CCS will<br />
be possible by extension of the <strong>network</strong> in<br />
the longer term. Too much speculation on<br />
the exact shape of that, beyond the asset life<br />
of the initial capture and storage decisions,<br />
seems unnecessary. However to be safe<br />
we have modelled the assumption that all<br />
the Tier 0 (over 1mt/year) and much of the<br />
smaller emitters up to 2050 do use CCS and<br />
shown that there is sufficient local storage to<br />
accommodate that amount of CO2.<br />
This study does take the simple premise<br />
that the amount of CO2 emissions are as<br />
current emissions plus publicly known<br />
proposals, such as new IGCC plants, plus<br />
correction <strong>for</strong> known short term reduced<br />
emissions due to low plant utilisation.<br />
This means that old plant, destined to be<br />
decommissioned in the study period, is<br />
assumed to be replaced with plant with<br />
the same emissions, and CCS choices are<br />
made at that time. It does not attempt to<br />
model plant outputs or <strong>for</strong> example the<br />
area’s grid export capacity. However factors<br />
such as increased electricity demand are<br />
reflected in the scenarios because plant<br />
replacements are brought <strong>for</strong>ward by<br />
prices and use of CCS with the new plant<br />
is evaluated. Whereas the old gas turbine<br />
or sub critical coal plants would not be<br />
retrofitted <strong>for</strong> CCS.<br />
The presence of oil refinery skills and the<br />
opportunity to build IGCCs means that<br />
not only CO2 but also H2 are more readily<br />
available. The inclusion of the possibility of<br />
H2 pipelines in the routing considerations<br />
is not important to the volume of CO2<br />
Carbon Capture and Storage Network<br />
8.0 DEPLOYMENT SCENARIOS<br />
transported, but is done to enable<br />
alternative investment decisions in base and<br />
peak power matching, chemical plants, and<br />
transport energy planning.<br />
Enhanced oil recovery is perhaps the best<br />
driver <strong>for</strong> CCS, relying as it does more on<br />
oil prices than political decisions about CO2.<br />
The density of sources in the study area<br />
makes it an excellent and secure source <strong>for</strong><br />
a commercial use of CO2. The disadvantage<br />
is the distance from the area to the oil fields.<br />
The proximity of depleted gas reservoirs is a<br />
significant risk reduction <strong>for</strong> sources wanting<br />
a low cost and secure sink <strong>for</strong> their CO2,<br />
against an EOR contract with shorter term<br />
and more onerous supply conditions which,<br />
if transport costs were lower, may offer<br />
lower unit costs. Given that there are other<br />
large sources closer to EOR opportunities<br />
that suffer from more expensive storage<br />
costs we considered that <strong>for</strong> the study<br />
period the area may not be competitive, and<br />
could not rely on, EOR as a sink <strong>for</strong> CO2.<br />
Shipping and long pipes <strong>for</strong> CO2 <strong>for</strong> EOR will<br />
be a potential boost <strong>for</strong> CCS in the region.<br />
Any such reduction in use of the offshore<br />
pipelines in the <strong>network</strong> scenarios is as likely<br />
to be offset by additional opportunities to<br />
transport CO2 from regions around the study<br />
area and in offering a secure sink <strong>for</strong> CO2 as<br />
an alternative to EOR.<br />
With the above in mind the following three<br />
scenarios were developed to bound and<br />
stress the timing and size of the CO2<br />
transport <strong>network</strong>.<br />
The general path of the <strong>network</strong> is depicted<br />
in figure 8.1.<br />
8.2 CENTRAL SCENARIO<br />
Broadly this describes there being no CO2<br />
transported until 2016, with by 2030 10 of<br />
15 Tier 0 sources connected to the <strong>network</strong>.<br />
This reflects a very substantial level of activity<br />
deploying CCS in response to real drivers.<br />
8.2.1 Scenario concept<br />
Principal influences are assumed to drive<br />
initial investment because of:<br />
Figure 8.1 General <strong>network</strong> route showing alternative offshore routes<br />
CASTLEFORD<br />
PONTEFRACT<br />
SCUNTHORPE<br />
HULL<br />
ROUGH<br />
EASINGTON<br />
GRIMSBY<br />
THEDDLETHORPE<br />
AMETHYST<br />
• Phase 3 and 4 of the ETS look as<br />
though CO2 values are in the €30-40/<br />
tonne range.<br />
• The outlook <strong>for</strong> coal prices is <strong>for</strong> 10 to 15<br />
years to remain systematically cheaper<br />
than gas and that Australia has invested<br />
in more capacity.<br />
• EU proposals covering CCS have EU<br />
Parliamentary and majority member state<br />
support, and this is being reflected in<br />
UK legislation both in implementing EU<br />
policy to reduce greenhouse gases and in<br />
implementing the UK Climate Change Act<br />
target. Planning changes to include CO2<br />
pipeline classification to be as strategic<br />
as high pressure gas lines.<br />
RAVENSPURN<br />
PICKERILL<br />
WEST SOLE BARQUE<br />
AUDREY<br />
VI<br />
GALLEON<br />
HL<br />
BACTON<br />
CLIPPER<br />
HEWETT<br />
SCHOONER<br />
VIKING<br />
VICTOR<br />
LEMAN<br />
INDEGATIGABLE<br />
SEAN
• ETS auctioned revenues from 2012 are<br />
used to enable 3, 450MW scale IGCC<br />
demonstration CCS plants and associated<br />
infrastructure in the area operational<br />
by 2020.<br />
• The competing uses <strong>for</strong> generation<br />
investment of nuclear, CCGTs and wind<br />
are not compellingly more attractive in<br />
company portfolios.<br />
• The Yorkshire and Humber area has a<br />
low cost base <strong>for</strong> transport and storage<br />
of CO2 from capture sources.<br />
To maintain a steady growth in CO2<br />
reductions beyond the initial government<br />
encouraged demonstrations and maintaining<br />
the above international market drivers<br />
through the 2020s will be moderated<br />
by factors such as<br />
• Good progress in significantly reducing<br />
the technical risks around capture,<br />
transport and storage. This includes<br />
secure storage, acceptable transport<br />
parameters, and operating up times and<br />
costs <strong>for</strong> the capture technologies.<br />
• Reasonable ability of industry to man<br />
up as nuclear builds match about<br />
present fleet. Sufficient knowledge and<br />
skill development to rank the UK as<br />
an important CCS country. This does<br />
assumes a redirection of ef<strong>for</strong>t from<br />
Olympic Games type work to power coal<br />
and nuclear power station construction<br />
from 2011 on.<br />
• There is a definite shift away from oil<br />
<strong>for</strong> transport points to additional power<br />
generation <strong>for</strong> electric/fuel cell cars, but<br />
biofuels and improved efficiency are<br />
helping meet targets.<br />
• Predictable growth in the local <strong>network</strong><br />
size to maintain good utilisation of pipes<br />
and storage to maintain the Yorkshire<br />
and Humber area as a low cost base <strong>for</strong><br />
transport and storage.<br />
• Good public understanding of the CCS<br />
principles and support <strong>for</strong> the concept.<br />
The long term investment decisions towards<br />
the end of the 2020s will have sufficient<br />
confidence in the following issues:<br />
• The long term energy sources <strong>for</strong> the UK,<br />
including long HVDC links, H2 corridors,<br />
energy <strong>for</strong> transport, and the potential <strong>for</strong><br />
fusion, are understood enough to maintain<br />
changing the existing coal emitters to CCS.<br />
Carbon Capture and Storage Network 31<br />
• However efficient use of coal is becoming<br />
an issue but natural gas CO2 capture is<br />
becoming viable.<br />
• Smaller, varied emitters, such as biomass<br />
CHP plants, and industrial processes have<br />
access to capture technology, and can<br />
benefit from CO2 trading and incentive<br />
schemes, to enable them to capture<br />
CO2 and inject into the low cost<br />
regional infrastructure.<br />
8.3 LOW GROWTH SCENARIO<br />
This describes CO2 flow beginning in 2017,<br />
with 8 of 15 Tier 0 sources transporting by<br />
2030. This illustrates a scale of activity <strong>for</strong><br />
an extensive <strong>network</strong>. It is not a low level of<br />
CCS activity- in the worse case nothing may<br />
be built be<strong>for</strong>e the mid 2020s and there is<br />
there<strong>for</strong>e no need <strong>for</strong> a <strong>network</strong> solution. It<br />
achieves some useful impact by 2030.<br />
8.3.1 Scenario concept<br />
Principle influences are assumed to drive<br />
initial investment because of:<br />
• Phase 3 and 4 of the ETS look as though<br />
CO2 values are in the €15-25/tonne range<br />
because of pressure to relax the National<br />
Allocations because of trade fears and<br />
energy intensive industry lobbying and low<br />
cost post Kyoto CDM type certificates.<br />
• The outlook <strong>for</strong> coal prices is <strong>for</strong> 10 to 15<br />
years to remain cheaper than gas but with<br />
increased volatility.<br />
• EU policies covering CCS are not<br />
mandatory and energy security as the<br />
priority is reflected in UK legislation both<br />
in implementing EU policy to reduce<br />
greenhouse gases and in implementing<br />
the UK Climate Change Act target.<br />
No allowances <strong>for</strong> testing storage integrity<br />
or changes to present planning rules <strong>for</strong><br />
CO2 pipelines.<br />
• ETS auctioned revenues from 2012 may<br />
be used <strong>for</strong> demonstration CCS plants<br />
and associated infrastructure by bidding<br />
in “rounds” of capacity.<br />
• The competing uses <strong>for</strong> generation<br />
investment of nuclear, CCGTs and wind<br />
are more attractive, though companies<br />
want CCS in their portfolios.<br />
• The Yorkshire and Humber area may have<br />
a low cost base <strong>for</strong> transport and storage<br />
of CO2 from capture sources.<br />
To maintain any growth in CO2 reductions<br />
beyond the initial government encouraged<br />
demonstrations and maintaining the above<br />
international market drivers through the<br />
2020s will be moderated by factors such as:<br />
• Progress is made in reducing the<br />
technical risks around capture, transport<br />
and storage by pilot plants. This includes<br />
secure storage, acceptable transport<br />
parameters, but there remains uncertainty<br />
over operating up times and costs <strong>for</strong> the<br />
full scale capture technologies.<br />
• There is a focus on nuclear builds and<br />
internationally the UK is not seen as a<br />
knowledge or skill centre <strong>for</strong> CCS.<br />
• Policy, efficiency and oil price moderation<br />
means there is no additional demand <strong>for</strong><br />
electricity, or hydrogen, <strong>for</strong> transport use.<br />
• Growth in the local <strong>network</strong> size is entirely<br />
driven by specific projects and there is<br />
little <strong>network</strong>ing benefit or capacity to <strong>for</strong><br />
new CCS projects to use.<br />
• Public uncertainty of the CCS principles<br />
and support <strong>for</strong> the concept.<br />
The long-term investment decisions towards<br />
the end of the 2020s will have sufficient<br />
confidence in the following issues:<br />
• The long term energy sources <strong>for</strong> the UK,<br />
including long HVDC links, H2 corridors,<br />
energy <strong>for</strong> transport, and the potential<br />
<strong>for</strong> fusion, are understood enough to<br />
discourage investment in coal CCS.<br />
• Natural gas CO2 capture remains unviable.<br />
• Some smaller, varied emitters, such<br />
as biomass CHP plants and industrial<br />
processes have access to capture<br />
technology and benefits from ETS and<br />
incentive schemes to enable them to<br />
capture CO2, but transport and storage<br />
costs are high.
32 Carbon Capture and Storage Network<br />
8.4 HIGH SCENARIO<br />
In this case the <strong>network</strong> starts to work in<br />
2014, with 12 of the 15 Tier 0 sources<br />
using it by 2030. It illustrates what might be<br />
possible given a very large drive to address<br />
climate change as soon as possible knowing<br />
the positive impact of early action.<br />
8.4.1 Scenario concept<br />
Principal influences are assumed to drive<br />
initial investment because of:<br />
• Phase 3 and 4 of the ETS look as<br />
though CO2 values are in the €45-60/<br />
tonne range.<br />
• The outlook <strong>for</strong> coal prices is <strong>for</strong> 10 to 15<br />
years to remain systematically cheaper<br />
than gas and China’s demand growth is<br />
well matched by supply.<br />
• EU proposals covering CCS have strong<br />
EU Parliamentary and majority member<br />
state support, and are part matched by<br />
China and others. This is reflected in<br />
UK legislation both in implementing EU<br />
policy to reduce greenhouse gases and<br />
in implementing the UK Climate Change<br />
Act and meet energy diversity goals with<br />
specific plans to <strong>for</strong> CCS implementation.<br />
Planning changes to include CO2 pipelines<br />
as strategic and EU cooperation to<br />
develop North Sea storage and EOR.<br />
• UK takes a lead by 2010 to commit<br />
to use ETS auctioned revenues from<br />
2012 to enable 4, 900MW scale IGCC<br />
demonstration CCS plants, 1 oxy fuel and<br />
a second post combustion demonstrator<br />
with associated infrastructures oversized<br />
to encourage more capture projects.<br />
• The competing uses <strong>for</strong> generation<br />
investment of nuclear, CCGTs and wind<br />
are less attractive in company portfolios.<br />
• The Yorkshire and Humber area has a low<br />
cost base <strong>for</strong> transport and storage of<br />
CO2 from capture sources with a strong<br />
cluster of four large demonstration plants<br />
and additional CCS capacity operational<br />
between 2014 and 2020.<br />
To maintain a growth in CO2 reductions<br />
beyond the initial government encouraged<br />
demonstrations and continuing the above<br />
international commodity market drivers<br />
through the 2020s will be moderated by<br />
factors such as:<br />
• Good progress in significantly reducing<br />
the technical risks around capture,<br />
transport and storage. This includes<br />
secure storage, acceptable transport<br />
parameters, and operating up times and<br />
costs <strong>for</strong> the capture technologies.<br />
• Private-public focus on training skills<br />
ability of industry to man up <strong>for</strong> new coal<br />
and nuclear rebuilds. Sufficient knowledge<br />
and skill development to rank the UK a<br />
leading CCS country. Clear redirection<br />
of ef<strong>for</strong>t from Olympic Games type work<br />
to power coal and nuclear power station<br />
construction from 2011 on.<br />
• Low carbon power demand increases<br />
the demand <strong>for</strong> CCS to meet increased<br />
energy replacement of oil <strong>for</strong> transport<br />
by use of hydrogen and electricity.<br />
• Attractive growth in the local <strong>network</strong> size<br />
allows early investment in pipe capacity<br />
and storage and maintains the Yorkshire<br />
and Humber area as a low cost base <strong>for</strong><br />
transport and storage.<br />
• Good public understanding of the CCS<br />
principles and support <strong>for</strong> the concept.<br />
The long-term investment decisions towards<br />
the end of the 2020s will have sufficient<br />
confidence in the following issues:<br />
• The long-term energy sources <strong>for</strong> the UK,<br />
including long HVDC links, H2 corridors,<br />
energy <strong>for</strong> transport, and the potential <strong>for</strong><br />
fusion, are understood enough to make it<br />
easy to decide to invest in CCS.<br />
• Steady improvement in CCS technology<br />
makes better use of coal and natural gas<br />
CO2 capture is viable.<br />
• Smaller, varied emitters, such as biomass<br />
CHP plants, and industrial processes have<br />
access to a range of capture technologies<br />
and are driven by allocation of allowances<br />
and some demonstrator schemes to<br />
enable them to capture CO2 and inject<br />
into the low cost regional infrastructure.<br />
8.5 STAND-ALONE COMpARISON<br />
The alternative to a <strong>network</strong> approach,<br />
particularly initially when driven by individual<br />
projects, is the standalone solution of one<br />
source, transport, and a storage site.<br />
Reviewing the Tier 0 sources, which emit<br />
over 1mt/year, the obviously ideal location<br />
<strong>for</strong> a standalone scheme is the Saltend site.<br />
This has the benefit of being close to the<br />
coast and a gas terminal, with a number<br />
of storage sites as noted in the section on<br />
storage. It is also isolated by the cost of an<br />
estuary crossing to join up with the cluster<br />
of emitters at Immingham. These factors<br />
make it a good test case when compared<br />
to say testing Ferrybridge with a standalone<br />
CCS system.<br />
Saltend was there<strong>for</strong>e used as comparison<br />
case. It is to be stressed that this was done<br />
without any alignment with whatever plans<br />
that site may have, but only to illustrate the<br />
impact of a <strong>network</strong> solution.<br />
An analysis was done <strong>for</strong> the central case<br />
with the three discount rates using the<br />
same cost data. It so happens that in this<br />
case the Tier 0 emissions at Saltend are<br />
assumed to start to be captured in 2023,<br />
as well as the Tier 1 emissions from a<br />
<strong>for</strong>eseen development at the site, both<br />
capturing and storing 90% of the <strong>for</strong>eseen<br />
CO2 emissions, and is assumed to continue<br />
at the same rate to 2050. This gives an<br />
ideal case of a significant flow rate from an<br />
ideal site of 3.1 mt/year. The target storage<br />
site is Ravenspurn which has the required<br />
injectivity <strong>for</strong> the source flows. Note that<br />
Amethyst, West Sole and small depleted<br />
fields are also potential targets. There is<br />
also potential reuse, at least <strong>for</strong> some years,<br />
of existing pipelines and use of offshore<br />
compression. These potentials also apply<br />
to the <strong>network</strong> solution, and to make the<br />
point <strong>for</strong> comparative evaluation both the<br />
standalone and <strong>network</strong> use the same<br />
assumptions of new pipelines and minimal<br />
offshore facilities. Please note that this is<br />
not a statement about any plans that in fact<br />
asset owners in this local area may have.<br />
8.6 SCENARIO QUANTITIES<br />
The flow rates <strong>for</strong> these scenarios is<br />
illustrated in figure 8.2.
As discussed above the flows are primarily<br />
from Tier 0 emitters because their volumes<br />
are the determinant of any sizing of a large<br />
scale transport solution, which in turn will<br />
enable smaller emitters to be connected.<br />
There demonstration and initial plant will<br />
bring learning and cost reduction which will<br />
gradually make the capture of smaller scale<br />
emissions more economic. No scenario<br />
includes Tier 2 flows be<strong>for</strong>e 2030. The<br />
“Low” scenario does not have Tier 1 be<strong>for</strong>e<br />
2030. “Central” and “High” have 0.3mt/year<br />
from 2023 and 2020 respectively, and<br />
“High” has increased Tier 1 flow to 1 mt/<br />
year by 2030.<br />
The cumulative total volumes are as<br />
shown in the table overleaf. Note that<br />
flows are extended through to 2050 based<br />
on continuing the trend in the scenario.<br />
This was done to stress test the <strong>network</strong><br />
capacity and indicates the potential to store<br />
CO2 in the context of the UK targets to<br />
address climate change.<br />
Table 8.1 Cumulative carbon dioxide stored <strong>for</strong> scenarios<br />
Network scenarios – cumulative flows million tonnes<br />
Figure 8.2 Stored carbon dioxide per year <strong>for</strong> scenarios<br />
2014 2015 2016 2017 2018 2019 2020 2021 2022 2023<br />
“Low” 2 4 7 9 15 21 28<br />
“Central” 3 9 16 23 29 38 47 57 68 85<br />
“High” 5 12 28 44 60 76 96 118 144 171<br />
Scenarios – cumulative flow without Saltend<br />
“Low” 2 4 7 9 15 21 28<br />
“Central” 3 9 16 23 29 38 47 57 68 82<br />
“High” 5 12 28 44 60 76 93 112 135 159<br />
Network scenarios – cumulative flows million tonnes<br />
2024 2025 2026 2027 2028 2029 2030 2040 2050<br />
“Low” 37 45 59 76 100 125 149 661 1241<br />
“Central” 109 136 163 194 233 281 328 917 1537<br />
“High” 200 234 273 317 365 418 471 1090 1737<br />
Scenarios – cumulative flow without Saltend<br />
Carbon Capture and Storage Network 33<br />
60<br />
50<br />
40<br />
30<br />
20<br />
10<br />
Low<br />
Central<br />
High<br />
Stored CO2 per year<br />
0<br />
2013 2014 2015 2016 2017 2018 2019 2020 2021 2022 2023 2024 2025 2026 2027 2028 2029 2030<br />
Year<br />
“Low” 37 45 56 71 92 113 135 641 1216<br />
“Central” 103 127 150 179 215 259 303 889 1506<br />
“High” 184 215 251 292 337 387 437 1052 1697
34<br />
9.0 ECONOMICS<br />
9.1 INTRODUCTION<br />
The transport and storage <strong>network</strong> <strong>for</strong><br />
the capture of carbon is focused on the<br />
period 2013 to 2030, which is most likely<br />
to host key investment decisions around<br />
capture plants and local depleted gas<br />
reservoirs. The objective of the economic<br />
analysis is to find a realistic estimate of the<br />
transport cost components (onshore and<br />
offshore) of a decision to invest in carbon<br />
capture and storage. At this stage of the<br />
project, the main emphasis is focused on<br />
costs rather than a comparison between<br />
costs, revenues, financing and benefits.<br />
Decision makers will be left with the issue of<br />
evaluating potential outcomes and choosing<br />
policies to achieve these outcomes in the<br />
presence of the intense complexity of the<br />
CCS <strong>network</strong>. These complexities will not<br />
be captured at this stage, but hope to be<br />
considered in a later stage. Management<br />
options can be developed comparing the<br />
three scenarios (low, central and high)<br />
described here, to cover the range of timing<br />
and scale uncertainty in the development of<br />
a transport system in the study period.<br />
This study refers to the volumes of<br />
transported and stored CO2. Please note<br />
that this is not the same as abated CO2,<br />
the measure of CO2 used in climate change<br />
analysis and national allocation plans which<br />
under pin revenue values of CO2. Abated<br />
CO2 is the net savings in CO2 emissions<br />
from a plant capturing or not capturing<br />
CO2. The difference is the additional energy<br />
used to capture, transport and store the<br />
CO2. This varies substantially between<br />
capture processes, but as it all has to be<br />
transported all figures here refer to stored,<br />
not abated volumes. To a small extent<br />
contaminants will also make the actual<br />
greenhouse gases stored a different amount<br />
than the volumes transported.<br />
Carbon Capture and Storage Network<br />
A context in which to consider the costs in<br />
this study is to look at the general market<br />
<strong>for</strong>ecasts <strong>for</strong> CO2 and CCS. European Union<br />
Allowances (CO2 prices) are <strong>for</strong>eseen in<br />
the 2008 to 2020 period to be €35/tonne<br />
(Deutsche Bank, Global Markets Research<br />
23rd July 2007 and repeated since). In<br />
another analysis by McKinsey <strong>for</strong> Vattenfall<br />
the merit order of abatement costs is plotted<br />
[10] which shows CCS as a large and<br />
necessary component in abating CO2 in<br />
the €25 - €34 tonne CO2 range. Scenario<br />
work by Shell [11] highlights the role of CCS<br />
but suggests needing €50 to €100/tonne<br />
to be commercial.<br />
Looking towards about 2030 under the<br />
Central scenario, with €50/tonne CO2 and<br />
volumes adjusted by a factor of 0.7 <strong>for</strong><br />
abated capture revenues, the economic<br />
activity added by the carbon capture and<br />
storage users of this <strong>network</strong> may amount<br />
to £1.2bn per year.<br />
9.2 COST BENEFIT ANALYSIS<br />
The ideal method of analysis with a project<br />
of this nature is to compare the costs and<br />
benefits of the economic, environmental<br />
and social aspects. The capture, transport<br />
and storage of CO2 is a complex activity<br />
and if the full benefits of the project are not<br />
considered the real value of the scheme will<br />
be undermined. Led by the Stern Review,<br />
there has been an increasing call from<br />
many quarters to subject all government<br />
programs to better cost benefit analysis,<br />
(CBA), because it provides a means of<br />
comparing complex projects, even when<br />
benefits and costs occur during different<br />
time periods. The steering group discussed<br />
this and considered that the wider impact<br />
of CCS on the area needed further study.<br />
Yorkshire Forward there<strong>for</strong>e commissioned<br />
a sustainable development study which will<br />
use input from this transport study.<br />
9.3 UNCERTAINTY IN INpUTS<br />
As noted earlier there are several cost data<br />
uncertainties that may affect this project,<br />
such as the price of steel and the market<br />
<strong>for</strong> lay-barges. These may have large<br />
uncertainties, <strong>for</strong> example +/- 50%, <strong>for</strong><br />
doing work in the near term, let alone in 20<br />
years time. For this study this uncertainty is<br />
mitigated in three ways:<br />
• Firstly there are multiple phases over the<br />
period, with many different components,<br />
so that a distribution of results arises<br />
when combined. This ensures that the<br />
overall cost will be more accurate than<br />
the individual component accuracy.<br />
• Secondly in order to be robust we<br />
have used current technology and new<br />
build infrastructure, and assumed that<br />
there will be no offshore compression<br />
which simplifies the interface to storage<br />
sites. Agreement to enable incremental<br />
investment does require more than one<br />
major emitter to commit, but routes and<br />
especially the onshore pipeline <strong>network</strong><br />
does not require many emitters to commit<br />
in the early stages of the <strong>network</strong>.<br />
• Thirdly the choices made in arriving at<br />
the presented results have been done in<br />
a consistent and comparative way. This<br />
means that it is possible to rework the<br />
IEA Mersey-Dee [14] study to compare<br />
with these figures, though the output<br />
analysis is not immediately comparable<br />
without applying the same assumptions.<br />
Within this study the comparison between<br />
the <strong>network</strong> and standalone figures are<br />
valid, but in doing a business case <strong>for</strong> a<br />
standalone or a project in the <strong>network</strong><br />
different details and timings will give<br />
different actual costs.
9.4 DISCOUNT RATE<br />
The decision to use an appropriate discount<br />
rate to evaluate the cost of CCS is highly<br />
important. There are a variety of discount<br />
rates that could be used in this study.<br />
Choosing the correct rate <strong>for</strong> a cost analysis<br />
or CBA is important because society wishes,<br />
in principle, to undertake a mix of public and<br />
private investments that can maximize social<br />
well-being. To undertake an investment, the<br />
expected return on that investment must<br />
cover all costs (investment, operation and<br />
maintenance costs), including the rate of<br />
interest. Under fairly restrictive assumptions,<br />
one can argue that the investment will<br />
continue until returns across alternatives<br />
are the same and just balance the returns<br />
required by savers. Under these conditions,<br />
one can argue that a single interest rate and<br />
a single rate of return on capital will prevail<br />
throughout the economy. In reality, however,<br />
there are a number of reasons that multiple<br />
rates prevail. The choice facing the decision<br />
maker is which of these many rates may<br />
apply in a CBA.<br />
There are several important points that need<br />
to be considered when we make a decision<br />
on the discount rate:<br />
Higher interest rate verses lower<br />
interest rates – although it is possible to<br />
define the reasons that differentiate interest<br />
rates, it does not mean that choosing a<br />
rate <strong>for</strong> analysis is a simple task. On the<br />
contrary, in the final analysis the choice of<br />
a rate is fairly arbitrary. For this reason, it is<br />
typically the case that individuals who are<br />
in favour of larger government investments<br />
to protect the environment can make<br />
arguments <strong>for</strong> low rates, whereas those who<br />
would prefer less government involvement<br />
in the economy can make equally plausible<br />
arguments <strong>for</strong> higher rates. It is clearly the<br />
case that higher interest rates will lead<br />
to fewer projects presenting positive net<br />
present values than lower ones.<br />
Carbon Capture and Storage Network 35<br />
Un<strong>for</strong>tunately, the arguments used<br />
to support both these positions are<br />
complicated and fail to lead to a definitive<br />
solution. Undertaking an additional public<br />
project will be possible through displacing<br />
private consumption, private investment<br />
or some fraction of both. If one displaces<br />
consumption by undertaking the public<br />
investment, then the appropriate discount<br />
rate is the consumer’s after tax time<br />
preference, a relatively low rate of return.<br />
If one displaces private investment the<br />
investment displaced is at a higher, be<strong>for</strong>e<br />
tax rate of return. Because the purpose of<br />
CBA is to increase public well-being, it does<br />
not want to use parameter variables that<br />
lower the effective national rate of return<br />
on investment or variables that displace<br />
consumption by consumers inappropriately.<br />
There are several approaches that have<br />
been suggested to cope with this problem.<br />
If one knew the proportion at which<br />
the public investment displaced private<br />
investment and private consumption<br />
he/she could weigh the two and <strong>for</strong>m an<br />
average discount rate accordingly. Taking<br />
the above into consideration, perhaps,<br />
more appropriately one could apply a more<br />
complicated model to take into account the<br />
fact that the costs and benefits specifically<br />
related to the displaced private consumption<br />
and displaced private investment occur<br />
at different points in time. In practice,<br />
in<strong>for</strong>mation needed <strong>for</strong> either approach<br />
is generally unavailable. Thus, the debate<br />
appears to return to personal preference <strong>for</strong><br />
public investment.<br />
Inflation – It is difficult to model the range<br />
of expectations, but, unless specifically<br />
defined and modelled, there is implicit rate<br />
within a total discount rate that reduces a<br />
series of numbers over time to a present<br />
value. We currently have a period of low<br />
inflation that sees 1.5 to 3% inflation as<br />
normal. For the purposes of time adjustment<br />
to input costs, and including implicitly within<br />
discount rates a single figure has been used<br />
<strong>for</strong> this study.<br />
Impact of taxes – Conflict in choosing a<br />
rate generally arises over the role that taxes<br />
play in determining interest rates. Because<br />
of corporate income taxes and personal<br />
income taxes, the rate of return on a private<br />
investment is greater than the after tax<br />
return. It is also true that the consumer<br />
after tax rate of return time preference is<br />
lower than the be<strong>for</strong>e tax rate of return. This<br />
means that consumers make the decision<br />
of how much to save based on the after tax<br />
rate of return, while business investors make<br />
the decision of how much to invest based<br />
on be<strong>for</strong>e tax rates of return.<br />
Climate change issues – Debates over<br />
long-term environmental issues such as<br />
global climate change (control of CO2<br />
release) tend to focus on inter-generational<br />
equity, rather than intra-generational<br />
efficiency. The choice of an interest rate is<br />
largely a pursuit to help the public sector<br />
choose investments that will improve the<br />
over-all level of national economic well-being<br />
<strong>for</strong> a given set of consumers and investors.<br />
Many investments take place over long timespans,<br />
some of which are long enough to be<br />
inter-generational. A decision to undertake<br />
CO2 abatement to reduce the probability of<br />
global warming is a decision to <strong>for</strong>go the<br />
increment of consumption or retirement<br />
<strong>for</strong>ever. Moreover, because most benefits<br />
will occur long into the future, almost any<br />
reasonable discount rate, even one reflecting<br />
consumption time preference, rather than<br />
private rate of return, will suggest that the<br />
project is inefficient. For these reasons,<br />
attention turns from efficiency concerns,<br />
getting the right rate of private and public<br />
rates of return, to equity concerns, taking<br />
into account the rights of future generations.<br />
Economists argue generally a social rate<br />
of time preference is appropriate <strong>for</strong> intergenerational<br />
discounting, which would be<br />
composed of two components.
36<br />
The first is a “pure” time preference that<br />
is arguably zero, in the sense that a<br />
significant positive rate would preclude<br />
intergenerational investments. A zero<br />
rate means that the well-being of future<br />
generations is given equal weight to the<br />
well-being of the current generation.<br />
However, due to a second component,<br />
that rate need not be negative. The second<br />
component reflects the fact that future<br />
generations will likely be much better off<br />
economically than the present generation,<br />
even at modest rates of economic growth.<br />
Hence, policies to sacrifice current<br />
consumption in favour of future consumption<br />
essentially transfer wealth from the poorer<br />
current generation to the wealthier future<br />
generation. Thus, a small, but positive social<br />
rate of time preference is justified. This rate<br />
combines the fact that economic growth<br />
will occur, adjusted <strong>for</strong> the fact that marginal<br />
increases in wealth will yield increasingly<br />
smaller increases in economic satisfaction.<br />
Considering these factors a decision was<br />
made to use fairly straight<strong>for</strong>ward discount<br />
rates to compare cost of three different<br />
scenarios which may be visualised as based<br />
on a Bank of England rate of 5%, as:<br />
• A lower, wider economic rate, bearing in<br />
mind the impact that this investment has<br />
on most other future investments (effective<br />
government support).<br />
• A likely rate <strong>for</strong> a transport company well<br />
integrated by ownership and contracts<br />
with the source and sink companies <strong>for</strong><br />
whom this is just a part of an overall<br />
investment in CCS (80% debt).<br />
• A standalone company without any other<br />
interests (70% debt).<br />
However this is only one perspective; the<br />
range of rates is given so that they can be<br />
interpreted from whichever rate is necessary.<br />
The chosen discount rates are 6.5%, 11%<br />
and 14%. If not stated reported figures are<br />
based on an 11% rate.<br />
Carbon Capture and Storage Network<br />
9.5 METHOD AND<br />
INTERpRETATION OF COST<br />
CALCULATIONS<br />
The discounting of costs over time is a way<br />
of reconciling expenditures that occur over<br />
a number of years where you are making<br />
decisions between the attractiveness of<br />
different investments. To do so, all options<br />
are calculated relative to the same year.<br />
Starting with the cost in<strong>for</strong>mation <strong>for</strong> the<br />
<strong>network</strong> we can say that if it was all built in<br />
2008, that is all the pipelines, pumps and<br />
plant, it would cost about £2.0bn. If you<br />
built it in the future we expect some inflation<br />
of those costs, say a long-term average<br />
of 2% per year, so in 2013 the same plant<br />
would cost £2.2bn and <strong>for</strong> the <strong>network</strong><br />
“Central” example with different timing of<br />
parts over the period out to 2040 the cost is<br />
£2.6bn allowing <strong>for</strong> inflation.<br />
However not everything needs to be built<br />
today, so if as a organisation you could<br />
invest some money at the same risk as<br />
spending on the <strong>network</strong>, at say <strong>for</strong> example<br />
11%, until you needed to actually spend it<br />
on the <strong>network</strong>. This return on investment<br />
more than offsets the inflation of costs.<br />
The same applies to the operating costs.<br />
Between 2008 and 2040 these are £6.3bn<br />
at 2008 costs, but obviously most of this<br />
expenditure is many years ahead.<br />
Adding the capital and operating spends<br />
<strong>for</strong> each year, adjusted <strong>for</strong> inflation, the<br />
total cost in 2008 is £8.9bn. But given the<br />
opportunity to invest between now and<br />
when the expenditure actually occurs, at<br />
a rate of 11%, we can discount the future<br />
expenditure by 11% per year. This gets all<br />
the costs of making the decision to invest<br />
in the <strong>network</strong> back to 2008 values which<br />
allows comparison of the concept of a<br />
<strong>network</strong> with alternative ways of transporting<br />
CO2. It also provides data <strong>for</strong> adding to a<br />
business case <strong>for</strong> a full carbon capture and<br />
storage scheme which can then include<br />
revenue, taxation and other issues not<br />
included in this analysis.<br />
Doing this reduces the amount the decision<br />
costs in 2008 to £1.44bn, made up of<br />
£0.75bn capital spend and £0.69bn of<br />
operating costs. The £2bn costing of the<br />
plant if all built now is reduced to £0.75bn<br />
due to time effects. Once you decide what<br />
your discount rate is, in this example 11%,<br />
a cost of £1.44bn, combining capital costs<br />
and operating costs, is there<strong>for</strong>e the correct<br />
way to look at the decision to invest in<br />
the <strong>network</strong>.<br />
To further illustrate this say that no<br />
choice about the whole system was<br />
made until 2015 and the system started<br />
transporting the first CO2 in 2016. In that<br />
case all comparisons are recalculated and<br />
referenced to 2015 pounds and there is less<br />
time <strong>for</strong> the effect of deferred expenditure to<br />
reduce the apparent costs of the decision<br />
in that year. The period considered is still<br />
out to 2040. This is an arbitrary choice of<br />
a 25 year evaluation. Because inflation and<br />
discounting is a rate per year it compounds<br />
so that the present cost of £100 in 2015 but<br />
spent in 2040 is only £12 in 2015 value.<br />
The cost in 2015 can be said to be £2.8bn<br />
expressed in 2015 pounds.<br />
The amount of CO2 transported by the<br />
system can indicate the <strong>network</strong> cost. Care<br />
must be taken in use of this as it depends<br />
on how long the system is operational as<br />
the design life of most of the capital cost is<br />
greater than 25 years the average cost is<br />
reduced by more years of operation. In the<br />
“Central” scenario the amount transported<br />
by 2040 is 846 million tonnes, or 0.85bn<br />
t/CO2.<br />
For a 2008 decision the present cost per<br />
tonne is £1.44bn/0.85btCO2, or £1.7/tonne.<br />
For a 2015 decision the 2015 cost is<br />
£2.8bn/0.85btCO2, or £3.3/tonne in<br />
2015 costs.
The UK is relatively expensive <strong>for</strong> transport<br />
due to the high cost base and the need<br />
to transport offshore. Route lengths are<br />
at least 100km to 400km. This compares<br />
with some US examples where storage<br />
can be adjacent to the site or sold to an<br />
existing EOR pipe <strong>network</strong>. The Yorkshire<br />
and Humber area is however, in UK terms,<br />
attractive <strong>for</strong> the distances required,<br />
especially given the large volumes.<br />
We stress that the revenue to recover this<br />
cost is much greater. A £100 today, with<br />
the same inflation and investment value<br />
as above, is the same present value as<br />
receiving £828 in 25 years. The bulk of<br />
revenue occurs much later than the capital<br />
expenditure, so the effect of its benefit in<br />
present value is also lessened. To illustrate<br />
this <strong>for</strong> the case of 2% inflation and 2%<br />
discount the cost per tonne expressed in<br />
terms of capital and operating cost may be<br />
£1/tonne, but expressed in terms of revenue<br />
timing maybe £5/tonne.<br />
A number of other issues affect revenue<br />
requirements and without a commercial<br />
structure <strong>for</strong> the <strong>network</strong> it is premature<br />
to advise the minimum revenue to recover<br />
the transport costs, but is certainly greater<br />
than the above due to the time difference<br />
between expenditure and revenue. Similarly<br />
a full economic analysis requires the wider<br />
economic benefits to be calculated over<br />
time. The costs in this study can be used<br />
as input costs to those financial and<br />
economic evaluations.<br />
Carbon Capture and Storage Network 37<br />
9.6 RESULTS<br />
Simple analysis of the cost comparison of<br />
high, central and low scenarios of onshore<br />
and offshore CCS is given below.<br />
The capital expenditure, expressed in 2008<br />
terms and shown by cumulative amounts<br />
up to the date given is shown in the table<br />
overleaf.
38 Carbon Capture and Storage Network<br />
Table 9.1 Cumulative capital cost<br />
Cumulative capital cost £ million Cost to accommodate only<br />
pre 2030 sources<br />
Discount Year 2020 2030 2040 2050 2050<br />
Low 725 908 961 725<br />
6.5% Central 825 1,205 1,205 1,205 1,073<br />
High 1,007 1,304 1,304 1,304 1,132<br />
Low 297 434 499 514 434<br />
11% Central 579 763 763 763 708<br />
High 763 899 899 899 827<br />
Low 230 316 349 356 316<br />
14% Central 465 579 579 579 550<br />
The variability of timing in line with growth<br />
of inputs and filling of storage sites gives<br />
rise to some steps in the data. In addition if<br />
only the sources connected to the <strong>network</strong><br />
be<strong>for</strong>e 2030 are served by the <strong>network</strong><br />
through to 2050 then some expenditure just<br />
be<strong>for</strong>e 2030 is not necessary, as well as<br />
capital spend after 2030. The effect of this<br />
reduced capital expenditure is illustrated in<br />
the right hand column of table 9.1.<br />
Table 9.2 Cumulative carbon dioxide stored<br />
High 640 723 723 723 682<br />
For all scenarios the spend to 2050 if all the<br />
<strong>network</strong> was built today is £2bn, but if the<br />
capacity was limited to 2030 flow rates the<br />
costs would vary from £1.3bn to £1.7bn.<br />
Cumulative CO2, million tonnes to date With capital to only accommodate<br />
pre 2030 flow rates<br />
Year 2020 2030 2040 2050 2050<br />
Low 9 149 526 1,072 632<br />
Central 35 314 846 1,450 1,263<br />
High 96 471 1,048 1,681 1,543<br />
The cost per tonne stored is based on<br />
capital costs and operating costs, expressed<br />
as 2008 costs, divided by the cumulative<br />
amount of CO2 stored. The initial flows start<br />
between 2014 and 2018, and <strong>for</strong> a 25 year<br />
project analysis the 2040 figures are the<br />
most relevant, but the 2050 figures are most<br />
relevant <strong>for</strong> climate change targets. The costs<br />
per tonne are shown in the table opposite.
Table 9.3 Cumulative average cost £/tonne<br />
Cumulative average cost £/tonne CO2 stored<br />
Discount Year 2040 2050 2050 only <strong>for</strong> 2030 sources<br />
Low 3.34 1.98 2.85<br />
6.5% Central 3.28 2.21 2.27<br />
High 2.76 1.92 2.02<br />
Low 1.57 0.88 1.30<br />
11% Central 1.71 1.06 1.12<br />
High 1.57 1.01 1.09<br />
Low 1.02 0.53 0.84<br />
14% Central 1.18 0.71 0.76<br />
High 1.16 0.73 0.79<br />
The conclusion is that <strong>for</strong> the central case<br />
by 2040 846 million tonnes would be<br />
transported <strong>for</strong> an average cost of £1.71/<br />
tonne. Due to timing of investments and<br />
design differences the other cases in this<br />
instance have a lower cost per tonne, but<br />
the table shows that different discount rates<br />
have more influence on costs per tonne than<br />
do the differences between scenarios.<br />
If not otherwise noted the costs per tonne<br />
refer to the 2040 volumes and cumulative<br />
costs at 11% discount using £1.70/tonne.<br />
Analysis of the most favourable standalone<br />
case of a near coastal source using just<br />
Ravenspurn North <strong>for</strong> storage from the<br />
same date as the central scenario shows<br />
the following comparison:<br />
Table 9.4 Cumulative average cost £/tonne best stand-alone comparison<br />
Cumulative average cost £/tonne CO2 stored<br />
Year 2040 2050<br />
Ideal standalone 1.83 1.33<br />
Central 1.71 1.06<br />
An inland site has additional pipeline costs<br />
and future business case analysis may show<br />
revenue requirement differences which make<br />
the standalone case less attractive, but the<br />
first emitter to commit to CO2 capture and<br />
storage does face higher costs whether<br />
or not their pipeline becomes part of an<br />
evolving <strong>network</strong>. There is there<strong>for</strong>e a need<br />
to address the problem of <strong>network</strong> initiation.<br />
Carbon Capture and Storage Network 39
40<br />
10.0 CONCLUSION<br />
The first step in meeting the aims of the<br />
Carbon Capture and Storage Partnership<br />
<strong>for</strong> Yorkshire and Humber was to focus<br />
work on the economic costs of the transport<br />
component, excluding capture and storage<br />
costs, of a carbon capture and storage<br />
(CCS) area <strong>network</strong> solution serving multiple<br />
sources and offshore geological storage.<br />
The major commercial concern regarding<br />
CCS is uncertainty of the value of CO2. For<br />
a particular plant the major cost decision<br />
faced by an individual plant operator is that<br />
required to capture their CO2, as the capture<br />
largest cost component of CCS. This study<br />
does not address the value or revenue or<br />
accounting aspects of CCS.<br />
This study provides a regional level transport<br />
feasibility study. It shows that a <strong>network</strong><br />
decision at an economic level is relatively<br />
cost attractive, which is important in terms<br />
of choices regarding what the UK should<br />
do to reduce CO2 emissions.<br />
The inputs <strong>for</strong> individual investments<br />
cascade down from a global level, well<br />
beyond local concerns, but what can be<br />
achieved at regional level is the provision of<br />
a route and storage option <strong>for</strong> a local emitter<br />
considering capture of their CO2.<br />
Carbon Capture and Storage Network<br />
The amount of storage near to Yorkshire<br />
and Humber is large, but not much larger<br />
than the potential maximum supply from the<br />
region to 2050, or if emitters from outside<br />
the region decide to store CO2 in the same<br />
area of the southern North Sea. Even<br />
though the potential <strong>for</strong> use of depleted<br />
gas fields is very good, access, injectivity<br />
and volumes require to be confirmed.<br />
Furthermore, there is a definite need to<br />
establish the availability or otherwise of<br />
saline aquifer storage. The preferred offshore<br />
routing reduces access costs to the larger<br />
aquifers, 2 or routes to enough depleted<br />
gas fields to accommodate output from<br />
emitters starting to capture be<strong>for</strong>e 2030 and<br />
continuing to store until 2050. To have the<br />
most security of choice <strong>for</strong> local storage,<br />
including post 2050 storage, without use of<br />
deep saline aquifers, all the large depleted<br />
gas fields are needed to meet the CO2<br />
capture scenarios.<br />
To develop a CCS <strong>network</strong> to service more<br />
than one plant, the additional issues of<br />
transport and storage of CO2 need to be<br />
in place to support an investment decision<br />
on CO2 capture at multiple sites.<br />
The next steps to do this are described<br />
in the recommendations section.<br />
Considering what commitment is required to<br />
create a <strong>network</strong> some of the choices within<br />
the scenarios suggests that a general aim to<br />
deploy CCS at large scale is important as it<br />
enables economies of scale. However, the<br />
detailed timing and level of emissions from<br />
a single source are only important over a<br />
shorter term, i.e. within about a 5 to 7 year<br />
window. In other words in the short term the<br />
sizing and routing decisions are affected by<br />
significant (>200,000t/year) volumes. Thus<br />
long-term commitments enables pipelines,<br />
generic way leave planning and agreements<br />
on storage sites, short term commitments<br />
enables incremental pipe sizing and offshore<br />
well developments.<br />
The initiation of a <strong>network</strong> remains a<br />
particularly difficult problem as the first<br />
user takes a much higher risk and greater<br />
costs than someone joining after it is<br />
well established.<br />
A key recommendation is to address how<br />
to provide the first parts of the <strong>network</strong>.<br />
The main thrust is to aim to re-use existing<br />
infrastructure when the first commitment<br />
is relatively small. This must reduce costs<br />
and will also have value if it can defer costs.<br />
The uncertainties include timing, technical<br />
suitability, decommissioning and ownership<br />
transfers or agreement on asset costs, store<br />
licensing and liabilities
A second part of this initial phase, and<br />
<strong>for</strong> each large capacity increase, will be<br />
the aggregation of commitments. For this<br />
we see the Carbon Capture and Storage<br />
Partnership <strong>for</strong> Yorkshire and Humber as the<br />
starting point.<br />
Looking to the local community,<br />
communication and engagement will<br />
have to develop so that the benefits are<br />
understood and people have the facts<br />
available when particular questions and<br />
consultations arise so that timely and<br />
appropriate decisions are made.<br />
Outward communication and awareness<br />
will also be important. Firstly to attract a<br />
cluster of early CCS projects, secondly to<br />
ensure national political support and thirdly,<br />
because of the excellent potential to do so,<br />
to materially contribute to meeting the UK’s<br />
climate change targets.<br />
Stern states that a disproportionately<br />
large share of the burden <strong>for</strong> achieving<br />
the required cuts will have to be borne by<br />
the power-generation sector (Reference 1<br />
pxiii):“Large-scale uptake of a range of clean<br />
power, heat, and transport technologies<br />
is required <strong>for</strong> radical emission cuts in the<br />
medium to long term. The power sector<br />
around the world will have to be at least<br />
60%, and perhaps as much as 75%,<br />
decarbonised by 2050 to stabilise at or<br />
below 550ppm CO2e.” Given the substantial<br />
power sector in the Yorkshire and Humber<br />
region the scale of the transport <strong>network</strong><br />
covered by this study will support<br />
this requirement.<br />
Carbon Capture and Storage Network 41<br />
The range of scenarios <strong>for</strong> the <strong>network</strong><br />
covers transport of, in total, between 150<br />
and 470 million tonnes carbon dioxide by<br />
2030 and by 2050 between 630 million<br />
tonnes (with no further sources added after<br />
2030) to 1700 million tonnes (with high and<br />
continuing CCS after 2030).<br />
The capital cost spend is about £2.0<br />
billion if it was all built today, but spreading<br />
expenditure over time and adjusting <strong>for</strong><br />
inflation, the present cost of a decision to<br />
build a <strong>network</strong> depends on the discount<br />
rate you choose to apply, but <strong>for</strong> a 6.5%<br />
discount the capital costs vary by scenario<br />
from £0.7bn to £1.0bn, and with a 14%<br />
discount rate the present cost of the<br />
decision is to spend £0.3bn to £0.6bn.<br />
The “Central” scenario and 11% discount<br />
gives a £0.7bn present cost.<br />
Operating costs are also modelled and<br />
the combined capital and operating spend<br />
divided by the amount of carbon dioxide<br />
transported is used to calculate the present<br />
value using a range of discount rates<br />
to reflect the time and risk value of the<br />
expenditure. These costs, as explained<br />
previously, are not the revenues required.<br />
The cost per tonne transported is<br />
there<strong>for</strong>e dependent on how long the<br />
system operates and under what financial<br />
assumptions, but <strong>for</strong> a fixed asset<br />
maximising volumes per year means lower<br />
costs per tonne and a longer period are<br />
cheaper per tonne. However cutting the<br />
period of consideration to from about 2015<br />
to 2040, about 25 years of operation, the<br />
unit costs are more representative, though<br />
we are still only in 2008. The different<br />
scenarios, <strong>for</strong> a given discount rate, show<br />
very little difference in unit costs. For<br />
example <strong>for</strong> an 11% discount rate the cost<br />
per tonne varies from £1.5 to £1.7/tonne.<br />
Due to investment timing the “Central”<br />
scenario has the higher rate, and that<br />
cost of £1.70/tonne has been used as the<br />
illustrated result. The conclusion is that the<br />
discount rate is more important than the<br />
scenarios when looking at transport costs<br />
per tonne.<br />
Given a range of discount rates of 6.5%<br />
to 14% the costs per tonne of £1.2/tonne<br />
($2.1, €1.6/tonne) to £3.4/tonne ($6,<br />
€4.7/tonne), with a mid point of 11% of a<br />
round £1.7/tonne ($3.1, €2.4/tonne) CO2<br />
transported as at 2008 <strong>for</strong> the period 2015<br />
to 2040.
42<br />
The recommendations following this study<br />
are detailed and specific to the aims of the<br />
Carbon Capture and Storage Partnership<br />
<strong>for</strong> Yorkshire and Humber. Though this<br />
report shows the benefits of large scale<br />
co-operation in addressing climate change<br />
using CCS, it rests on effective initiation<br />
to the ability to transport CO2. This will<br />
best be enabled by a cluster of projects,<br />
driven by UK government policy and other<br />
mechanisms, to quickly reduce both capture<br />
costs, transport and storage costs. Strategic<br />
leadership at the highest level is required<br />
to ensure that this project develops at the<br />
necessary pace and scale to contribute<br />
to the draft Climate Change bill target to<br />
cut CO2 emissions compared to 1990 by<br />
26% to 32% by 2020. Potentially, it could<br />
capture a significant proportion of those<br />
emissions by 2020. The recommendations<br />
are grouped as follows:<br />
Carbon Capture and Storage Network<br />
11.0 RECOMMENDATIONS<br />
11.1 GOVERNMENT<br />
Yorkshire Forward promote a cluster of CCS<br />
projects to be an early material action in<br />
addressing climate change and justify an<br />
efficient CO2 transport and storage system<br />
driven by the co-operation by the capture<br />
site organisations and public bodies.<br />
The UK government, through whatever<br />
process including zero emissions power<br />
projects, funding support, provision of<br />
infrastructure or other means, designate a<br />
cluster approach apply to the first phase<br />
of CCS projects in the UK demonstrating<br />
CCS at least at the scale of the current<br />
demonstration proposal. This should be<br />
in line with at least the time scales of the<br />
“Central” scenario with operation in 2016 in<br />
order to materially address the cumulative<br />
emissions of CO2 from this country.<br />
An early decision is needed to establish a<br />
long-term, secure funding stream from UK<br />
revenues derived from the EU Emissions<br />
Trading Scheme, both in phase II and phase<br />
III of the ETS to deploy CCS.<br />
Provide further evidence of regional<br />
CCS benefits.<br />
Enable regulation to secure way leaves in<br />
the same way as <strong>for</strong> natural gas pipelines.<br />
Progress the ability to transport and store<br />
CO2 from non-UK sources.<br />
11.2 ECONOMIC WORK<br />
Cost benefit analysis on the sustainable<br />
development of CCS; this has already been<br />
initiated by Yorkshire Forward.<br />
Adopt or develop example business cases<br />
<strong>for</strong> the complete CCS activity including<br />
capture and storage to illustrate public<br />
discussions <strong>for</strong> a number of Tier 0 (Over<br />
1m tonne/year) emitters with CO2 value<br />
and various financial assumptions using the<br />
<strong>network</strong> transport costs as an input.<br />
Evaluate the potential to reduce the initial<br />
costs of establishing the <strong>network</strong> by re-use<br />
of existing infrastructure.<br />
Develop the value added aspects of CCS<br />
including enhanced oil recovery, shared use<br />
of way leaves, synergy of decommissioning<br />
gas fields, importation of CO2 <strong>for</strong> storage,<br />
physical offsetting between sources on the<br />
<strong>network</strong>, and impacts <strong>for</strong> smaller emitters.<br />
More detailed scenarios to understand the<br />
possible scope and benefits <strong>for</strong> the local<br />
supply of H2 via pipeline to conveniently<br />
located smaller power and combined<br />
heat and power installations to demonstrate<br />
the possibilities.<br />
Linear programming and sensitivity analysis<br />
to show the most effective project scenario,<br />
fundamental variables and incremental<br />
benefits or impacts from manipulating<br />
project variables.
11.3 TECHNICAL<br />
Research into offshore storage site<br />
availability: viability of depleted gas fields,<br />
current decommissioning details, dates of<br />
use, possibility of using existing pipelines,<br />
wells and structures, and likely monitoring<br />
issues and approaches.<br />
Research into southern North Sea saline<br />
aquifers; identify uncertainties associated<br />
with them and the methods, timescales and<br />
costs to prove them as stores <strong>for</strong> CO2.<br />
Further investigation of selected fields<br />
to model what actual injectivity can be<br />
achieved to determine the costs and<br />
benefits of field investment and timing<br />
of transport links.<br />
11.4 CARBON<br />
Research into carbon footprint of whole<br />
CCS <strong>network</strong> from each plant to storage:<br />
calculate how much carbon will be used in<br />
the whole process i.e. including converting<br />
plants/capture/transport/storage. Abated<br />
value analysis compared to stored costs.<br />
Evaluate CCS compared to improved<br />
demand side/efficiencies, nuclear, CHP<br />
and renewable energy as a low carbon<br />
energy source.<br />
Carbon Capture and Storage Network 43<br />
11.5 SOCIAL<br />
Research into public and industry<br />
perceptions of CCS; how current population<br />
feels/how to increase knowledge/how to<br />
improve perception etc.<br />
More detailed research into environmental<br />
impacts of CO2 transport, both pipelines<br />
and shipping.<br />
Further research into detailed benefits both<br />
social/environmental it will bring to region<br />
as a whole.<br />
11.6 SAFETY<br />
Continue support <strong>for</strong> the health and safety<br />
work of the CCSA and UKCCSC.<br />
Detailed safety case of CO2 transportation<br />
onshore including consultation with the HSE.<br />
The issues of a shared way-leave between<br />
CO2, natural gas and H2 pipes be<br />
understood and, <strong>for</strong> certain routes, wayleaves<br />
are designed with this option in mind.
44<br />
12.0 CCS GLOSSARY<br />
Anthropogenic source Source which is man-made as opposed to natural.<br />
Aquifer Geological structure containing water and with significant permeability to allow flow; it is bound by seals.<br />
BAT Best available technology<br />
Carbon Capture A process by which CO 2 is extracted from flue gases <strong>for</strong> the purposes of sequestering the carbon rather than<br />
releasing into the atmosphere.<br />
Carbon Dioxide (CO 2 ) A colourless, odourless gas that is produced by respiration or the combustion and decomposition of carboncontaining<br />
materials. Carbon dioxide is essential to the photosynthesis process that sustains plant and animal life,<br />
however, it can accumulate in the air and trap heat near the Earth’s surface (the “greenhouse effect”).<br />
CCGT Combined Cycle Gas Turbine.<br />
CCS Carbon Capture and Storage, sometimes referred to as Carbon Capture and Sequestration.<br />
COMAH Control Of Major Accident Hazards. Major UK legislation governing chemical plants, refineries and power plants.<br />
Depleted Reservoir Refers to a hydrocarbon reservoir oil or gas that has had the economically recoverable hydrocarbon removed.<br />
HVDC High Voltage Direct Current. Means of connecting power stations to the national grid.<br />
EOR Enhanced Oil Recovery. In EOR fluids such as water and carbon dioxide are injected in to hydrocarbon reservoirs<br />
to enable the hydrocarbon to be extracted.<br />
EU-ETS European Union Emissions Trading Scheme. Process by which the allocation of carbon dioxide emission<br />
allowances <strong>for</strong> an emitter can be traded <strong>for</strong> users with excess allowable emissions to those with who require<br />
higher allowances.<br />
GHG Greenhouse Gas.<br />
H 2 S Hydrogen sulphide, a pungent gas produced when sulphur containing material such as coal is burnt. The gas<br />
exists in small volumes in flue gases from combustion processes.<br />
IEA GHG International Energy Agency Greenhouse Gas Programme.<br />
IGCC Integrated Combined Cycle. A pre-combustion process <strong>for</strong> the use of coal <strong>for</strong> power generation encompassing<br />
carbon capture.<br />
IPCC Intergovernmental Panel on Climate Change.<br />
kWh Kilo Watt Hour.<br />
NOx The group of chemicals nitrogen oxides including nitrogen dioxide, common contaminant found in flue gases of<br />
combustions processes.<br />
OEM Operational Engineering Manager.<br />
Carbon Capture and Storage Network<br />
OSPAR Oslo Paris Convention. 1992 agreement guiding international co-operation on the protection of the marine<br />
environment of the north east Atlantic.<br />
Post-Combustion Capture A system <strong>for</strong> CO 2 capture from a fossil fuel conversion/combustion where the fuel is combusted in air<br />
and resulting CO 2 is scrubbed, absorbed, or otherwise captured from the flue gas, which is primarily CO 2<br />
and nitrogen.
Pre-Combustion Capture A system <strong>for</strong> CO 2 capture from a fossil fuel conversion where the fuel is decarbonised via gasification, pyrolysis,<br />
or re<strong>for</strong>ming prior to combustion. The synthesis gas from de-carbonatisation is primarily a mixture of CO 2 and<br />
hydrogen. The CO 2 is captured from the hydrogen be<strong>for</strong>e the hydrogen is combusted.<br />
PSR Pipeline Safety Regulations.<br />
Reservoir A subsurface, porous, permeable rock body surrounded by impermeable rock and containing oil, gas, or water.<br />
Most reservoir rocks consist individually or collectively of limestone, dolomites, or sandstone.<br />
Saline Also referred to as Brine. A solution of water and sodium chloride, common salt, other metal salts may also be<br />
present. Saline/brine requires extensive desalination treatment be<strong>for</strong>e it could be consumed as drinking water.<br />
Saline Aquifer Geologic <strong>for</strong>mation of porous rock that is filled with saline/brine.<br />
Carbon Capture and Storage Network 45<br />
SOx The group of chemicals sulphur oxides including sulphur dioxide, sulphur trioxide, common contaminants found<br />
in flue gases from sulphur bearing fuels.<br />
Stern Review Titled “The Economics of Climate Change”, the Stern Review, commissioned by the UK Government and led<br />
by renown economists Sir Nicholas Stern. The report examined the economic impact of climate change based<br />
on projections up to 2006, predicting cost of predicted changes to the global economy in addition to cost<br />
comparisons <strong>for</strong> abatement options.<br />
ZEP Zero Emissions Plat<strong>for</strong>m. EU programme to enable European fossil fuel power plants to have zero CO 2 emissions<br />
by 2020.
46<br />
1. STERN REVIEW: The Economics of Climate Change www.<br />
sternreview.org.uk. HM Treasury 30 Oct 2006<br />
2. Report on Infrastructure, Availability and Costs <strong>for</strong> CO2<br />
Transportation and Storage Offshore – Southern North Sea, East<br />
of England Energy Group (EEEGR), Feb 2006<br />
3. An assessment of carbon sequestration potential in the UK<br />
– Southern North Sea case study. By Michelle Bentham, Tyndall<br />
Centre <strong>for</strong> Climate Change Research and British Geological<br />
Survey. Tyndall Centre Working Paper No. 85, January 2006<br />
4. Storing CO2 under the North Sea Basin, A key solution <strong>for</strong><br />
combating climate change. A report by the North Sea Basin Task<br />
Force, June 2007. By the Norwegian Ministry of Petroleum and<br />
Energy and the UK Department of Trade and Industry, June 2007<br />
5. Development of a CO2 transport and storage <strong>network</strong> in the<br />
North Sea. A report to the North Sea Basin Task Force. In<br />
association with Element Energy Limited, Pöyry Energy, British<br />
Geological Survey, UK Department <strong>for</strong> Business Enterprise &<br />
Regulatory Re<strong>for</strong>m, November 2007<br />
6. IPCC Specail Report on carbon dioxide Capture and Storage,<br />
IPCC, Cambridge University Press, Cambridge, 2005<br />
7. 4th Assessment Report: Climate Change 2007, IPCC,<br />
Cambridge University Press, 2007<br />
8. http://www.encoreoil.co.uk/pages/news/index<br />
asp?NewsID=107<br />
Carbon Capture and Storage Network<br />
REFERENCES & APPENDICES<br />
9. EU research on use of hydrogen, quote from press release<br />
and HyWays report<br />
http://ec.europa.eu/research/energy/nn/nn_pu/hyways/<br />
article_0001_en.htm and at http://www.hyways.de/<br />
10. Vattenfall AS at http://www.vattenfall.com/www/ccc/ccc/<br />
569876nextx/573533globa/index.jsp and in McKinsey<br />
Quarterly 2007 No1. mckinseyquarterly.com<br />
11. Shell scenarios 2005 at www.shell.com and presentation at the<br />
Society of Petroleum Engineers in London, January 2008<br />
12. http://www.encoreoil.co.uk/pages/news/index.<br />
asp?NewsID=107<br />
13. Meeting the Energy Challenge – A white paper on energy – DTI<br />
– May 2007<br />
14. Feasibility Study on the distributed collection and transmission<br />
of CO2 – Gastec at Cre – Oct 2006<br />
15. The EU flagship programme – ZEP – Oct 2007<br />
16. Capturing CO2 – IEA Greenhouse gas R & D programme –<br />
May 07<br />
17. Dynamis CO2 Qulaity recommendations, de Visser, E et al.<br />
Ecofys, Dynamis Consortium 2006-2009, 2008
APPENDICES<br />
Appendix A<br />
Regional map<br />
Carbon Capture and Storage Network 47
48<br />
Appendix B<br />
Study<br />
ID No.<br />
NAp<br />
ID<br />
Operator<br />
Name<br />
1 328 Drax Power Ltd Drax Power Station<br />
PO Box 3<br />
Selby<br />
North Yorkshire<br />
YO8 8PQ<br />
Installation Address EU-ETS<br />
Sector<br />
2 332 British Energy Eggborough Power Station<br />
Eggborough<br />
Goole<br />
East Yorkshire<br />
DN14 0BS<br />
3 1 Corus UK Ltd Scunthorpe Integrated Iron &<br />
Steel Works<br />
Scunthorpe Works<br />
PO Box 1<br />
Brigg Road<br />
Scunthorpe<br />
North Lincolnshire<br />
DN16 1BP<br />
4 325 Scottish and Southern<br />
Energy Ltd<br />
Ferrybridge “C” Power<br />
Station<br />
P.O Box 39<br />
Stranglands Lane<br />
Knottingley<br />
West Yorkshire<br />
WF11 8SQ<br />
5 369 International Power Saltend Cogeneration<br />
Company Limited<br />
Saltend<br />
Hedon Road<br />
Hull HU12 8GA<br />
6 348 CENTRICA SHB Ltd Centrica SHB Ltd<br />
South Humber Bank<br />
Power Station<br />
SOUTH MARSH ROAD<br />
STALLINGBOROUGH<br />
NORTH EAST<br />
LINCOLNSHIRE<br />
DN41 8BZ<br />
7 2254 Immingham CHP<br />
Limited Liability<br />
Partnership<br />
Immingham CHP Power<br />
Station<br />
Immingham CHP<br />
Immingham CHP<br />
Rosper Road<br />
Immingham<br />
North Lincolnshire<br />
DN40 3DZ<br />
8 4077 ConocoPhillips Limited Humber Refinery<br />
Eastfield Road<br />
South Killingholme<br />
IMMINGHAM<br />
North Lincolnshire<br />
DN40 3DW<br />
9 360 E.ON UK plc Killingholme power station<br />
Killingholme power station<br />
PO Box 11<br />
Immingham<br />
Grimsby<br />
NE Lincolnshire<br />
DN40 3NG<br />
10 2960 Total UK Limited Lindsey Oil Refinery<br />
Eastfield Road<br />
North Killingholme<br />
Immingham<br />
North Lincolnshire<br />
DN40 3LW<br />
11 357 Scottish and Southern<br />
Energy Ltd<br />
Carbon Capture and Storage Network<br />
Keadby Power Station<br />
Keadby Power Station<br />
Trentside<br />
Keadby<br />
Scunthorpe<br />
North Lincolnshire<br />
DN17 3EF<br />
Large Electricity<br />
Producers<br />
Large Electricity<br />
Producers<br />
Tier 0<br />
tpa<br />
Tier 1<br />
tpa<br />
Tier 2<br />
tpa<br />
>1M 50k - 1M
Appendix B<br />
Study<br />
ID No.<br />
NAp<br />
ID<br />
Operator<br />
Name<br />
12 358 Centrica Generation<br />
Limited<br />
Installation Address EU-ETS<br />
Sector<br />
Centrica Energy Killingholme<br />
Power Station<br />
Chase Hill Road<br />
North Killingholme<br />
Immingham<br />
North Lincolnshire<br />
Dn40 3eh<br />
101 366 Centrica Brigg Ltd Glan<strong>for</strong>d Brigg Generating<br />
Station<br />
Scawby Brook<br />
Brigg<br />
North Lincolnshire<br />
DN20 9LT<br />
102 640 CEMEX UK Cement<br />
Limited<br />
South Ferriby Works<br />
South Ferriby Cement Plant<br />
South Ferriby<br />
Barton-Upon-Humber<br />
North Lincolnshire<br />
DN18 6JL<br />
103 662 Singleton Birch Limited Melton Ross Limeworks<br />
Melton Ross Quarries<br />
Melton Ross Quarries<br />
Barnetby<br />
North Lincolnshire<br />
DN38 6AE<br />
104 93 Humber Energy Limited Humber Energy Limited<br />
Grimsby Power Station<br />
PO Box 24<br />
Great Coates<br />
Grimsby<br />
North East Lincolnshire<br />
DN31 2SS<br />
105 691 Redfearn Glass Ltd Redfearn Glass Ltd<br />
Burton Road<br />
Monk Bretton<br />
Barnsley<br />
South Yorkshire<br />
S71 2QG<br />
106 23 CORUS UK LIMITED CORUS ENGINEERING<br />
STEELS - ROTHERHAM<br />
ROTHERHAM WORKS<br />
ROTHERHAM WORKS<br />
PO BOX 5<br />
ALDWARKE LANE<br />
ROTHERHAM<br />
SOUTH YORKSHIRE<br />
S6O 1DW<br />
107 2454 Guardian Industries<br />
UK Ltd<br />
Guardian Industries UK Ltd<br />
Goole<br />
Rawcliffe Road<br />
Goole<br />
East Riding of Yorkshire<br />
DN14 8GA<br />
108 127 BP Chemicals Ltd BP Chemicals Ltd, Hull<br />
Saltend<br />
Hull<br />
East Yorkshire<br />
HU12 8DS<br />
109 2522 NPOWER COGEN<br />
LIMITED<br />
TIOXIDE GRIMSBY CHP<br />
PLANT<br />
HUNTSMAN TIOXIDE<br />
GRIMSBY<br />
MOODY LANE<br />
GRIMSBY<br />
NORTH EAST<br />
LINCOLNSHIRE<br />
DN31 2SW<br />
110 2788 Rockware Glass Rockware Glass - Wheatley<br />
Wheatley<br />
Rockware Glass<br />
Barnby Dunn Road<br />
Doncaster<br />
South Yorkshire<br />
DN2 4RH<br />
Carbon Capture and Storage Network 49<br />
Large Electricity<br />
Producers<br />
Large Electricity<br />
Producers<br />
Tier 0<br />
tpa<br />
Tier 1<br />
tpa<br />
Tier 2<br />
tpa<br />
>1M 50k - 1M
50<br />
Appendix B<br />
Study<br />
ID No.<br />
NAp<br />
ID<br />
Operator<br />
Name<br />
111 283 Millennium Inorganic<br />
Chemicals Ltd.<br />
112 249 E.ON UK Cogeneration<br />
Ltd<br />
113 2811 Saint-Gobain Glass<br />
UK Ltd.<br />
114 2748 E.ON UK Cogeneration<br />
Ltd<br />
Installation Address EU-ETS<br />
Sector<br />
CHP Plant<br />
Millennium Inorganic<br />
Chemicals Ltd.<br />
Laporte Road<br />
Stallingborough<br />
Grimsby<br />
NE Lincs<br />
DN40 2PR<br />
Thornhill power station<br />
Calder Road<br />
Ravensthorpe<br />
Dewsbury<br />
West Yorkshire<br />
WF12 9EA<br />
Saint-Gobain Glass UK Ltd.<br />
Eggborough Plant<br />
Weeland Road<br />
Eggborough<br />
East Riding of Yorkshire<br />
DN14 0FD<br />
Castle<strong>for</strong>d Power Station<br />
Castle<strong>for</strong>d Power Station<br />
Wheldon Road<br />
Castle<strong>for</strong>d<br />
West Yorkshire<br />
WF10 2JT<br />
115 2216 Centrica Storage Ltd Centrica Storage Ltd<br />
Easington Terminal<br />
Dimlington Road<br />
Easington, Nr. Hull<br />
East Yorkshire<br />
HU12 0SX<br />
116 2840 Viking UK Gas Limited Knapton Generating Station<br />
Knapton Generating Station<br />
Knapton Generating Station<br />
East Knapton<br />
Malton<br />
North Yorkshire<br />
YO17 8JF<br />
117 148 Ciba Specialty<br />
Chemicals Water<br />
Treatments Ltd<br />
Ciba Specialty Chemicals Ltd<br />
- Brad<strong>for</strong>d<br />
Brad<strong>for</strong>d<br />
P. O. Box 38<br />
Low Moor<br />
Brad<strong>for</strong>d<br />
West Yorkshire<br />
BD12 OJZ<br />
118 703 Rockware Glass Rockware Glass - Headlands<br />
Headlands<br />
Headlands Lane<br />
Knottingley<br />
West Yorkshire<br />
WF11 0HP<br />
119 142 British Sugar Plc York Sugar Factory<br />
P.O. Box 17<br />
Boroughbridge Road<br />
York<br />
North Yorkshire<br />
YO26 6XF<br />
120 129 BP Exploration<br />
Operating Company Ltd<br />
Carbon Capture and Storage Network<br />
Dimlington-Easington Shore<br />
Terminal<br />
Dimlington-Easington Shore<br />
Terminal<br />
Easington<br />
Kingston upon Hull<br />
East Riding of Yorkshire<br />
HU12 0ST<br />
Tier 0<br />
tpa<br />
Tier 1<br />
tpa<br />
Tier 2<br />
tpa<br />
>1M 50k - 1M
Appendix B<br />
Study<br />
ID No.<br />
NAp<br />
ID<br />
Operator<br />
Name<br />
121 289 Syngenta Limited Syngenta Limited<br />
Huddersfield<br />
PO Box A38<br />
Leeds Road<br />
HUDDERSFIELD<br />
West Yorkshire<br />
HD2 1FF<br />
122 683 Allied Glass Containers<br />
Ltd<br />
Installation Address EU-ETS<br />
Sector<br />
Allied Glass Containers Ltd<br />
- Leeds<br />
Leeds Works<br />
South Accomodation Road<br />
Leeds<br />
West Yorkshire<br />
LS10 1NQ<br />
123 182 Georgia Pacific GB Ltd Oughtibridge Mill<br />
Georgia-Pacific GB Ltd,<br />
Oughtibridge Mill<br />
Main Road, Wharncliffeside,<br />
Oughtibridge<br />
SHEFFIELD<br />
South Yorkshire<br />
S35 0DN<br />
124 2614 Dalkia Utilities Services Leeds Infirmary Generating<br />
Station Complex<br />
Leeds Infirmary<br />
Clarendon Way<br />
Leeds<br />
West Yorkshire<br />
LS1 3EX<br />
125 8 The Monckton Coke and<br />
Chemical Company Ltd<br />
The Monckton Coke and<br />
Chemical Company Ltd<br />
Lundhil Lane<br />
Royston<br />
Barnsley<br />
South Yorkshire<br />
S71 4BE<br />
126 2831 Scottish Courage Ltd John Smith’s Brewery,<br />
Tadcaster<br />
The Brewery<br />
Tadcaster<br />
North Yorkshire<br />
LS24 9SA<br />
127 2381 Elyo UK Industrial Nestlé York CHP<br />
Nestlé York<br />
Nestle Rowntree<br />
61 Wigginton Road<br />
York<br />
YO1 1XY<br />
128 1642 Glazteknology (Glaztek)<br />
UK Limited<br />
129 2061 Outokumpu Stainless<br />
Ltd<br />
201 707 Hepworth Building<br />
Products Ltd<br />
Carbon Capture and Storage Network 51<br />
Harworth<br />
Snape Lane<br />
Harworth<br />
Doncaster<br />
South Yorkshire<br />
DN11 8NF<br />
SMACC Site<br />
Outokumpu Stainless Ltd<br />
(Formerly AvestaPolarit Ltd)<br />
PO Box 161<br />
Shepcote Lane<br />
Sheffield<br />
South Yorkshire<br />
S9 1TR<br />
Hazlehead<br />
Hepworth Building Products<br />
Ltd<br />
Hazlehead<br />
Crow Edge<br />
Sheffield<br />
South Yorkshire<br />
S36 4HG<br />
Tier 0<br />
tpa<br />
Tier 1<br />
tpa<br />
Tier 2<br />
tpa<br />
>1M 50k - 1M
52<br />
Appendix B<br />
Study<br />
ID No.<br />
NAp<br />
ID<br />
Operator<br />
Name<br />
Installation Address EU-ETS<br />
Sector<br />
202 705 Beatson Clark plc Beatson Clark plc -<br />
Rotherham<br />
Rotherham Container Glass<br />
Works<br />
Greasbrough Road<br />
Rotherham<br />
South Yorkshire<br />
S60 1TZ<br />
203 240 Novartis Grimsby Ltd Novartis Grimsby Ltd<br />
Novartis Grimsby Ltd<br />
Pyewipe<br />
Grimsby<br />
N E Lincolnshire<br />
DN31 2SR<br />
204 2781 Rigid Paper Limited Selby Paper Mill<br />
Rigid Paper Ltd<br />
Denison Road<br />
Selby<br />
North Yorkshire<br />
YO8 8DB<br />
205 702 Allied Glass Containers<br />
Ltd.<br />
Allied Glass Containers Ltd.<br />
- Knottingley<br />
Knottingley Works<br />
Fernley Green Road<br />
Knottingley<br />
West Yorkshire<br />
WF11 8DJ<br />
206 302 Nationa Grid Gas Plc Scunthorpe Compressor<br />
Station<br />
Butterwick Road<br />
Messingham<br />
Scunthorpe<br />
Lincolshire<br />
DN17 3PN<br />
207 2985 UK COAL Mining Ltd. Harworth Colliery<br />
Harworth Colliery<br />
Scrooby Road<br />
Bircotes, Harworth<br />
Doncaster<br />
South Yorkshire<br />
DN11 8AB<br />
208 157 Croda Chemicals<br />
Europe Ltd<br />
Croda Chemicals Europe<br />
- Hull<br />
Oak Road Site<br />
Oak Road<br />
Hull<br />
East Yorkshire<br />
209 2330 Mill Nurseries Ltd. Mill CHP<br />
Mill Nurseries<br />
Ottringham Road<br />
Keyingham<br />
Kingston-Upon-Hull<br />
East Yorkshire<br />
HU12 9RX<br />
210 3108 Tate & Lyle Industries<br />
Limited<br />
211 2747 E.ON UK Cogeneration<br />
Ltd<br />
Carbon Capture and Storage Network<br />
Tate & Lyle Citric Acid<br />
Selby<br />
Denison Road<br />
Selby<br />
North Yorkshire<br />
YO8 8EF<br />
Brad<strong>for</strong>d CHP plant (AH<br />
Marks)<br />
AH Marks<br />
Wyke<br />
Brad<strong>for</strong>d<br />
West Yorkshire<br />
BD12 9EJ<br />
Tier 0<br />
tpa<br />
Tier 1<br />
tpa<br />
Tier 2<br />
tpa<br />
>1M 50k - 1M
Appendix B<br />
Study<br />
ID No.<br />
NAp<br />
ID<br />
Operator<br />
Name<br />
212 720 Sandtoft Roof Tiles<br />
Limited<br />
Installation Address EU-ETS<br />
Sector<br />
Broomfleet Works<br />
Broomfleet Tileries<br />
Broomfleet Works<br />
Broomfleet, Brough<br />
East Yorkshire<br />
HU15 1RS<br />
213 3134 SSE Generation Ltd Wheldale Power Station<br />
Wheldale Green Energy Park<br />
Wheldon Road<br />
Castle<strong>for</strong>d<br />
West Yorkshire<br />
WF10 2RR<br />
214 2658 McCain Foods (GB) Ltd McCain Steam Boilers<br />
- Scarborough<br />
McCain Foods (GB) Ltd<br />
- Scarborough<br />
Havers Hill<br />
Eastfield<br />
Scarborough<br />
North Yorkshire<br />
YO11 3BS<br />
215 3478 Total Solutions For<br />
Industry (Power<br />
Resources 1) Limited<br />
216 3125 Warwick Energy<br />
Exploration and<br />
Production Limited<br />
Sonoco CHP Plant<br />
Sonoco Board Mills<br />
Dog Lane<br />
Stainland<br />
Halifax<br />
West Yorkshire<br />
HX4 9PY<br />
Caythorpe Generating Plant<br />
Caythorpe Wellsite<br />
Rudston<br />
Near Driffield<br />
East Yorkshire<br />
YO25 4JD<br />
217 5014 Aarhus United UK Ltd Aarhus United UK Ltd<br />
King George Dock<br />
Hull<br />
Yorkshire<br />
HU9 5PX<br />
218 2302 Degussa Knottingley Ltd Degussa Knottingley Ltd<br />
Common Lane<br />
Knottingley<br />
West <strong>yorkshire</strong><br />
WF11 8BN<br />
219 3175 E.ON UK CoGeneration<br />
Ltd<br />
St James Hospital CHP<br />
Plant (St. James University<br />
Hospital)<br />
St James University Hospital<br />
Beckett Street<br />
Leeds<br />
Yorkshire<br />
LS9 7TF<br />
220 5013 T G Power Limited Power House Complex<br />
RAF Fylngdales<br />
RAF Fylingdales<br />
Pickering<br />
North Yorkshire<br />
YO18 7NT<br />
221 690 Beatson Clark plc Beatson Clark plc - Barnsley<br />
Barnsley Container Glass<br />
Works<br />
Hoyle Mill Road<br />
Stairfoot<br />
Barnsley<br />
South Yorkshire<br />
S70 3EU<br />
222 2645 Hanson Clay Products<br />
Ltd.<br />
Carbon Capture and Storage Network 53<br />
Howley Park Factory<br />
Howley Park<br />
Quarry Lane<br />
Howley Park<br />
Dewsbury<br />
West Yorkshire<br />
WF12 7JJ<br />
Tier 0<br />
tpa<br />
Tier 1<br />
tpa<br />
Tier 2<br />
tpa<br />
>1M 50k - 1M
54<br />
Appendix B<br />
Study<br />
ID No.<br />
NAp<br />
ID<br />
Operator<br />
Name<br />
223 704 Stolzle Flaconnage<br />
Limited<br />
Installation Address EU-ETS<br />
Sector<br />
Stolzle Flaconnage Limited<br />
Weeland Road<br />
Knottingley<br />
West Yorkshire<br />
WF11 8AP<br />
224 753 Plasmor Limited Plasmor Limited<br />
Great Heck<br />
Green Lane<br />
Great Heck<br />
Goole<br />
East Yorkshire<br />
DN14 0BZ<br />
225 3480 SSE Generation Ltd Hedon Salads Burstwick<br />
Energy Centre<br />
Hedon Salads Burstwick<br />
Main Road<br />
Burstwick<br />
East Yorkshire<br />
HU12 9DZ<br />
226 709 Naylor Drainage Naylor Drainage<br />
Cawthorne<br />
Clough Green<br />
Cawthorne<br />
Barnsley<br />
South Yorkshire<br />
S75 4AD<br />
227 706 Carlton Main Brickworks<br />
Ltd<br />
Carlton Main Brickworks Ltd<br />
Grimethorpe<br />
Clay Burn Road<br />
Grimethorpe<br />
Barnsley<br />
South Yorkshire<br />
S72 7BG<br />
228 3223 Muntons plc Muntons plc<br />
Flamborough Maltings<br />
Jewison Lane<br />
Bridlington<br />
East Yorkshire<br />
YO15 1DY<br />
229 2187 Carlsberg UK Limited Joshua Tetley Brewery Leeds<br />
Hunslet Road<br />
PO Box<br />
Leeds<br />
West Yorkshire<br />
LS1 1QG<br />
230 3497 Sheffield Teaching<br />
Hospitals NHS Trust<br />
231 3498 Sheffield teaching<br />
Hospitals NHS Trust<br />
Carbon Capture and Storage Network<br />
Northern General Hospital<br />
- Boiler House<br />
Northern General Hospital<br />
Sheffield Teaching Hsopitals<br />
NHS Trust<br />
Herries Road<br />
Sheffield Teaching Hosp<br />
NHS<br />
South Yorkshire<br />
S5 7AU<br />
Royal Hallamshire Hospital<br />
Boiler House<br />
Sheffield Teaching Hospitals<br />
NHS Trust<br />
Glossop Road<br />
Sheffield Teaching Hosp<br />
NHS<br />
South Yorkshire<br />
S10 2JF<br />
232 759 Ibstock Brick Ltd. Ibstock Brick Ltd - Nostell<br />
Nostell Factory<br />
Ibstock Brick Ltd.<br />
Swine Lane, Nostell<br />
Wakefield<br />
West Yorkshire<br />
WF4 1QH<br />
Tier 0<br />
tpa<br />
Tier 1<br />
tpa<br />
Tier 2<br />
tpa<br />
>1M 50k - 1M
Appendix B<br />
Study<br />
ID No.<br />
NAp<br />
ID<br />
Operator<br />
Name<br />
233 155 Croda Chemicals<br />
International Ltd<br />
Installation Address EU-ETS<br />
Sector<br />
Croda Chemical Europe<br />
- Goole<br />
Rawcliffe Bridge<br />
Rawcliffe Bridge<br />
Station Road<br />
Goole<br />
East Yorkshire<br />
DN14 8PN<br />
234 8091 British Gypsum Ltd Sherburn Gypsum Works<br />
Sherburn<br />
Fenton Lane<br />
Sherburn In Elmet<br />
Nr Leeds<br />
Yorkshire<br />
LS25 6EZ<br />
235 2647 Hanson Clay Products<br />
Ltd.<br />
236 3547 DONCASTER<br />
& BASSETLAW<br />
HOSPITALS NHS<br />
TRUST<br />
Swillington Factory<br />
Swillington<br />
Wakefield Road<br />
Swillington<br />
Leeds<br />
West Yorkshire<br />
LS26 8BT<br />
Doncaster Royal Infirmary<br />
Boiler House<br />
Doncaster Royal Infirmary<br />
Armthorpe Road<br />
Doncaster<br />
South Yorkshire<br />
DN2 5LT<br />
237 2175 Cadbury Trebor Bassett Energy Centre - Sheffield<br />
Cadbury Trebor Bassett<br />
Sheffield<br />
PO Box 8<br />
Livesey Street<br />
Sheffield<br />
Yorkshire<br />
S6 2AP<br />
238 2646 Hanson Clay Products<br />
Ltd.<br />
Stairfoot Factory<br />
Stairfoot<br />
Wombwell Lane<br />
Stairfoot<br />
Barnsley<br />
South Yorkshire<br />
S70 3NS<br />
239 2709 P Garnett & Son Ltd P Garnett and Son Ltd<br />
Otley Paper Mill<br />
Mill Lane<br />
Wharfeside<br />
Otley<br />
West Yorkshire<br />
LS21 1QJ<br />
241 6027 Smith & Nephew<br />
Medical Ltd<br />
Smith & Nephew Medical Ltd<br />
PO Box 81<br />
Hessle Road<br />
Hull<br />
HU3 2BN<br />
242 8075 Hazlewood Grocery Ltd Selby Sauces and Pickles<br />
Greencore Grocery, Selby<br />
Barlby Road<br />
Selby<br />
North Yorkshire<br />
YO8 5BJ<br />
243 2377 Elyo UK Industrial Nestlé Halifax Boiler House<br />
Nestlé Halifax<br />
Nestlé Rowntree<br />
Albion Mills<br />
Halifax<br />
West Yorkshire<br />
HX3 9XT<br />
Carbon Capture and Storage Network 55<br />
Tier 0<br />
tpa<br />
Tier 1<br />
tpa<br />
Tier 2<br />
tpa<br />
>1M 50k - 1M
56<br />
Appendix B<br />
Study<br />
ID No.<br />
NAp<br />
ID<br />
Operator<br />
Name<br />
244 4036 Humber Growers Ltd Poolbank CHP<br />
Poolbank Salads<br />
(Humber VHB)<br />
Common Lane<br />
Welton<br />
Brough<br />
East Yorkshire<br />
HU15 1UT<br />
245 2557 John Roberts Holdings<br />
Ltd.<br />
246 38 Sheffield Forgemasters<br />
Engineering Limited<br />
Installation Address EU-ETS<br />
Sector<br />
Langcliffe Paper Mill<br />
Langcliffe<br />
Settle<br />
North Yorkshire<br />
BD24 9NX<br />
Sheffield Forgemasters Steel<br />
Melting Shop<br />
River Don Works<br />
P.O. Box 286<br />
Brightside Lane<br />
Sheffield<br />
South Yorkshire<br />
S9 2RW<br />
247 2258 Coors Brewers Limited Tower Brewery<br />
Coors Brewers Ltd<br />
Wetherby Road<br />
Tadcaster<br />
North Yorkshire<br />
LS24 9SD<br />
248 3549 Hull & East Yorkshire<br />
Hospitals NHS Trust<br />
249 2461 Hanson Building<br />
Products<br />
Hull & East Yorkshire<br />
Hospitals NHS Trust<br />
Castle Hill Hospital<br />
Castle Road<br />
Cottingham<br />
East Yorkshire<br />
HU16 5JQ<br />
Hanson Building Products<br />
- Calder Works<br />
Calder Works<br />
Lower Edge Road<br />
Elland<br />
West Yorkshire<br />
HZ5 9PY<br />
250 4027 Bardmilne Ltd University of York<br />
Heslington<br />
York<br />
North Yorkshire<br />
YO10 5DD<br />
251 8058 YORK HOSPITALS NHS<br />
TRUST<br />
252 3504 Barnsley Hospital NHS<br />
Foundation Trust<br />
YORK HOSPITAL<br />
BOILERHOUSE<br />
YORK HOSPITAL<br />
WIGGINTON ROAD<br />
YORK HOSPITAL<br />
NORTH YORKSHIRE<br />
YO31 8HE<br />
Barnsley Hospital NHS<br />
Foundation Trust<br />
Barnsley Hospital NHS<br />
Foundation Trust<br />
Gawber Road<br />
Barnsley<br />
South Yorkshire S75 2EP<br />
253 3035 Whiteley Ltd Whiteley Ltd<br />
Whiteley Ltd<br />
Pool Paper Mills<br />
Pool-in-Wharfedale<br />
West Yorkshire<br />
LS21 1RP<br />
254 3116 Dyson Industries Ltd Dyson Industries Limited<br />
- Totley<br />
Dyson Refractories,<br />
Totley Works<br />
Owler Bar<br />
Sheffield<br />
South Yorkshire<br />
S17 3BJ<br />
Carbon Capture and Storage Network<br />
Tier 0<br />
tpa<br />
Tier 1<br />
tpa<br />
Tier 2<br />
tpa<br />
>1M 50k - 1M
Appendix B<br />
Study<br />
ID No.<br />
NAp<br />
ID<br />
Operator<br />
Name<br />
Known proposed Future Emitters<br />
Carbon Capture and Storage Network 57<br />
Installation Address EU-ETS<br />
Sector<br />
Total <strong>for</strong> Tier<br />
Total included in Study<br />
Total Proposed Emitters<br />
in Study<br />
% of Region Total (not<br />
including future emitters)<br />
% of Study Area Total<br />
Tier 0<br />
tpa<br />
Tier 1<br />
tpa<br />
Tier 2<br />
tpa<br />
>1M 50k - 1M 1M<br />
ConocoPhillips Immingham IGCC 1,761,298<br />
EON Killingholme EON Killinghome IGCC Power Station 2,400,000<br />
Powerfuel Power Ltd Hatfield IGCC Power Station 4,800,000<br />
4173242<br />
2864681<br />
3164681<br />
6.17%<br />
4.23%<br />
1172533<br />
501618<br />
501618<br />
1.73%<br />
0.67%<br />
Tier 1<br />
tpa<br />
50k - 1M<br />
BP Bioethanol 300,000<br />
8,961,298 300,000<br />
Included in<br />
Study /Notes<br />
67615953<br />
74597775<br />
74676810<br />
Tier 2<br />
tpa<br />
58<br />
Disclaimer<br />
The in<strong>for</strong>mation, analysis, scenario and<br />
discussion within this report are the result<br />
of an independent review and report <strong>for</strong><br />
Yorkshire Forward. Whilst potential emitters<br />
and stakeholders have been engaged with<br />
the project the in<strong>for</strong>mation presented here<br />
does not represent any stakeholder’s policy<br />
towards carbon capture and storage in the<br />
Yorkshire and Humber region. Scenarios<br />
presented within are based on publicly<br />
available in<strong>for</strong>mation, stake holder and<br />
project discussions and should not be taken<br />
as stating or implying regional or a specific<br />
entity’s policy.<br />
Authors<br />
AMEC<br />
AMEC House<br />
Yarm Road<br />
Darlington<br />
County Durham DL1 4JN<br />
United Kingdom<br />
Telephone: +44(0)1325 744400<br />
Fax: +44(0)1325 744404<br />
Email: alastair.rennie@amec.com<br />
Website: www.amec.com<br />
Carbon Capture and Storage Network<br />
Acknowledgements<br />
The authors and Yorkshire Forward are<br />
grateful <strong>for</strong> the Steering Group inputs but<br />
any errors are our own.<br />
The steering group comprised:<br />
Mike Smith, Chairman, Yorkshire Forward<br />
Dr Stephen Brown, Project Manager,<br />
Yorkshire Forward<br />
Tim Hill, Eon UK<br />
John Mitchell, Scottish and Southern Energy<br />
Nigel Burdett, Drax Power Ltd<br />
Ishfaq Ahmed, Conoco Phillips<br />
Phillip Pearson, TUC<br />
Michael Gibbons, Powerfuel Power Ltd<br />
Chris Treadgold, Corus<br />
Stefan Cousquer, Hydrogen Energy<br />
Malcolm Stephenson, Shell<br />
Alastair Rennie, AMEC<br />
Important notice<br />
This report was prepared exclusively <strong>for</strong><br />
Yorkshire Forward by AMEC plc, (AMEC),<br />
Industrial division, Darlington. The quality<br />
of in<strong>for</strong>mation, conclusions and estimates<br />
contained herein is consistent with the level<br />
of ef<strong>for</strong>t involved in AMEC’s services and<br />
based on:<br />
i) in<strong>for</strong>mation available at the time of<br />
preparation,<br />
ii) data supplied by outside sources and<br />
iii) the assumptions, conditions and<br />
qualifications set <strong>for</strong>th in this report. This<br />
report is intended to be used by Yorkshire<br />
Forward and consortium partners only,<br />
subject to the terms and conditions of its<br />
contract with AMEC. Any other use of, or<br />
reliance on, this report by any third party is<br />
at that party’s sole risk.
CONtACt US<br />
If you want more in<strong>for</strong>mation about the<br />
carbon capture and storage <strong>network</strong><br />
<strong>for</strong> Yorkshire and Humber, contact our<br />
sustainable development team on<br />
0113 394 5672 or visit<br />
www.<strong>yorkshire</strong>-<strong>for</strong>ward.com<br />
Yorkshire Forward<br />
Victoria House<br />
2 Victoria Place<br />
Leeds LS11 5AE<br />
www.<strong>yorkshire</strong>-<strong>for</strong>ward.com<br />
Printed in the region on recycled paper (75% post consumer waste and totally chlorine-free (TCF)) 05_08 100203