Quantitative Study on Microbial Pollution of River ... - GANGAPEDIA
Quantitative Study on Microbial Pollution of River ... - GANGAPEDIA
Quantitative Study on Microbial Pollution of River ... - GANGAPEDIA

You also want an ePaper? Increase the reach of your titles
YUMPU automatically turns print PDFs into web optimized ePapers that Google loves.
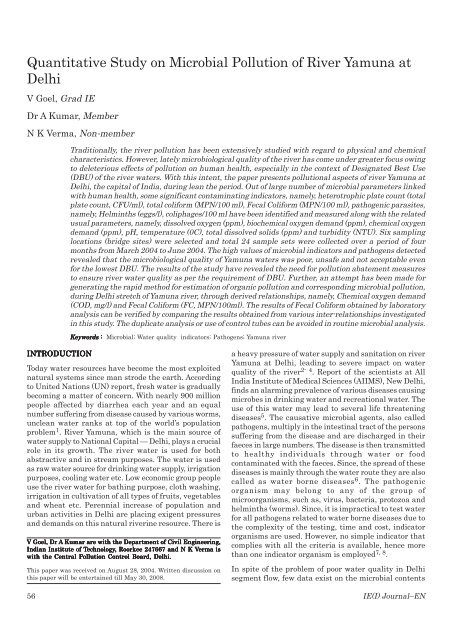
<str<strong>on</strong>g>Quantitative</str<strong>on</strong>g> <str<strong>on</strong>g>Study</str<strong>on</strong>g> <strong>on</strong> <strong>Microbial</strong> Polluti<strong>on</strong> <strong>of</strong> <strong>River</strong> Yamuna at<br />
Delhi<br />
V Goel, Grad IE<br />
Dr A Kumar, Member<br />
N K Verma, N<strong>on</strong>-member<br />
INTRODUCTION<br />
INTRODUCTION<br />
Traditi<strong>on</strong>ally, the river polluti<strong>on</strong> has been extensively studied with regard to physical and chemical<br />
characteristics. However, lately microbiological quality <strong>of</strong> the river has come under greater focus owing<br />
to deleterious effects <strong>of</strong> polluti<strong>on</strong> <strong>on</strong> human health, especially in the c<strong>on</strong>text <strong>of</strong> Designated Best Use<br />
(DBU) <strong>of</strong> the river waters. With this intent, the paper presents polluti<strong>on</strong>al aspects <strong>of</strong> river Yamuna at<br />
Delhi, the capital <strong>of</strong> India, during lean the period. Out <strong>of</strong> large number <strong>of</strong> microbial parameters linked<br />
with human health, some significant c<strong>on</strong>taminating indicators, namely, heterotrophic plate count (total<br />
plate count, CFU/ml), total coliform (MPN/100 ml), Fecal Coliform (MPN/100 ml), pathogenic parasites,<br />
namely, Helminths (eggs/l), coliphages/100 ml have been identified and measured al<strong>on</strong>g with the related<br />
usual parameters, namely, dissolved oxygen (ppm), biochemical oxygen demand (ppm), chemical oxygen<br />
demand (ppm), pH, temperature (0C), total dissolved solids (ppm) and turbidity (NTU). Six sampling<br />
locati<strong>on</strong>s (bridge sites) were selected and total 24 sample sets were collected over a period <strong>of</strong> four<br />
m<strong>on</strong>ths from March 2004 to June 2004. The high values <strong>of</strong> microbial indicators and pathogens detected<br />
revealed that the microbiological quality <strong>of</strong> Yamuna waters was poor, unsafe and not acceptable even<br />
for the lowest DBU. The results <strong>of</strong> the study have revealed the need for polluti<strong>on</strong> abatement measures<br />
to ensure river water quality as per the requirement <strong>of</strong> DBU. Further, an attempt has been made for<br />
generating the rapid method for estimati<strong>on</strong> <strong>of</strong> organic polluti<strong>on</strong> and corresp<strong>on</strong>ding microbial polluti<strong>on</strong>,<br />
during Delhi stretch <strong>of</strong> Yamuna river, through derived relati<strong>on</strong>ships, namely, Chemical oxygen demand<br />
(COD, mg/l) and Fecal Coliform (FC, MPN/100ml). The results <strong>of</strong> Fecal Coliform obtained by laboratory<br />
analysis can be verified by comparing the results obtained from various inter-relati<strong>on</strong>ships investigated<br />
in this study. The duplicate analysis or use <strong>of</strong> c<strong>on</strong>trol tubes can be avoided in routine microbial analysis.<br />
Keywords Keywords Keywords Keywords Keywords : : <strong>Microbial</strong>; Water quality indicators; Pathogens; Yamuna river<br />
Today water resources have become the most exploited<br />
natural systems since man strode the earth. According<br />
to United Nati<strong>on</strong>s (UN) report, fresh water is gradually<br />
becoming a matter <strong>of</strong> c<strong>on</strong>cern. With nearly 900 milli<strong>on</strong><br />
people affected by diarrhea each year and an equal<br />
number suffering from disease caused by various worms,<br />
unclean water ranks at top <strong>of</strong> the world’s populati<strong>on</strong><br />
problem 1 . <strong>River</strong> Yamuna, which is the main source <strong>of</strong><br />
water supply to Nati<strong>on</strong>al Capital — Delhi, plays a crucial<br />
role in its growth. The river water is used for both<br />
abstractive and in stream purposes. The water is used<br />
as raw water source for drinking water supply, irrigati<strong>on</strong><br />
purposes, cooling water etc. Low ec<strong>on</strong>omic group people<br />
use the river water for bathing purpose, cloth washing,<br />
irrigati<strong>on</strong> in cultivati<strong>on</strong> <strong>of</strong> all types <strong>of</strong> fruits, vegetables<br />
and wheat etc. Perennial increase <strong>of</strong> populati<strong>on</strong> and<br />
urban activities in Delhi are placing exigent pressures<br />
and demands <strong>on</strong> this natural riverine resource. There is<br />
V V Goel, Goel, Dr Dr A Kumar Kumar are are with with the the Department Department <strong>of</strong> <strong>of</strong> Civil Civil Engineering,<br />
Engineering,<br />
Indian Indian Indian Institute Institute <strong>of</strong> <strong>of</strong> TT<br />
Technology<br />
T Technology<br />
echnology echnology, echnology , Roorkee Roorkee 247667 247667 and and N N K K K V VVerma<br />
V erma is<br />
is<br />
with with the the Central Central Polluti<strong>on</strong> Polluti<strong>on</strong> C<strong>on</strong>trol C<strong>on</strong>trol C<strong>on</strong>trol Board, Board, Delhi.<br />
Delhi.<br />
This paper was received <strong>on</strong> August 28, 2004. Written discussi<strong>on</strong> <strong>on</strong><br />
this paper will be entertained till May 30, 2008.<br />
a heavy pressure <strong>of</strong> water supply and sanitati<strong>on</strong> <strong>on</strong> river<br />
Yamuna at Delhi, leading to severe impact <strong>on</strong> water<br />
quality <strong>of</strong> the river 2- 4 . Report <strong>of</strong> the scientists at All<br />
India Institute <strong>of</strong> Medical Sciences (AIIMS), New Delhi,<br />
finds an alarming prevalence <strong>of</strong> various diseases causing<br />
microbes in drinking water and recreati<strong>on</strong>al water. The<br />
use <strong>of</strong> this water may lead to several life threatening<br />
diseases 5 . The causative microbial agents, also called<br />
pathogens, multiply in the intestinal tract <strong>of</strong> the pers<strong>on</strong>s<br />
suffering from the disease and are discharged in their<br />
faeces in large numbers. The disease is then transmitted<br />
to healthy individuals through water or food<br />
c<strong>on</strong>taminated with the faeces. Since, the spread <strong>of</strong> these<br />
diseases is mainly through the water route they are also<br />
called as water borne diseases 6 . The pathogenic<br />
organism may bel<strong>on</strong>g to any <strong>of</strong> the group <strong>of</strong><br />
microorganisms, such as, virus, bacteria, protozoa and<br />
helminths (worms). Since, it is impractical to test water<br />
for all pathogens related to water borne diseases due to<br />
the complexity <strong>of</strong> the testing, time and cost, indicator<br />
organisms are used. However, no simple indicator that<br />
complies with all the criteria is available, hence more<br />
than <strong>on</strong>e indicator organism is employed 7, 8 .<br />
In spite <strong>of</strong> the problem <strong>of</strong> poor water quality in Delhi<br />
segment flow, few data exist <strong>on</strong> the microbial c<strong>on</strong>tents<br />
56 IE(I) Journal–EN
<strong>of</strong> the river water. Most <strong>of</strong> the previous studies, already<br />
d<strong>on</strong>e <strong>on</strong> Yamuna, limits to the detecti<strong>on</strong> <strong>of</strong> coliforms as<br />
microbial indicator that may not indicate the exact<br />
c<strong>on</strong>centrati<strong>on</strong> <strong>of</strong> pathogens in water. Therefore the<br />
present study highlights the c<strong>on</strong>centrati<strong>on</strong> <strong>of</strong> pathogenic<br />
parasites (Helminths, coliphages) al<strong>on</strong>g with the<br />
heterotrophic plate count (HPC), total coliform (TC) and<br />
Fecal Coliform (FC) to determine the microbial quality<br />
<strong>of</strong> the river water.<br />
RIVER RIVER YAMUNA<br />
YAMUNA<br />
The river Yamuna, the largest tributary <strong>of</strong> river Ganga<br />
has been <strong>on</strong>e <strong>of</strong> the most prominent and sacred rivers <strong>of</strong><br />
India through the ages. Yamuna, according to the<br />
legends, was the daughter <strong>of</strong> Surya, the Sun God and<br />
sister to Yama, the God <strong>of</strong> Death. C<strong>on</strong>sequently, popular<br />
belief is that those who take a dip in its holy water are<br />
not tormented by fears <strong>of</strong> death. Yamunotri, which is<br />
the north <strong>of</strong> Haridwar in the Himalayan Mountains, is<br />
the source <strong>of</strong> the Yamuna. The river Yamuna, a major<br />
tributary <strong>of</strong> river Ganges, originates from the Yamunotri<br />
glacier near Banderpo<strong>on</strong>ch peaks (38°59' N, 78°27' E) in<br />
the Mussourie range <strong>of</strong> the lower Himalayas at an<br />
elevati<strong>on</strong> <strong>of</strong> about 6387 m above mean sea level in district<br />
Uttarkashi (Uttranchal). The catchment <strong>of</strong> Yamuna river<br />
system covers parts <strong>of</strong> Uttar Pradesh, Uttranchal,<br />
Himachal Pradesh, Haryana, Rajasthan, Madhya<br />
Pradesh and Nati<strong>on</strong>al Capital Territory (NCT) Delhi.<br />
The entire Yamuna river right from its origin to<br />
c<strong>on</strong>fluence with the Ganga and its tributaries are subject<br />
to human activities, which directly or indirectly affect<br />
the water quality 5 .<br />
NCT — Delhi, located at a latitude <strong>of</strong> 28°34'N and<br />
l<strong>on</strong>gitude <strong>of</strong> 77°07'E, is facing the challenges <strong>of</strong><br />
sanitati<strong>on</strong> and envir<strong>on</strong>mental degradati<strong>on</strong> due to<br />
increasing populati<strong>on</strong> and urbanizati<strong>on</strong>. Delhi al<strong>on</strong>e<br />
c<strong>on</strong>tributes around 3 296 MLD/day <strong>of</strong> sewage by virtue<br />
<strong>of</strong> drains outfalling in Yamuna Delhi segment flow (22<br />
km length). This is more than that <strong>of</strong> all the class II<br />
cities <strong>of</strong> India put together. Despite the smallest<br />
percentage <strong>of</strong> catchment area in Yamuna, <strong>on</strong>ly 0.4% <strong>of</strong><br />
total catchment area, Delhi is the largest c<strong>on</strong>tributor <strong>of</strong><br />
polluti<strong>on</strong> to the river 2,9 .<br />
STUDY STUDY SITE SITE SITE AND AND AND SOURCES SOURCES OF OF POLLUTION<br />
POLLUTION<br />
From Wazirabad barrage to Okhala barrage, the whole<br />
Yamuna river Delhi Segment was c<strong>on</strong>sidered for this<br />
study. The different sampling stati<strong>on</strong>s selected are as<br />
follows:<br />
(i) Wazirabad Barrage (WB): entry point <strong>of</strong> Yamuna<br />
river in Delhi segment.<br />
(ii) ISBT Yamuna Bridge (ISBT): approximately<br />
5.5 km D/s from WB.<br />
(iii) ITO Bridge (ITO): approximately 12 km D/s from WB.<br />
(iv) Nizamuddin Bridge (NB): approximately 14.5 km<br />
D/s from WB.<br />
(v) Toll Bridge (TB): approximately 19 km D/s from<br />
WB.<br />
(vi) Okhala Barrage (OB): approximately 22 km D/s<br />
from WB.<br />
The details <strong>of</strong> sampling stati<strong>on</strong>s selected and various<br />
drains outfalls in river Yamuna Delhi Segment are<br />
shown in Figure 1.<br />
RA RATIONALE RA TIONALE FOR FOR SAMPLING SAMPLING LOCA LOCATIONS<br />
LOCA LOCA TIONS<br />
The sampling stati<strong>on</strong>s were selected <strong>on</strong> the basis <strong>of</strong> the<br />
following major criteria 10,11<br />
♦ It should be accessible in all seas<strong>on</strong>s <strong>of</strong> the year.<br />
♦ It should have proper mixing <strong>of</strong> pollutants thus<br />
representing water quality <strong>of</strong> river at that particular<br />
stretch.<br />
♦ Facilities to take water samples should be available<br />
there. Bridges are normally the first choice for locating<br />
a stream sampling stati<strong>on</strong>, since they are not <strong>on</strong>ly<br />
provide ready access but also permit sampling at any<br />
point across the width <strong>of</strong> stream. Further the bridges<br />
are clearly identifiable and the site can be precisely<br />
described.<br />
1. Burari* drain and (1993)<br />
Najafgarh* drain (MLD)<br />
2. Magazine road (5)<br />
3. Sweeper col<strong>on</strong>y (7)<br />
4. Khyber pass (8)<br />
5. Metacalfe house (6)<br />
6. Kudsia bagh (54)<br />
7. Moat (negligible) flow<br />
9. Mori gate (125)<br />
10. Civil mill* (22)<br />
11. Power house* (17)<br />
12. Sen nursing home* (113)<br />
13. Drain number 14 (113)<br />
14. Barapullah (156)<br />
15. Maharani bagh (17)<br />
16. Kalkaji (negligible) flow<br />
17. Okhala (NA)<br />
18. Tughlakabad (2)<br />
From Haryana<br />
20,21,22,(52)<br />
To mathura<br />
8. Trans Yamuna<br />
MCD (NA)<br />
6.5 km<br />
Hind<strong>on</strong> cut canal (NA)<br />
19,23 (606)<br />
Figure Figure 1 1 C<strong>on</strong>ceptual C<strong>on</strong>ceptual linearised linearised diagram diagram <strong>of</strong> <strong>of</strong> river river river Yamuna amuna at at Delhi<br />
Delhi<br />
Vol 88, March 2008 57<br />
WB°<br />
ISBT°<br />
ITO°<br />
NB°<br />
TB°<br />
OB°<br />
N<br />
5.5 km<br />
2.5 km<br />
4.5 km<br />
3 km<br />
* Mixed sewage source<br />
o Sampling stati<strong>on</strong>
♦ It should affect the quality <strong>of</strong> water — (i) before<br />
drains from city discharge; (ii) inside city; and (iii) after<br />
the river leaves the city.<br />
SAMPLE SAMPLE COLLECTION<br />
COLLECTION<br />
Sample collecti<strong>on</strong> is a very important part <strong>of</strong> river study<br />
because c<strong>on</strong>clusi<strong>on</strong>s drawn are based <strong>on</strong>ly <strong>on</strong> the testing<br />
<strong>of</strong> collected samples. The purpose <strong>of</strong> taking samples is<br />
to obtain informati<strong>on</strong>, which in some way typifies the<br />
aquatic system from which samples are drawn 12 . Grab<br />
Sampling procedure was adopted as recommended by<br />
Standard Method for microbiological analysis. Samples<br />
were collected during lean seas<strong>on</strong>, <strong>on</strong> m<strong>on</strong>thly basis, for<br />
a period <strong>of</strong> four m<strong>on</strong>ths from March 2004 to June 2004.<br />
Three sets <strong>of</strong> water samples, from each sampling locati<strong>on</strong><br />
and for every sampling date, were collected for this study.<br />
(i) Water samples for microbiological examinati<strong>on</strong>,<br />
other than Helminth eggs, for BOD and COD<br />
determinati<strong>on</strong> were collected in n<strong>on</strong>-reactive<br />
borosilicate glass bottles <strong>of</strong> 500 ml capacity each that<br />
had been cleansed and rinsed carefully, given a final<br />
rinse with distilled water and sterilized. Samples were<br />
taken from the river by holding the bottle near its base<br />
in the hand and plunging it, neck downward, below<br />
the surface. Then turning the bottle until neck points<br />
slightly upward and mouth is directed toward the<br />
current. The sampling bottle was not filled up to the<br />
brim and 20 mm to 30 mm space was left for effective<br />
shaking <strong>of</strong> the bottle 13 .<br />
(ii) Water samples for Helminth eggs were collected in<br />
Table able 1 1 1 Summary Summary <strong>of</strong> <strong>of</strong> analytic analytic methods methods and and observed observed values<br />
values<br />
n<strong>on</strong>-reactive plastic bottles <strong>of</strong> 5 l capacity, which had<br />
been cleansed and finally rinsed with distilled water 14 .<br />
(iii) Water samples for DO determinati<strong>on</strong> were<br />
collected in BOD bottles (n<strong>on</strong>-reactive borosilicate<br />
glass bottles <strong>of</strong> 300 ml capacity). The DO was fixed by<br />
standard procedure Onsite, just after collecti<strong>on</strong> 13 .<br />
SAMPLE SAMPLE PRESER PRESERVATION<br />
PRESER TION TION AND AND STORAGE<br />
STORAGE<br />
Microbiological analysis <strong>of</strong> water samples was started<br />
as so<strong>on</strong> as possible after collecti<strong>on</strong> to avoid unpredictable<br />
changes in the microbial populati<strong>on</strong> 15 . As the samples<br />
cannot be processed within 1 h after collecti<strong>on</strong>, therefore<br />
for most accurate results, samples were brought in iced<br />
insulated c<strong>on</strong>tainer, during transport from Delhi to IIT<br />
Roorkee laboratory.<br />
ANAL ANALYSIS ANAL YSIS OF OF SAMPLES<br />
SAMPLES<br />
The Samples were analyzed in accordance with the<br />
standard methods. The techniques, instruments and<br />
principles involved in arriving at different parameters<br />
are tabulated in Table 1.<br />
RESUL RESULTS RESUL RESULTS<br />
TS<br />
The variati<strong>on</strong> in water quality parameters determined<br />
through the analysis <strong>on</strong> site and in laboratory at Indian<br />
Institute <strong>of</strong> Technology, Roorkee (India) were reported<br />
in Table 1. The l<strong>on</strong>gitudinal pr<strong>of</strong>ile <strong>of</strong> various microbial<br />
parameters is shown in Figure 2. The L<strong>on</strong>gitudinal<br />
pr<strong>of</strong>iles <strong>of</strong> BOD, COD and DO values were shown in<br />
Figure 3.<br />
Parameters Parameters Principle Principle Principle<br />
Instruments/ Instruments/ technique technique used used<br />
Observed Observed values values<br />
values<br />
Minimum Minimum Maximum Maximum Maximum Average verage<br />
Temperature, °C Metric Thermometer 19 36 28<br />
pH Metric Digital pH meter 7 9.2 7.5<br />
TDS, mg/l Metric Digital TDS meter 190 700 460<br />
Turbidity, NTU Nephelometric Digital Turbidity Meter 3.6 52.0 32.1<br />
DO, mg/l Volumetric Modified Winkler’s method<br />
BOD, mg/l Volumetric Winkler’s method, incubati<strong>on</strong> for 3 days<br />
COD, mg/l Closed Reflux, colorimetric Hach COD system (DR/ 4000 U<br />
TC, MPN/100 ml MPN index Lauryl tryptose broth, incubati<strong>on</strong><br />
FC, MPN/100 ml MPN index EC Medium, incubati<strong>on</strong> temperature<br />
HPC, CFU/ml Total plate count Pour plate method, plate count agar,<br />
Coliphages, per ml Equati<strong>on</strong>s (APHA 9211 D 3) Inte-relati<strong>on</strong>ship<br />
Titrant — N/40 Na 2 S 2 O 3 Ind — starch 0.0 8.2 1.5<br />
at 27°C (IS : 3025 part 4, 1993) 3.0 52.0 34.2<br />
spectrophotometer) set at λ = 600 nm 6.0 120.0 75.5<br />
temperature 35 ± 0.5°C for 24 h to 48 h 2.1E04 4.3E07 9.3E06<br />
44.5 ± 0.2°C for 24 ± 2 h 3.9E03 3.9 E 07 4.6 E 06<br />
incubati<strong>on</strong> temperature 35°C for 48 h,<br />
digital col<strong>on</strong>y counter 2.4E03 1.5E06 2.6E05<br />
between TC and coliphages, FC<br />
Helminth eggs, Microscopic count Modified Bailenger method,<br />
and coliphages 5.2E03 9.0E08 1.2E08<br />
per ml centrifuge (1000 g), compound microscope 5 38 23<br />
58 IE(I) Journal–EN
The total coliform, MPN/100ml values in river were<br />
always found exceeding the permissible limit <strong>of</strong> 500 or<br />
less for DBU class B, ie, for outdoor bathing and 5000 or<br />
less for DBU class C, ie, for drinking water source after<br />
c<strong>on</strong>venti<strong>on</strong>al treatment and disinfecti<strong>on</strong> 16,17 . The BOD<br />
values in river was found most <strong>of</strong> the times exceeding<br />
the permissible limit <strong>of</strong> 3 mg/l or less for both DBU class<br />
B and class C. From D/S <strong>of</strong> WB to OB, near zero DO<br />
level was the clear indicati<strong>on</strong> <strong>of</strong> relatively higher<br />
polluti<strong>on</strong> loads. The depleti<strong>on</strong> <strong>of</strong> oxygen was the major<br />
impact in the polluted stretch <strong>of</strong> the river due to<br />
excessive presence <strong>of</strong> organic matter, which disturbed<br />
the river ecosystem to a large extent. The biodegradati<strong>on</strong><br />
<strong>of</strong> organic polluti<strong>on</strong> resulted in release <strong>of</strong> nutrients,<br />
which causes eutrophicati<strong>on</strong> <strong>of</strong> river. The pathogenic<br />
parasite Helminth (eggs/l) values found in Yamuna river<br />
are much higher and water was not suitable even for<br />
the irrigati<strong>on</strong> purpose. The minimum value was found<br />
is 5 eggs/l which exceeds the permissible limit <strong>of</strong> 1 egg/l 18 .<br />
INTER INTER RELA RELATIONSHIP<br />
RELA TIONSHIP BETWEEN BETWEEN BOD BOD BOD AND AND COD<br />
COD<br />
COD test gave a relatively quick estimati<strong>on</strong> <strong>of</strong> the<br />
carb<strong>on</strong>aceous c<strong>on</strong>tents <strong>of</strong> the sample (within a matter <strong>of</strong><br />
3 h) compared to the BOD test, which normally takes 3<br />
days. Also the COD test has a higher precisi<strong>on</strong> than the<br />
BOD test. As polluted water bodies may have a varying<br />
proporti<strong>on</strong> <strong>of</strong> degradable and n<strong>on</strong>- degradable substances<br />
in them, the <strong>on</strong>ly practical way in which the COD test<br />
can be used for estimati<strong>on</strong> <strong>of</strong> BOD is to develop a specific<br />
Log scale<br />
1.0E + 09<br />
1.0E + 08<br />
1.0E + 07<br />
1.0E + 06<br />
1.0E + 05<br />
1.0E + 04<br />
1.0E + 03<br />
1.0E + 02<br />
1.0E + 01<br />
1.0E + 00<br />
Total plate count CFU/100 ml<br />
Total coliform MPN/100 ml<br />
Fecal coliform MPN/100 ml<br />
Coliphases/100 ml<br />
Helminths, eggs/l<br />
WB ISBT ITO NB TB OB<br />
Sampling locati<strong>on</strong>s<br />
Figure Figure 2 2 Average verage microbial microbial pr<strong>of</strong>ile pr<strong>of</strong>ile <strong>of</strong> <strong>of</strong> river river Yamuna amuna at at Delhi<br />
Delhi<br />
mg/l<br />
120<br />
100<br />
80<br />
60<br />
40<br />
20<br />
0<br />
Average observed<br />
DO values<br />
8.4<br />
3.7<br />
78.8<br />
39<br />
Average observed<br />
BOD values<br />
105<br />
46.5<br />
87.3<br />
37.5<br />
WB ISBT ITO NB TB OB<br />
Sampling locati<strong>on</strong>s<br />
Average observed<br />
COD values<br />
40.3 38.3<br />
7.7 0 0 0 0.25 1.3<br />
Figure Figure 3 3 L<strong>on</strong>gitudinal L<strong>on</strong>gitudinal pr<strong>of</strong>ile pr<strong>of</strong>ile <strong>of</strong> <strong>of</strong> DO, DO, BOD BOD and and COD COD in in river river Yamuna amuna<br />
at at Delhi<br />
Delhi<br />
90<br />
83.8<br />
correlati<strong>on</strong> between COD and BOD values for specific<br />
case 19-21 . The COD values, observed in Yamuna river<br />
Delhi segment flow, at various sampling locati<strong>on</strong>s and<br />
date have been plotted against the BOD in Figure 4(a).<br />
The relati<strong>on</strong>ship investigated as BOD = 0.454 COD have<br />
high degree <strong>of</strong> correlati<strong>on</strong>. Thus the precise and carefull<br />
determinati<strong>on</strong> <strong>of</strong> COD be better suited for routine<br />
analysis due to much shorter time requirement and not<br />
for needing an electric incubator.<br />
INTER INTER RELA RELA RELATIONSHIP<br />
RELA RELA TIONSHIP BETWEEN BETWEEN VARIOUS<br />
VARIOUS<br />
MICROBIAL MICROBIAL INDICA INDICATORS<br />
INDICA TORS<br />
Microbiological tests are generally complex and need a<br />
lot <strong>of</strong> training and practice to yield reas<strong>on</strong>ably reliable<br />
results. Fecal Coliform MPN is by far the most important<br />
microbial indicator from water quality point <strong>of</strong> view<br />
because <strong>of</strong> its direct health significance 11,22,23 . The FC<br />
values, observed in Yamuna river Delhi segment flow,<br />
at various sampling locati<strong>on</strong>s and dates have been<br />
plotted against the HPC in Figure 4(b) and against TC<br />
in Figure 4(c). The relati<strong>on</strong>ships evaluated, with the<br />
1.0E + 08<br />
1.0E + 07<br />
1.0E + 06<br />
1.0E + 05<br />
1.0E + 04<br />
1.0E + 03<br />
1.0E+03 1.0E+04 1.0E+05 1.0E+06 1.0E+07 1.0E+08<br />
Figure Figure 4 4 Inter Inter-relati<strong>on</strong>ship Inter -relati<strong>on</strong>ship graphs<br />
graphs<br />
TC, MPN/100 ml (log scale)<br />
Vol 88, March 2008 59<br />
BOD, mg/l<br />
FC, MPN/100 ml<br />
(log scale)<br />
FC, MPN/100 ml<br />
(log scale)<br />
60<br />
50<br />
40<br />
30<br />
20<br />
10<br />
0<br />
0 20 40 60 80 100 120 140<br />
1.00E + 08<br />
1.00E + 07<br />
1.00E + 06<br />
1.00E + 05<br />
1.00E + 04<br />
BOD = 0.454 COD<br />
R 2 = 0.9312<br />
COD, mg/l<br />
(a)<br />
1.00E + 03<br />
1.00E+03 1.00E+04 1.00E+05 1.00E+06 1.00E+07<br />
HPC, CFU/ml (log scale)<br />
(b)<br />
FC = 0.0791 TC 1.1047<br />
R 2 = 0.9559<br />
(c)<br />
FC = 0.0182 HPC 1.5343<br />
R 2 = 0.9598
degree <strong>of</strong> correlati<strong>on</strong> greater than 95 %, are<br />
♦ FC, MPN /100 ml = 0.0232 × TC 1.1697 , MPN/100ml<br />
♦ FC, MPN /100 ml = 0.0326 × HPC 1.4742 /ml<br />
The results <strong>of</strong> Fecal Coliform obtained by laboratory<br />
analysis can be verified by comparing the results<br />
obtained from various inter-relati<strong>on</strong>ships investigated<br />
in this study. The duplicate analysis or use <strong>of</strong> c<strong>on</strong>trol<br />
tubes can be avoided in routine microbial analysis.<br />
CONCLUSIONS<br />
CONCLUSIONS<br />
CONCLUSIONS<br />
♦ During the last 20 years, the annual average value<br />
<strong>of</strong> BOD, TC and FC value, in river Yamuna, has<br />
increases from 17.0 mg/l to 34.2 mg/l, 2.06 E05 MPN/<br />
100 ml to 9.3 E06 MPN/100 ml and 1.4 E05 MPN/100<br />
ml to 4.6 E06 MPN/100 ml, respectively. The BOD<br />
value increases by 100 percent, TC and FC Values<br />
increased to 4000 % and 3000 % fold, respectively. The<br />
relatively higher increase in Microbiological polluti<strong>on</strong><br />
load shows that little emphasis was given to c<strong>on</strong>trol <strong>of</strong><br />
the microbial quality <strong>of</strong> effluents being discharged in<br />
river.<br />
♦ The high values <strong>of</strong> microbial indicators and<br />
pathogens detected revealed that the microbiological<br />
quality <strong>of</strong> water was poor, unsafe and not acceptable<br />
even for the lowest DBU. The deteriorati<strong>on</strong> in water<br />
quality is found due to the regular outfalls <strong>of</strong> 23 drains<br />
carrying wastewater to river Yamuna during Delhi<br />
Segment. Approximately 3296 MLD/day <strong>of</strong> sewage by<br />
virtue <strong>of</strong> above drains outfalls in Yamuna. Despite the<br />
above scenario, the people <strong>of</strong> Delhi extensively use the<br />
water <strong>of</strong> river Yamuna for various purposes. The<br />
results <strong>of</strong> the study have revealed the need for planning<br />
and implementati<strong>on</strong> <strong>of</strong> various polluti<strong>on</strong> abatement<br />
measures for improvement in the river water quality<br />
as per requirement <strong>of</strong> DBU.<br />
♦ The rapid method developed for estimati<strong>on</strong> <strong>of</strong> organic<br />
polluti<strong>on</strong> and microbial polluti<strong>on</strong>, through inter<br />
relati<strong>on</strong>ships, namely, chemical oxygen demand and<br />
Fecal Coliform, can be helpful in routine analysis <strong>of</strong><br />
river water quality. This method can also be applied<br />
for evaluati<strong>on</strong> <strong>of</strong> water treatment efficiency at the<br />
water treatment plant as well as sewage treatment<br />
plant installed in Delhi, more frequently and in lesser<br />
time.<br />
REFERENCES<br />
REFERENCES<br />
1. B K Sharma. ‘Water Polluti<strong>on</strong>’. Goel Publishing House, UP, India,<br />
2001.<br />
2. CPCB . ‘Water Quality in India, Status and Trend (1990 - 2001)’.<br />
M<strong>on</strong>itoring <strong>of</strong> India Nati<strong>on</strong>al Aquatic Resources Series: MINARS,<br />
vol 17, 2002 - 2003,Delhi.<br />
3. CPCB. ‘Annual Report 2002 - 2003’.<br />
4. www.cpcb.nic.in , CPCB Web Site.<br />
5. www.yap.nic.in , Yamuna Acti<strong>on</strong> Plan Web Site.<br />
6. C J Hurtz, R L Crawford, M J Mclnerney and L D Stetzenbach.<br />
‘Manual <strong>of</strong> Envir<strong>on</strong>mental Microbiology’. Sec<strong>on</strong>d Editi<strong>on</strong>, ASM Press,<br />
Washingt<strong>on</strong>, 2002.<br />
7. NHMRC. ‘<strong>Microbial</strong> Indicators <strong>of</strong> Water Quality’. An NHMRC<br />
Discussi<strong>on</strong> Paper, 2001.<br />
8. J A Tree and M R Adams. ‘Chlorinati<strong>on</strong> <strong>of</strong> Indicator Bacteria and<br />
Viruses in Primary Sewage Effluent’. Journal <strong>of</strong> Applied and<br />
Envir<strong>on</strong>mental Microbiology, vol 69, no 4, 2003, pp 2038 - 2043.<br />
9. CPCB. ‘Water Quality Status <strong>of</strong> Yamuna <strong>River</strong>’. Assessment and<br />
Development <str<strong>on</strong>g>Study</str<strong>on</strong>g> <strong>of</strong> <strong>River</strong> Basin Series: ADSORBS, vol 32, 1999 -<br />
2000.<br />
10. S Aggarwal and R C Trevedi. ‘Ecological Analysis <strong>of</strong> The <strong>River</strong><br />
Yamuna — a Functi<strong>on</strong>al Approach in a Diversified Ecosystem in India’.<br />
Arch Hydrobiol Suppl, vol 0945-3748/95/0101, 1995, pp 405 - 426.<br />
11. CPCB. ‘Basin Sub-basin Inventory <strong>of</strong> Water Polluti<strong>on</strong>: The Ganga<br />
Basin’. Part I. ‘The Yamuna Sub-basin (1977 - 1978)’. Assessment<br />
and Development <str<strong>on</strong>g>Study</str<strong>on</strong>g> <strong>of</strong> <strong>River</strong> Basin Series: ADSORBS, vol 2, 1980-<br />
1981.<br />
12. IS:1622-1981. ‘Method <strong>of</strong> Sampling and Microbiological<br />
Examinati<strong>on</strong> <strong>of</strong> Water’. Editi<strong>on</strong> 2.4, BIS, New Delhi, Reaffirmed 1996,<br />
2003 to 2005.<br />
13. ‘Standard Methods for Examinati<strong>on</strong> <strong>of</strong> Water and Wastewater’.<br />
19th Editi<strong>on</strong> and 20th Editi<strong>on</strong>, APHA, AWWA, WPCF, New York,<br />
1995 and 1998.<br />
14. ‘Analysis <strong>of</strong> Wastewater for use in Agriculture: A Laboratory<br />
Manual <strong>of</strong> Parasitological and Bacteriological Techniques’. World<br />
Health Organizati<strong>on</strong>, 1996.<br />
15 F A Gaudy. ‘Microbiology for Envir<strong>on</strong>mental Scientists and<br />
Engineers’. McGraw Hill Internati<strong>on</strong>al Book Company, 1998.<br />
16. Metcalf and Eddy. ‘Wastewater Engineering Treatment Disposal<br />
and Reuse’. Tata McGraw-Hill Publicati<strong>on</strong> Co Ltd, New Delhi, 2003.<br />
17. N Kumar. ‘Polluti<strong>on</strong> Studies <strong>on</strong> <strong>River</strong> Ramganga at Moradabad’.<br />
ME Thesis, Env Engg Secti<strong>on</strong>, Civil Engg Deptt, UOR, Roorkee,<br />
1997.<br />
18. World Health Organizati<strong>on</strong>. ‘Water Quality: Guidelines, Standards<br />
and Health’. IWA Publishing, 2002, L<strong>on</strong>d<strong>on</strong>.<br />
19. S J Arceivala. ‘Wastewater Treatment and Disposal’. Marcel<br />
Dekker, Inc Newyork and Basal, 1981.<br />
20. A H EL-Shaarawi and R E Kwiatkowski. ‘Statistical Aspects <strong>of</strong><br />
Water Quality M<strong>on</strong>itoring’. Elsevier Science Publishers, New York,<br />
1985.<br />
21. C N Sawyer, P L McCarty and G F Parkin. ‘Chemistry for<br />
Envir<strong>on</strong>mental Engineering’. Fifth Editi<strong>on</strong>, Tata McGraw-Hill<br />
Publicati<strong>on</strong> Co Ltd, New Delhi, 2003.<br />
22. C Gantzer, P Gaspard,L Galvez, A Huyard, N Dumouthier and J<br />
Schwartzbrod. ‘M<strong>on</strong>itoring <strong>of</strong> Bacterial and Parasitological<br />
C<strong>on</strong>taminati<strong>on</strong> During Various Treatment <strong>of</strong> Sludge’. Journal <strong>of</strong><br />
Water Research, vol 35, no 16, 2001, pp 3763 - 3770.<br />
23. P R Trevedi. ‘Envir<strong>on</strong>mental Polluti<strong>on</strong> and C<strong>on</strong>trol’. APH<br />
Publishing Corporati<strong>on</strong>, New Delhi, 2004.<br />
60 IE(I) Journal–EN