Effect of management strategies on reducing heat stress of feedlot ...
Effect of management strategies on reducing heat stress of feedlot ...
Effect of management strategies on reducing heat stress of feedlot ...

Create successful ePaper yourself
Turn your PDF publications into a flip-book with our unique Google optimized e-Paper software.
<str<strong>on</strong>g>Effect</str<strong>on</strong>g> <str<strong>on</strong>g>of</str<strong>on</strong>g> <str<strong>on</strong>g>management</str<strong>on</strong>g> <str<strong>on</strong>g>strategies</str<strong>on</strong>g> <strong>on</strong> <strong>reducing</strong> <strong>heat</strong> <strong>stress</strong><br />
<str<strong>on</strong>g>of</str<strong>on</strong>g> <strong>feedlot</strong> cattle: Feed and water intake 1<br />
T. L. Mader* 2 and M. S. Davis†<br />
*University <str<strong>on</strong>g>of</str<strong>on</strong>g> Nebraska, Northeast Research and Extensi<strong>on</strong> Center, C<strong>on</strong>cord 68728; and<br />
†Koers-Turge<strong>on</strong> C<strong>on</strong>sulting Services, Inc., Salina, KS 67401<br />
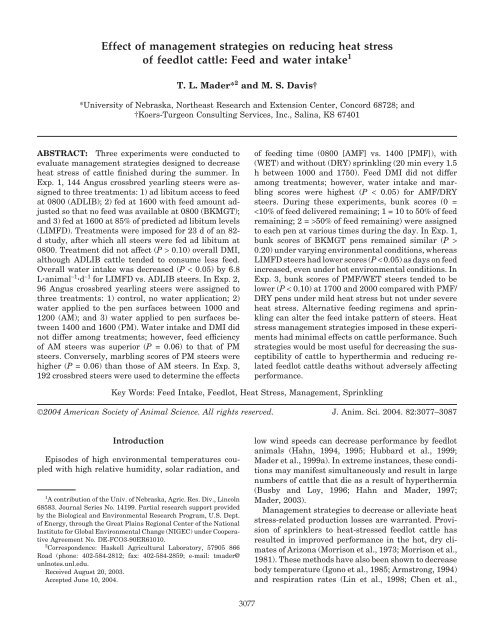
ABSTRACT: Three experiments were c<strong>on</strong>ducted to<br />
evaluate <str<strong>on</strong>g>management</str<strong>on</strong>g> <str<strong>on</strong>g>strategies</str<strong>on</strong>g> designed to decrease<br />
<strong>heat</strong> <strong>stress</strong> <str<strong>on</strong>g>of</str<strong>on</strong>g> cattle finished during the summer. In<br />
Exp. 1, 144 Angus crossbred yearling steers were assigned<br />
to three treatments: 1) ad libitum access to feed<br />
at 0800 (ADLIB); 2) fed at 1600 with feed amount adjusted<br />
so that no feed was available at 0800 (BKMGT);<br />
and 3) fed at 1600 at 85% <str<strong>on</strong>g>of</str<strong>on</strong>g> predicted ad libitum levels<br />
(LIMFD). Treatments were imposed for 23 d <str<strong>on</strong>g>of</str<strong>on</strong>g> an 82d<br />
study, after which all steers were fed ad libitum at<br />
0800. Treatment did not affect (P > 0.10) overall DMI,<br />
although ADLIB cattle tended to c<strong>on</strong>sume less feed.<br />
Overall water intake was decreased (P < 0.05) by 6.8<br />
Lanimal −1 d −1 for LIMFD vs. ADLIB steers. In Exp. 2,<br />
96 Angus crossbred yearling steers were assigned to<br />
three treatments: 1) c<strong>on</strong>trol, no water applicati<strong>on</strong>; 2)<br />
water applied to the pen surfaces between 1000 and<br />
1200 (AM); and 3) water applied to pen surfaces between<br />
1400 and 1600 (PM). Water intake and DMI did<br />
not differ am<strong>on</strong>g treatments; however, feed efficiency<br />
<str<strong>on</strong>g>of</str<strong>on</strong>g> AM steers was superior (P = 0.06) to that <str<strong>on</strong>g>of</str<strong>on</strong>g> PM<br />
steers. C<strong>on</strong>versely, marbling scores <str<strong>on</strong>g>of</str<strong>on</strong>g> PM steers were<br />
higher (P = 0.06) than those <str<strong>on</strong>g>of</str<strong>on</strong>g> AM steers. In Exp. 3,<br />
192 crossbred steers were used to determine the effects<br />
Key Words: Feed Intake, Feedlot, Heat Stress, Management, Sprinkling<br />
©2004 American Society <str<strong>on</strong>g>of</str<strong>on</strong>g> Animal Science. All rights reserved. J. Anim. Sci. 2004. 82:3077–3087<br />
Introducti<strong>on</strong><br />
Episodes <str<strong>on</strong>g>of</str<strong>on</strong>g> high envir<strong>on</strong>mental temperatures coupled<br />
with high relative humidity, solar radiati<strong>on</strong>, and<br />
1 A c<strong>on</strong>tributi<strong>on</strong> <str<strong>on</strong>g>of</str<strong>on</strong>g> the Univ. <str<strong>on</strong>g>of</str<strong>on</strong>g> Nebraska, Agric. Res. Div., Lincoln<br />
68583. Journal Series No. 14199. Partial research support provided<br />
by the Biological and Envir<strong>on</strong>mental Research Program, U.S. Dept.<br />
<str<strong>on</strong>g>of</str<strong>on</strong>g> Energy, through the Great Plains Regi<strong>on</strong>al Center <str<strong>on</strong>g>of</str<strong>on</strong>g> the Nati<strong>on</strong>al<br />
Institute for Global Envir<strong>on</strong>mental Change (NIGEC) under Cooperative<br />
Agreement No. DE-FCO3-90ER61010.<br />
2 Corresp<strong>on</strong>dence: Haskell Agricultural Laboratory, 57905 866<br />
Road (ph<strong>on</strong>e: 402-584-2812; fax: 402-584-2859; e-mail: tmader@<br />
unlnotes.unl.edu.<br />
Received August 20, 2003.<br />
Accepted June 10, 2004.<br />
3077<br />
<str<strong>on</strong>g>of</str<strong>on</strong>g> feeding time (0800 [AMF] vs. 1400 [PMF]), with<br />
(WET) and without (DRY) sprinkling (20 min every 1.5<br />
h between 1000 and 1750). Feed DMI did not differ<br />
am<strong>on</strong>g treatments; however, water intake and marbling<br />
scores were highest (P < 0.05) for AMF/DRY<br />
steers. During these experiments, bunk scores (0 =<br />
50% <str<strong>on</strong>g>of</str<strong>on</strong>g> feed remaining) were assigned<br />
to each pen at various times during the day. In Exp. 1,<br />
bunk scores <str<strong>on</strong>g>of</str<strong>on</strong>g> BKMGT pens remained similar (P ><br />
0.20) under varying envir<strong>on</strong>mental c<strong>on</strong>diti<strong>on</strong>s, whereas<br />
LIMFD steers had lower scores (P < 0.05) as days <strong>on</strong> feed<br />
increased, even under hot envir<strong>on</strong>mental c<strong>on</strong>diti<strong>on</strong>s. In<br />
Exp. 3, bunk scores <str<strong>on</strong>g>of</str<strong>on</strong>g> PMF/WET steers tended to be<br />
lower (P < 0.10) at 1700 and 2000 compared with PMF/<br />
DRY pens under mild <strong>heat</strong> <strong>stress</strong> but not under severe<br />
<strong>heat</strong> <strong>stress</strong>. Alternative feeding regimens and sprinkling<br />
can alter the feed intake pattern <str<strong>on</strong>g>of</str<strong>on</strong>g> steers. Heat<br />
<strong>stress</strong> <str<strong>on</strong>g>management</str<strong>on</strong>g> <str<strong>on</strong>g>strategies</str<strong>on</strong>g> imposed in these experiments<br />
had minimal effects <strong>on</strong> cattle performance. Such<br />
<str<strong>on</strong>g>strategies</str<strong>on</strong>g> would be most useful for decreasing the susceptibility<br />
<str<strong>on</strong>g>of</str<strong>on</strong>g> cattle to hyperthermia and <strong>reducing</strong> related<br />
<strong>feedlot</strong> cattle deaths without adversely affecting<br />
performance.<br />
low wind speeds can decrease performance by <strong>feedlot</strong><br />
animals (Hahn, 1994, 1995; Hubbard et al., 1999;<br />
Mader et al., 1999a). In extreme instances, these c<strong>on</strong>diti<strong>on</strong>s<br />
may manifest simultaneously and result in large<br />
numbers <str<strong>on</strong>g>of</str<strong>on</strong>g> cattle that die as a result <str<strong>on</strong>g>of</str<strong>on</strong>g> hyperthermia<br />
(Busby and Loy, 1996; Hahn and Mader, 1997;<br />
Mader, 2003).<br />
Management <str<strong>on</strong>g>strategies</str<strong>on</strong>g> to decrease or alleviate <strong>heat</strong><br />
<strong>stress</strong>-related producti<strong>on</strong> losses are warranted. Provisi<strong>on</strong><br />
<str<strong>on</strong>g>of</str<strong>on</strong>g> sprinklers to <strong>heat</strong>-<strong>stress</strong>ed <strong>feedlot</strong> cattle has<br />
resulted in improved performance in the hot, dry climates<br />
<str<strong>on</strong>g>of</str<strong>on</strong>g> Ariz<strong>on</strong>a (Morris<strong>on</strong> et al., 1973; Morris<strong>on</strong> et al.,<br />
1981). These methods have also been shown to decrease<br />
body temperature (Ig<strong>on</strong>o et al., 1985; Armstr<strong>on</strong>g, 1994)<br />
and respirati<strong>on</strong> rates (Lin et al., 1998; Chen et al.,
3078<br />
1993). Altering feeding time and/or amount have been<br />
shown to be beneficial in <strong>reducing</strong> <strong>heat</strong> <strong>stress</strong> (Brosh<br />
et al., 1998). Feeding cattle later in the day prevents<br />
the coincidal occurrence <str<strong>on</strong>g>of</str<strong>on</strong>g> peak metabolic and envir<strong>on</strong>mental<br />
<strong>heat</strong> load (Reinhardt and Brandt, 1994; Brosh<br />
et al., 1998). Limiting energy intake can effectively decrease<br />
basal metabolic <strong>heat</strong> producti<strong>on</strong> (Carstens et al.,<br />
1989) and therefore decrease total metabolic <strong>heat</strong> load<br />
<str<strong>on</strong>g>of</str<strong>on</strong>g> animals subjected to high envir<strong>on</strong>mental temperatures.<br />
Furthermore, energy restricti<strong>on</strong> programs have<br />
resulted in improved efficiency <str<strong>on</strong>g>of</str<strong>on</strong>g> cattle maintained under<br />
therm<strong>on</strong>eutral envir<strong>on</strong>ments (Murphy and<br />
Loerch, 1994).<br />
Davis et al. (2003) reported that altering feeding regimen<br />
and/or sprinkling cattle significantly decreased<br />
<strong>feedlot</strong> cattle <strong>heat</strong> <strong>stress</strong>, as determined from tympanic<br />
temperature. The objectives <str<strong>on</strong>g>of</str<strong>on</strong>g> these studies were to<br />
evaluate the strategic use <str<strong>on</strong>g>of</str<strong>on</strong>g> altered feeding times and<br />
amounts both apart from and in additi<strong>on</strong> to provisi<strong>on</strong><br />
<str<strong>on</strong>g>of</str<strong>on</strong>g> sprinklers <strong>on</strong> <strong>feedlot</strong> steers finished in the summer<br />
m<strong>on</strong>ths.<br />
Materials and Methods<br />
All experiments reported herein were c<strong>on</strong>ducted at<br />
the University <str<strong>on</strong>g>of</str<strong>on</strong>g> Nebraska Haskell Agricultural Laboratory<br />
with the approval <str<strong>on</strong>g>of</str<strong>on</strong>g> the University <str<strong>on</strong>g>of</str<strong>on</strong>g> Nebraska-<br />
Lincoln Instituti<strong>on</strong>al Animal Care and Use Committee.<br />
Facility design and layout has been reported by Mader<br />
et al. (1997, 1999a). Facilities are located at lat 42°23′<br />
N and l<strong>on</strong>g 96°57′ W, with a mean elevati<strong>on</strong> <str<strong>on</strong>g>of</str<strong>on</strong>g> 445<br />
m above sea level. Details <str<strong>on</strong>g>of</str<strong>on</strong>g> the vaccinati<strong>on</strong>, parasite<br />
c<strong>on</strong>trol, and implant regimens utilized for these experiments<br />
are reported by Davis et al. (2003). Experimental<br />
design, sprinkling procedures, and climate data were<br />
also reported by Davis et al. (2003). Procedures used<br />
to obtain carcass data are described by Mader and Lechtenberg<br />
(2000). In all experiments, individual initial<br />
weight was the average <str<strong>on</strong>g>of</str<strong>on</strong>g> two n<strong>on</strong>shrunk weights<br />
taken <strong>on</strong> c<strong>on</strong>secutive days (d −1 and 0).<br />
Experiment 1<br />
On June 23, 144 Angus × Charolais crossbred steers<br />
were randomly assigned to <strong>on</strong>e <str<strong>on</strong>g>of</str<strong>on</strong>g> 24 pens (six steers<br />
per pen). Treatments assigned to pens (eight pens per<br />
treatment) were as follows: 1) providing ad libitum access<br />
to feed at 0800 (ADLIB); 2) providing feed at 1600<br />
with amount adjusted so that n<strong>on</strong>e was available at<br />
0800 (BKMGT); and 3) providing feed at 1600 at 85%<br />
<str<strong>on</strong>g>of</str<strong>on</strong>g> predicted ad libitum levels (LIMFD). All steers were<br />
adjusted to the diet being fed, over a 21-d period, before<br />
initiati<strong>on</strong> <str<strong>on</strong>g>of</str<strong>on</strong>g> this experiment. The DMI by steers in the<br />
LIMFD treatment group was determined before initiati<strong>on</strong><br />
<str<strong>on</strong>g>of</str<strong>on</strong>g> the study and was based <strong>on</strong> projected gain and<br />
associated daily DMI <str<strong>on</strong>g>of</str<strong>on</strong>g> comparable cattle <str<strong>on</strong>g>of</str<strong>on</strong>g>fered feed<br />
ad libitum using computer s<str<strong>on</strong>g>of</str<strong>on</strong>g>tware (NRC, 1996), based<br />
<strong>on</strong> breed type, age, body c<strong>on</strong>diti<strong>on</strong>, frame size, and diet.<br />
Ingredient and nutrient compositi<strong>on</strong> <str<strong>on</strong>g>of</str<strong>on</strong>g> the diet in this<br />
Mader and Davis<br />
Table 1. Ingredient and nutrient compositi<strong>on</strong> <str<strong>on</strong>g>of</str<strong>on</strong>g> diets fed<br />
during Exp. 1, 2, and 3<br />
Item Exp. 1 and 2 Exp. 3<br />
%, DM basis<br />
Ingredients<br />
Dry-rolled corn 84.00 81.00<br />
Alfalfa hay 7.50 5.00<br />
Corn silage — 5.00<br />
Soybean meal 2.00 2.50<br />
Liquid supplement a<br />
4.50 4.50<br />
Dry supplement b<br />
Compositi<strong>on</strong><br />
2.00 2.00<br />
c<br />
CP, % 13.0 13.0<br />
NEm, Mcal/kg 2.10 2.10<br />
ME, Mcal/kg 3.08 3.08<br />
NEg, Mcal/kg 1.43 1.43<br />
Ca, % 0.70 0.70<br />
P, % 0.34 0.33<br />
K, % 0.75 0.76<br />
a C<strong>on</strong>tained <strong>on</strong> a DM basis: 61.54% CP; 12.30% Ca; 5.39% salt;<br />
3.85% K; 0.71% P; 0.43% Mg; 0.148% Zn; 0.037% Fe; 0.050% Mn;<br />
0.021% Cu; 0.002% I; 0.001% Co; 7 × 10 4 IU/kg vitamin A; 1 × 10 4<br />
IU/kg vitamin D; and 44 IU/kg vitamin E.<br />
b C<strong>on</strong>tained <strong>on</strong> a DM basis: 50.01% soybean meal; 48.57% ground<br />
corn; 0.85% Rumensin 80 (176.4 g <str<strong>on</strong>g>of</str<strong>on</strong>g> m<strong>on</strong>ensin/kg; Elanco Animal<br />
Health, Indianapolis, IN); 0.51% Tylan 40 (89 g <str<strong>on</strong>g>of</str<strong>on</strong>g> tylosin/kg; Elanco<br />
Animal Health); and 0.06% thiamine m<strong>on</strong><strong>on</strong>itrate.<br />
c Calculated compositi<strong>on</strong> (NRC, 1996).<br />
and subsequent experiments are shown in Table 1.<br />
Treatments were imposed for a 23-d managed feeding<br />
phase, after which all steers were fed ad libitum at<br />
0800 h. A 23-d managed feeding phase was used to<br />
corresp<strong>on</strong>d with the period <str<strong>on</strong>g>of</str<strong>on</strong>g> time cattle were adapting<br />
to summer <strong>heat</strong>, typically late June and the first few<br />
weeks <str<strong>on</strong>g>of</str<strong>on</strong>g> July, and the more <strong>stress</strong>ful porti<strong>on</strong> <str<strong>on</strong>g>of</str<strong>on</strong>g> the<br />
summer (Mader et al., 1999a). A short managed feeding<br />
period was used because minimal use <str<strong>on</strong>g>of</str<strong>on</strong>g> alternative<br />
feeding systems is preferred to the norm in most feeding<br />
operati<strong>on</strong>s.<br />
Daily feed was recorded. Water meters (model C700,<br />
ABB Water Meters, Inc., Ocala, FL) were used to record<br />
daily water intake when bunks were read before feeding.<br />
Body weights were obtained <strong>on</strong> d 23 and 82 (experiment<br />
terminati<strong>on</strong>). On d 83, steers were slaughtered<br />
at a commercial slaughter facility where hot carcass<br />
weight, 12th-rib fat thickness, marbling score, and yield<br />
grade were obtained. Each pen shares a waterer and<br />
mound with an adjoining pen; therefore, for this and<br />
subsequent experiments, treatments were randomly<br />
assigned to sets <str<strong>on</strong>g>of</str<strong>on</strong>g> two pens, which shared a waterer<br />
and a mound.<br />
Experiment 2<br />
On June 23, 96 Angus × Charolais crossbred steers<br />
were randomly assigned to <strong>on</strong>e <str<strong>on</strong>g>of</str<strong>on</strong>g> 12 pens (eight steers<br />
per pen). Treatments assigned to pens (four pens per<br />
treatment) were as follows: 1) no water sprinkling<br />
(CON); 2) sprinkling <str<strong>on</strong>g>of</str<strong>on</strong>g> pen surface from 1000 to 1200<br />
(AM); and 3) sprinkling <str<strong>on</strong>g>of</str<strong>on</strong>g> pen surface from 1400 to 1600
(PM) when predicted maximum temperature-humidity<br />
index (THI) was ≥77. The decisi<strong>on</strong> for water applicati<strong>on</strong><br />
was made at 1000 based <strong>on</strong> local weather reports and<br />
current climatic c<strong>on</strong>diti<strong>on</strong>s. The THI was calculated<br />
as THI = (0.8 × ambient temperature) + [(% relative<br />
humidity/100) × (ambient temperature − 14.4)] + 46.4<br />
(Thom, 1959; NOAA, 1976). Water was applied to the<br />
mound areas <str<strong>on</strong>g>of</str<strong>on</strong>g> the pens using impact sprinklers (Rainbird,<br />
Nels<strong>on</strong>, Peoria, IL) placed at ground level. Water<br />
applicati<strong>on</strong> time was c<strong>on</strong>trolled using an electr<strong>on</strong>ic<br />
timer (Nels<strong>on</strong>, Peoria, IL). A semicircular area <str<strong>on</strong>g>of</str<strong>on</strong>g> the<br />
pen was wetted to provide 2.4 m 2 /steer <str<strong>on</strong>g>of</str<strong>on</strong>g> wetted surface.<br />
Water was applied for a total <str<strong>on</strong>g>of</str<strong>on</strong>g> 23 d <str<strong>on</strong>g>of</str<strong>on</strong>g> the 82-d<br />
study. Water was strategically applied <strong>on</strong>ly <strong>on</strong> those<br />
days when <strong>heat</strong> <strong>stress</strong> had a high probability <str<strong>on</strong>g>of</str<strong>on</strong>g> occurring<br />
to minimize mud accumulati<strong>on</strong> and undesirable<br />
effects <str<strong>on</strong>g>of</str<strong>on</strong>g> acclimating cattle to cool c<strong>on</strong>diti<strong>on</strong>s in the<br />
event water was applied <strong>on</strong> n<strong>on</strong><strong>heat</strong>-<strong>stress</strong> days.<br />
Daily feed and water intake were recorded throughout<br />
the experiment. Body weights were obtained <strong>on</strong> d<br />
34 and 82 (experiment terminati<strong>on</strong>). On d 83, steers<br />
were slaughtered at a commercial slaughter facility<br />
where hot carcass weight, 12th-rib fat thickness, marbling<br />
score, and yield grade were obtained.<br />
Experiment 3<br />
One hundred ninety-two British crossbred steers<br />
were assigned randomly to 24 pens (eight steers per<br />
pen) and used in a 2 × 2 completely randomized design.<br />
The two factors were feeding time (0800 [AMF] vs. 1400<br />
[PMF]) and sprinkling (no water applicati<strong>on</strong> [DRY] vs.<br />
sprinkling [WET]). From d 0 (June 8) to 21, all steers<br />
had ad libitum access to feed beginning at 0800, with<br />
no applicati<strong>on</strong> <str<strong>on</strong>g>of</str<strong>on</strong>g> water to the treatment pens (covariate<br />
period). Treatments were initiated <strong>on</strong> d 21. Method <str<strong>on</strong>g>of</str<strong>on</strong>g><br />
water applicati<strong>on</strong> was similar to Exp. 2 except that<br />
sprinklers were positi<strong>on</strong>ed approximately 2 m above<br />
the pen surface. Water was applied to pens when THI<br />
at 0900 was ≥ 68 using sprinklers electr<strong>on</strong>ically linked<br />
to the <strong>on</strong>-site weather stati<strong>on</strong>s. If the THI threshold<br />
was obtained, an electr<strong>on</strong>ic solenoid opened to allow<br />
for water flow. Electr<strong>on</strong>ic timers (Nels<strong>on</strong>, Peoria, IL)<br />
c<strong>on</strong>trolled water flow and the time water was to be<br />
applied, as described by Davis et al. (2003). Based <strong>on</strong><br />
data obtained in Exp. 2, the THI threshold value <str<strong>on</strong>g>of</str<strong>on</strong>g> 68<br />
was determined using regressi<strong>on</strong> equati<strong>on</strong>s with THI<br />
at 0700, 0800, and 0900 as the independent variable,<br />
and daily maximal THI as the dependent variable. The<br />
database for the equati<strong>on</strong> comprised THI values compiled<br />
by a weather stati<strong>on</strong> located in the center <str<strong>on</strong>g>of</str<strong>on</strong>g> the<br />
<strong>feedlot</strong> facility for the m<strong>on</strong>ths <str<strong>on</strong>g>of</str<strong>on</strong>g> July and August. The<br />
correlati<strong>on</strong> coefficients for daily maximum THI vs.<br />
hourly THI at 0700, 0800, and 0900 were 0.62, 0.71,<br />
and 0.77, respectively; thus, THI at 0900 was used as<br />
the threshold. Experiment 3 was initiated at an earlier<br />
date than Exp. 1 and 2 to mimic c<strong>on</strong>diti<strong>on</strong>s for cattle<br />
that are already <strong>on</strong> feed before the start <str<strong>on</strong>g>of</str<strong>on</strong>g> the summer<br />
seas<strong>on</strong> and typically would not require <str<strong>on</strong>g>management</str<strong>on</strong>g><br />
Reducing <strong>heat</strong> <strong>stress</strong> <str<strong>on</strong>g>of</str<strong>on</strong>g> <strong>feedlot</strong> cattle 3079<br />
for <strong>heat</strong> <strong>stress</strong> at that time. In additi<strong>on</strong>, in Exp. 2 and<br />
3, the sprinklers were set up to apply water <strong>on</strong>ly <strong>on</strong><br />
days with a high probability <str<strong>on</strong>g>of</str<strong>on</strong>g> being <strong>stress</strong>ful for the<br />
cattle. In Exp. 2 and 3, sprinklers were set to deliver<br />
approximately 38 L <str<strong>on</strong>g>of</str<strong>on</strong>g> water per head during the total<br />
sprinkling period <str<strong>on</strong>g>of</str<strong>on</strong>g> 2 h. The area sprinkled in Exp. 3<br />
was the same as that sprinkled in Exp. 2. Since the<br />
sprinkling regimen was imposed throughout the 22 to<br />
83-d experimental period in Exp. 3, the alternative feeding<br />
system used in that experiment was imposed during<br />
the same period vs. using a shorter managed feeding<br />
phase described in Exp. 1.<br />
Daily feed and water intakes were recorded throughout<br />
the experiment. M<strong>on</strong>ensin and Tylan (Elanco Animal<br />
Health, Indianapolis, Indiana) were provided in<br />
the diet at 30 and 9 mg/kg, respectively (DM basis).<br />
Body weights were obtained <strong>on</strong> d 21, 56, and 83 (experiment<br />
terminati<strong>on</strong>). On d 84, steers were slaughtered<br />
at a commercial slaughter facility where hot carcass<br />
weight, 12th-rib fat thickness, marbling score, and yield<br />
grade were obtained.<br />
Throughout these experiments, bunk scores were obtained<br />
for each pen based <strong>on</strong> the following scale: 0 =<br />
50% <str<strong>on</strong>g>of</str<strong>on</strong>g> feed remaining.<br />
In Exp. 1 and 2, bunk scores were obtained at 0900,<br />
1300, 1700, and 2100. In Exp. 3, bunk scores were obtained<br />
at 0800, 1100, 1400, 1700, and 2000 h. Depending<br />
<strong>on</strong> envir<strong>on</strong>mental c<strong>on</strong>diti<strong>on</strong>s associated with<br />
these experiments, scores were obtained during <strong>on</strong>e or<br />
more <str<strong>on</strong>g>of</str<strong>on</strong>g> the following envir<strong>on</strong>mental periods: therm<strong>on</strong>eutral<br />
(TNL) when average THI was 77. With the<br />
excepti<strong>on</strong> <str<strong>on</strong>g>of</str<strong>on</strong>g> the TNL period in Exp. 1, data were collected<br />
for a minimum <str<strong>on</strong>g>of</str<strong>on</strong>g> two c<strong>on</strong>secutive days within<br />
an envir<strong>on</strong>mental period and experiment.<br />
Statistical Analyses. Quantitative data from each experiment<br />
were analyzed using GLM procedures <str<strong>on</strong>g>of</str<strong>on</strong>g> SAS<br />
(SAS Inst., Inc., Cary, NC). Data for Exp. 1 were analyzed<br />
for the effects <str<strong>on</strong>g>of</str<strong>on</strong>g> treatment with the model including<br />
treatment and replicati<strong>on</strong>. Treatment differences<br />
were determined using LSD procedures. Statistical<br />
models for Exp. 2 included treatment and replicati<strong>on</strong>.<br />
Orthog<strong>on</strong>al c<strong>on</strong>trasts were used to determine treatment<br />
differences for CON vs. AM and PM, and AM vs. PM<br />
treatment groups. Experiment 3 was analyzed for main<br />
effects (feeding time and water applicati<strong>on</strong>) and their<br />
interacti<strong>on</strong>. Gain from d 0 to 21 was used as a covariate.<br />
Bunk score data were analyzed using PROC FREQ <str<strong>on</strong>g>of</str<strong>on</strong>g><br />
SAS. During the 23-d managed feeding period <str<strong>on</strong>g>of</str<strong>on</strong>g> Exp.<br />
1, bunk scores were analyzed within treatment with<br />
comparis<strong>on</strong>s made am<strong>on</strong>g envir<strong>on</strong>mental periods<br />
within time <str<strong>on</strong>g>of</str<strong>on</strong>g> observati<strong>on</strong>. In Exp. 2, treatment comparis<strong>on</strong>s<br />
<str<strong>on</strong>g>of</str<strong>on</strong>g> bunk scores were made within time under<br />
hot c<strong>on</strong>diti<strong>on</strong>s. In Exp. 3, differences in bunk scores<br />
between AMF and PMF feeding times were expected<br />
due to treatment design; thus, bunk scores were ana-
3080<br />
Table 2. <str<strong>on</strong>g>Effect</str<strong>on</strong>g> <str<strong>on</strong>g>of</str<strong>on</strong>g> managed feeding regimen <strong>on</strong> feed and<br />
water intake <str<strong>on</strong>g>of</str<strong>on</strong>g> yearling steers in Exp. 1<br />
Treatments a<br />
Item ADLIB BKMGT LIMFD SEM<br />
Weight, kg<br />
Initial (d 0) 433 434 432 0.9<br />
Interim (d 23) 480 b<br />
482 b<br />
469 c<br />
2.6<br />
d 82<br />
DMI, kg/d<br />
582 583 585 3.6<br />
d 0 to 23 9.60 b<br />
9.59 b<br />
8.44 c<br />
0.13<br />
d 24 to 82 10.61b 10.98 bc<br />
11.41 c<br />
0.22<br />
d 0 to 82<br />
G:F<br />
9.78 9.97 10.01 0.16<br />
d 0 to 23 0.213 0.217 0.191 0.009<br />
d 24 to 82 0.164 bc<br />
0.157 b<br />
0.171 c<br />
0.004<br />
d 0 to 82<br />
Water intake, L/d<br />
0.187 0.183 0.185 0.003<br />
d 0 to 23 33.15 33.46 27.52 1.69<br />
d 24 to 82 41.06 e<br />
43.49 e<br />
35.03 d<br />
0.63<br />
d 0 to 82 39.35 de<br />
41.18 e<br />
32.58 d<br />
0.87<br />
Water intake, L/Mcal <str<strong>on</strong>g>of</str<strong>on</strong>g> ME intake<br />
d 0 to 23 1.13 1.15 1.03 0.05<br />
d 24 to 82 1.22de 1.31e 1.02d 0.03<br />
d 0 to 82 1.28 e<br />
1.36 e<br />
1.08 d<br />
0.02<br />
a<br />
ADLIB = cattle were allowed access to feed at all times; BKMGT =<br />
cattle were fed at 1600 with bunks slick at 0800 the following day;<br />
LIMFD = cattle were delivered 85% <str<strong>on</strong>g>of</str<strong>on</strong>g> their predicted DMI at 1600.<br />
The BKMGT and LIMFD regimens were utilized for the first 23 d <str<strong>on</strong>g>of</str<strong>on</strong>g><br />
experiment.<br />
b,c<br />
Means within a row that do not have comm<strong>on</strong> superscripts differ<br />
(P < 0.05).<br />
d,e<br />
Means within a row that do not have comm<strong>on</strong> superscripts tended<br />
to differ (0.05 < P < 0.10).<br />
lyzed for the effect <str<strong>on</strong>g>of</str<strong>on</strong>g> sprinkling within each main effect<br />
<str<strong>on</strong>g>of</str<strong>on</strong>g> feeding regimen.<br />
Results<br />
Envir<strong>on</strong>mental c<strong>on</strong>diti<strong>on</strong>s associated with the various<br />
periods <str<strong>on</strong>g>of</str<strong>on</strong>g> <strong>heat</strong> <strong>stress</strong> during these experiments are<br />
provided by Davis et al. (2003). Experiments 1 and 2<br />
were c<strong>on</strong>ducted simultaneously over an 82-d time period.<br />
Mean daily (± SD) temperature and THI for Exp.<br />
1 and 2 were 22.1 ± 3.5°C and 69.5 ± 5.5°C, respectively.<br />
In Exp. 3, mean daily (± SD) temperature and THI were<br />
22.8 ± 3.20°C and 70.5 ± 4.7°C, respectively, during the<br />
22- to 83-d period treatments were imposed.<br />
Experiment 1<br />
Body weight, feed intake, gain efficiency, and water<br />
intake for the different feeding regimens are shown in<br />
Table 2. During the managed feeding period, LIMFD<br />
steers had a lower (P < 0.05) BW gain and DMI. This<br />
decrease in DMI was c<strong>on</strong>sistent with the treatment<br />
design. Following the initiati<strong>on</strong> <str<strong>on</strong>g>of</str<strong>on</strong>g> ad libitum feeding<br />
(d 24 to 82), LIMFD steers exhibited a 7.0% (P < 0.05)<br />
compensatory increase in DMI when compared with<br />
the DMI <str<strong>on</strong>g>of</str<strong>on</strong>g> the ADLIB treatment group. However, the<br />
BKMGT treatment group exhibited <strong>on</strong>ly a 3.5% numerical<br />
compensatory intake resp<strong>on</strong>se when compared with<br />
Mader and Davis<br />
Figure 1. Mean bunk scores <str<strong>on</strong>g>of</str<strong>on</strong>g> cattle fed ad libitum at<br />
0800 <strong>on</strong> d 9 and 13 (therm<strong>on</strong>eutral = TNL), 11 and 12<br />
(first <strong>heat</strong> <strong>stress</strong> period = HS1), 14 and 15 (moderate <strong>heat</strong><br />
<strong>stress</strong> = MHS), and 21 and 22 (sec<strong>on</strong>d <strong>heat</strong> <strong>stress</strong> period =<br />
HS2) <str<strong>on</strong>g>of</str<strong>on</strong>g> Exp. 1. a Bunk scores were assigned based <strong>on</strong> a 0<br />
to 2 scale: 0 = 50% <str<strong>on</strong>g>of</str<strong>on</strong>g> feed<br />
delivered remaining. Envir<strong>on</strong>mental c<strong>on</strong>diti<strong>on</strong>s were<br />
based <strong>on</strong> the temperature-humidity index (THI) and classified<br />
as follows: TNL = mean THI < 70; moderate <strong>heat</strong><br />
<strong>stress</strong> (MHS) = mean THI between 70 to 74; <strong>heat</strong> <strong>stress</strong> =<br />
mean THI between 74.1 and 77. *Bunk scores within an<br />
observati<strong>on</strong> time differ (χ 2 P < 0.05).<br />
the ADLIB group. These increases in DMI found during<br />
the ad libitum feeding period for the LIMFD treatment<br />
groups were achieved with a relatively short (23 d)<br />
managed feeding period. As a result <str<strong>on</strong>g>of</str<strong>on</strong>g> the LIMFD<br />
group compensating for the weight gain not realized<br />
during the 23-d managed feeding phase, weight gain<br />
and efficiency <str<strong>on</strong>g>of</str<strong>on</strong>g> feed c<strong>on</strong>versi<strong>on</strong> were increased (P <<br />
0.05) during the 24- to 82-d feeding period for the<br />
LIMFD group, particularly when compared with the<br />
BKMGT group. Water intake was similar during the<br />
ad libitum period between ADLIB and BKMGT steers,<br />
but numerically (although not significantly, P > 0.10)<br />
lower in LIMFD steers. This decrease resulted in overall<br />
water intake <str<strong>on</strong>g>of</str<strong>on</strong>g> LIMFD steers tending to be 16 and<br />
22% (P < 0.10) lower than ADLIB and BKMGT steers,<br />
respectively. When expressing water intake as L/Mcal<br />
<str<strong>on</strong>g>of</str<strong>on</strong>g> ME intake, LIMFD steers tended to have lower water<br />
intake (P < 0.10) than ADLIB and BKMGT steers over<br />
the entire experiment.<br />
Bunk scores for ADLIB steers during the managed<br />
feeding phase in Exp. 1 across TNL (d 9 and 13), the<br />
first HS period (HS1: d 11 and 12), MHS (d 14 and<br />
15), and the sec<strong>on</strong>d HS period (HS2: d 21 and 22) are<br />
presented in Figure 1. Compared within an observati<strong>on</strong>
Figure 2. Mean bunk scores <str<strong>on</strong>g>of</str<strong>on</strong>g> cattle fed at 1600 with<br />
bunks slick by 0800 the following day <strong>on</strong> d 9 and 13<br />
(therm<strong>on</strong>eutral = TNL), 11 and 12 (first <strong>heat</strong> <strong>stress</strong> period<br />
= HS1), 14 and 15 (moderate <strong>heat</strong> <strong>stress</strong> = MHS),<br />
and 21 and 22 (sec<strong>on</strong>d <strong>heat</strong> <strong>stress</strong> period = HS2) <str<strong>on</strong>g>of</str<strong>on</strong>g> Exp.<br />
1. a Bunk scores were assigned based <strong>on</strong> a 0 to 2 scale: 0 =<br />
50% <str<strong>on</strong>g>of</str<strong>on</strong>g> feed delivered remaining.<br />
Envir<strong>on</strong>mental c<strong>on</strong>diti<strong>on</strong>s were based <strong>on</strong> the<br />
temperature-humidity index (THI) and classified as follows:<br />
TNL = mean THI < 70; MHS = mean THI 70 to 74;<br />
<strong>heat</strong> <strong>stress</strong> = mean THI between 74.1 and 77.<br />
time across days, differences (P < 0.05) were observed<br />
at 0900, 1700, and 2100. Am<strong>on</strong>g envir<strong>on</strong>mental periods,<br />
bunk scores at 0900 were lower during MHS (d 14 and<br />
15). At 1300, bunk score for all days were similar, but<br />
those at 1700 and 2100 were highest during HS2 (d 21<br />
and 22).<br />
Bunk scores for BKMGT steers during the managed<br />
feeding phase are presented in Figure 2 and did not<br />
differ within time <str<strong>on</strong>g>of</str<strong>on</strong>g> observati<strong>on</strong> across TNL (d 9 and<br />
13), HS1 (d 11 and 12), MHS (d 14 and 15), or HS2 (d<br />
21 and 22), suggesting that under this system, cattle<br />
handled the <strong>heat</strong> load reas<strong>on</strong>ably well and/or eating<br />
pattern was not affected by climatic <strong>heat</strong> load. Figure<br />
3 shows bunk scores <str<strong>on</strong>g>of</str<strong>on</strong>g> LIMFD steers. There were differences<br />
(P < 0.001) in bunk scores <str<strong>on</strong>g>of</str<strong>on</strong>g> these steers at 1700.<br />
During HS1 (d 21 and 22), 50% <str<strong>on</strong>g>of</str<strong>on</strong>g> the pens had a bunk<br />
score <str<strong>on</strong>g>of</str<strong>on</strong>g> 1, whereas bunks were nearly clean during HS2<br />
by 1700, suggesting that over time LIMFD is an aid to<br />
cattle coping with excessive <strong>heat</strong>. Bunk scores <str<strong>on</strong>g>of</str<strong>on</strong>g> steers<br />
following ad libitum feeding were not affected by previous<br />
feeding regimen.<br />
Experiment 2<br />
Body weight, DMI, and efficiency <str<strong>on</strong>g>of</str<strong>on</strong>g> feed c<strong>on</strong>versi<strong>on</strong><br />
did not differ am<strong>on</strong>g treatments, although sprinkled<br />
Reducing <strong>heat</strong> <strong>stress</strong> <str<strong>on</strong>g>of</str<strong>on</strong>g> <strong>feedlot</strong> cattle 3081<br />
Figure 3. Mean bunk scores <str<strong>on</strong>g>of</str<strong>on</strong>g> cattle fed 85% <str<strong>on</strong>g>of</str<strong>on</strong>g> predicted<br />
ad libitum intake at 1600 <strong>on</strong> d 9 and 13 (therm<strong>on</strong>eutral<br />
= TNL), 11 and 12 (first <strong>heat</strong> <strong>stress</strong> period = HS1), 14<br />
and 15 (moderate <strong>heat</strong> <strong>stress</strong> = MHS), and 21 and 22<br />
(sec<strong>on</strong>d <strong>heat</strong> <strong>stress</strong> period = HS2) <str<strong>on</strong>g>of</str<strong>on</strong>g> Exp. 1. a Bunk scores<br />
were assigned based <strong>on</strong> a0to2scale: 0 = 50% <str<strong>on</strong>g>of</str<strong>on</strong>g> feed delivered remaining. Envir<strong>on</strong>mental<br />
c<strong>on</strong>diti<strong>on</strong>s were based <strong>on</strong> the temperaturehumidity<br />
index (THI) and classified as follows: TNL =<br />
mean THI < 70; MHS = mean THI between 70 and 74;<br />
<strong>heat</strong> <strong>stress</strong> = mean THI between 74.1 and 77. *Bunk scores<br />
within an observati<strong>on</strong> time differ (χ 2 P < 0.05).<br />
cattle had a 2.5% numerically greater DMI compared<br />
with the c<strong>on</strong>trol cattle (Table 3). However, over the<br />
entire feeding period, AM-sprinkled cattle tended to<br />
have greater (P = 0.06) G:F than PM-sprinkled cattle.<br />
Water intake tended to be lower (P = 0.08) in CON<br />
compared with AM- and PM-sprinkled steers from d 0<br />
to 34. An 8% decrease (P < 0.05) in water intake was<br />
observed in PM steers compared with AM steers from<br />
d 0 to 34. When water intakes were corrected for ME<br />
intake, AM steers tended (P = 0.10) to c<strong>on</strong>sume more<br />
water per unit <str<strong>on</strong>g>of</str<strong>on</strong>g> ME intake than PM steers, but <strong>on</strong>ly<br />
in the early (d 0 to 34) porti<strong>on</strong> <str<strong>on</strong>g>of</str<strong>on</strong>g> the experiment.<br />
Bunk scores in Exp. 2 were obtained during an HS<br />
(THI between 74 and 77) period (Table 4). Differences<br />
in bunk scores were found <strong>on</strong>ly at 2100. At this time,<br />
100% <str<strong>on</strong>g>of</str<strong>on</strong>g> PM pens and 87.5% <str<strong>on</strong>g>of</str<strong>on</strong>g> AM pens were assigned<br />
a bunk score <str<strong>on</strong>g>of</str<strong>on</strong>g> 0, whereas <strong>on</strong>ly 50% <str<strong>on</strong>g>of</str<strong>on</strong>g> CON pens were<br />
assigned a 0 (P < 0.05) indicating that sprinkling during<br />
HS days likely enhanced DMI during the day.<br />
Experiment 3<br />
Body weights, efficiency <str<strong>on</strong>g>of</str<strong>on</strong>g> feed c<strong>on</strong>versi<strong>on</strong>, and DMI<br />
for all periods did not differ am<strong>on</strong>g treatments (Table
3082<br />
Mader and Davis<br />
Table 3. <str<strong>on</strong>g>Effect</str<strong>on</strong>g> <str<strong>on</strong>g>of</str<strong>on</strong>g> morning and evening wetting <str<strong>on</strong>g>of</str<strong>on</strong>g> <strong>feedlot</strong> pen surfaces <strong>on</strong> feed and water<br />
intake <str<strong>on</strong>g>of</str<strong>on</strong>g> yearling steers in Exp. 2<br />
Treatments a<br />
C<strong>on</strong>trast P-values b<br />
CON vs.<br />
Item CON AM PM SEM AM & PM AM vs. PM<br />
BW, kg<br />
Initial (d 0) 477 476 477 1.1 0.26 0.42<br />
Interim (d 34) 532 533 530 3.1 1.00 0.53<br />
Final (d 82) 632 639 628 4.9 0.75 0.16<br />
DMI, kg/d<br />
d 0 to 34 9.85 10.13 10.02 0.16 0.30 0.65<br />
d 35 to 82 11.23 11.52 11.54 0.20 0.26 0.97<br />
d 0 to 82 10.79 11.08 11.04 0.17 0.25 0.89<br />
G:F<br />
d 0 to 34 0.162 0.167 0.157 0.008 1.0 0.42<br />
d 35 to 82 0.188 0.190 0.178 0.004 0.47 0.07<br />
d 0 to 82 0.175 0.180 0.168 0.004 0.80 0.06<br />
Water intake, L/d<br />
d 0 to 34 37.63 38.29 35.29 0.21 0.08 0.01<br />
d 35 to 82 38.01 37.70 40.11 1.89 0.72 0.43<br />
d 0 to 82 38.32 38.42 38.59 1.12 0.90 0.92<br />
Water intake, L/Mcal <str<strong>on</strong>g>of</str<strong>on</strong>g> ME intake<br />
d 0 to 34 1.22 1.21 1.13 0.02 0.16 0.10<br />
d 35 to 82 1.09 1.05 1.11 0.07 0.94 0.54<br />
d 0 to 82 1.14 1.11 1.12 0.05 0.71 0.89<br />
a CON = no water applicati<strong>on</strong>; AM = water applied to pen surface between 1000 and 1200; PM = water<br />
applied to pen surface between 1400 and 1600.<br />
b Single-df orthog<strong>on</strong>al c<strong>on</strong>trasts.<br />
5); however, from d 22 to 83 (0.1715 vs. 0.1800) and d<br />
57 to 83 (0.1480 vs. 0.1695), sprinkling numerically (P =<br />
0.09) enhanced efficiency <str<strong>on</strong>g>of</str<strong>on</strong>g> feed c<strong>on</strong>versi<strong>on</strong>. Also, there<br />
was a feeding time × sprinkling interacti<strong>on</strong> for water<br />
intake from d 22 to 56, with AMF/DRY steers having<br />
greater (P < 0.05) water intake than the other treatments.<br />
Also, PMF/WET steers c<strong>on</strong>sumed 5% less (P<br />
< 0.05) water than AMF/WET steers, with PMF/DRY<br />
steers being intermediate. Water intakes during the<br />
final phase <str<strong>on</strong>g>of</str<strong>on</strong>g> the trial (d 57 to 83) c<strong>on</strong>tinued to display<br />
a feeding time × sprinkling interacti<strong>on</strong> (P < 0.05), with<br />
AMF/DRY steers averaging approximately 13% greater<br />
water intake than the other treatments. During the<br />
entire experimental period, AMF/DRY steers had<br />
greater (P < 0.05) water intake than all other treatments.<br />
When water intake was adjusted for ME intake,<br />
differences between treatments were <strong>on</strong>ly detected during<br />
d 57 to 83. Water intake per unit <str<strong>on</strong>g>of</str<strong>on</strong>g> ME intake was<br />
11% greater (P < 0.05) for AMF/DRY steers than all<br />
others. Because drinking water will provide cooling to<br />
the animal, greater water intakes would be expected<br />
for the AMF/DRY group.<br />
Bunk scores <str<strong>on</strong>g>of</str<strong>on</strong>g> steers in Exp. 3 for TNL, MHS, and<br />
SHS envir<strong>on</strong>mental c<strong>on</strong>diti<strong>on</strong>s are shown in Table 6.<br />
For equal comparis<strong>on</strong>, bunk scores were compared for<br />
the effect <str<strong>on</strong>g>of</str<strong>on</strong>g> sprinkling <strong>on</strong> the different feeding <str<strong>on</strong>g>strategies</str<strong>on</strong>g><br />
independently. Bunk scores <str<strong>on</strong>g>of</str<strong>on</strong>g> AMF and PMF<br />
steers were designed to differ at least for part <str<strong>on</strong>g>of</str<strong>on</strong>g> the day.<br />
Under TNL, sprinklers did not operate. There was<br />
no difference in bunk scores <str<strong>on</strong>g>of</str<strong>on</strong>g> AMF steers with respect<br />
to sprinkling at any observati<strong>on</strong> (P > 0.20); however,<br />
steers fed in the afterno<strong>on</strong> without access to sprinklers<br />
(PMF/DRY) had a larger percentage (P < 0.001) <str<strong>on</strong>g>of</str<strong>on</strong>g> bunks<br />
receiving a score <str<strong>on</strong>g>of</str<strong>on</strong>g> 0 and 1 at 1700 than did PMF/WET<br />
steers, although no differences in bunk scores were observed<br />
at 2000.<br />
Bunk scores during MHS differed at 1400 for steers<br />
fed in the morning and at 2000 for steers fed in the<br />
afterno<strong>on</strong>, with sprinkled AMF cattle having fewer<br />
scores <str<strong>on</strong>g>of</str<strong>on</strong>g> 2 at 1400, and no scores <str<strong>on</strong>g>of</str<strong>on</strong>g> 1 or 2 at 2000<br />
for PMF-treated cattle, indicating that sprinkling was<br />
effective in stimulating DMI under those c<strong>on</strong>diti<strong>on</strong>s.<br />
For all treatment groups, the majority, if not all, <str<strong>on</strong>g>of</str<strong>on</strong>g> the<br />
feed was c<strong>on</strong>sumed by 2000. Under SHS, sprinkling<br />
steers did not alter bunk scores. When compared with<br />
TNL and MHS c<strong>on</strong>diti<strong>on</strong>s, a greater quantity <str<strong>on</strong>g>of</str<strong>on</strong>g> feed<br />
remained at 2000 for all treatments. The AMF/WET<br />
and PMF/WET cattle had numerically (8.33%) more<br />
bunk scores at 0, but under these c<strong>on</strong>diti<strong>on</strong>s, all cattle<br />
were apparently too uncomfortable to eat.<br />
Carcass Traits. Carcass characteristics are presented<br />
in Table 7. In Exp. 1, feeding regimen had no effect <strong>on</strong><br />
carcass weight, dressing percent, or 12th-rib fat. Steers<br />
<strong>on</strong> the BKMGT treatment had numerically (P = 0.17)<br />
greater marbling scores than the other treatment<br />
groups. In Exp. 2, marbling scores <str<strong>on</strong>g>of</str<strong>on</strong>g> PM steers tended<br />
(P = 0.06) to be higher than AM. All other carcass characteristics<br />
were similar. In Exp. 3, steers did not differ<br />
(P > 0.10) in hot carcass weight or dressing percent<br />
(348.0 ± 2.0 kg and 61.7 ± 0.4%, respectively). Fat thickness<br />
likewise was not affected by treatment (P > 0.10).<br />
A feeding time × sprinkling interacti<strong>on</strong> (P < 0.05) was
Table 4. <str<strong>on</strong>g>Effect</str<strong>on</strong>g> <str<strong>on</strong>g>of</str<strong>on</strong>g> morning (AM) vs. afterno<strong>on</strong> (PM)<br />
mound wetting <strong>on</strong> bunk scores <str<strong>on</strong>g>of</str<strong>on</strong>g> steers throughout the<br />
day during <strong>heat</strong> <strong>stress</strong> c<strong>on</strong>diti<strong>on</strong>s (mean daily temperature-humidity<br />
index between 74 and 77) <strong>on</strong> d 14 and 15<br />
<str<strong>on</strong>g>of</str<strong>on</strong>g> Exp. 2<br />
Treatments a<br />
Item b CON AM PM P-value<br />
0900<br />
Bunk score 1.0<br />
0 0.00 0.00 0.00<br />
1 0.00 0.00 0.00<br />
2 100.00 100.00 100.00<br />
1300<br />
Bunk score 0.59<br />
0 0.00 0.00 0.00<br />
1 62.50 50.00 75.00<br />
2 37.50 50.00 25.00<br />
1700<br />
Bunk score 0.14<br />
0 25.00 0.00 0.00<br />
1 62.50 100.00 100.00<br />
2 12.50 0.00 0.00<br />
2100<br />
Bunk score 0.04<br />
0 50.00 87.50 100.00<br />
1 50.00 12.50 0.00<br />
2 0.00 0.00 0.00<br />
a CON = no water applicati<strong>on</strong>; AM = water applied to pen surface<br />
between 1000 and 1200; PM = water applied to pen surface between<br />
1400 and 1600. Values in the table represent the average percentage<br />
<str<strong>on</strong>g>of</str<strong>on</strong>g> pens within each treatment that had respective bunk scores.<br />
b Bunk scores <str<strong>on</strong>g>of</str<strong>on</strong>g> the pens were determined based <strong>on</strong> visual observati<strong>on</strong><br />
at 0900, 1300, 1700, and 2100 using the following criteria: 0 =<br />
50% <str<strong>on</strong>g>of</str<strong>on</strong>g> the delivered feed remaining.<br />
found for marbling score with AMF/DRY steers having<br />
greater marbling scores than the other treatments.<br />
Discussi<strong>on</strong><br />
In Exp. 2, 23 out <str<strong>on</strong>g>of</str<strong>on</strong>g> 82 d sprinklers were turned <strong>on</strong><br />
when maximal THI was predicted to equal or exceed 77.<br />
Based <strong>on</strong> outcomes <str<strong>on</strong>g>of</str<strong>on</strong>g> Exp. 2, an automated sprinkling<br />
regimen was implemented in Exp. 3. During Exp. 3,<br />
sprinklers operated <strong>on</strong> 31 <str<strong>on</strong>g>of</str<strong>on</strong>g> 61 d during the 22 to 83<br />
d treatment period. In additi<strong>on</strong>, during Exp. 3, 90% <str<strong>on</strong>g>of</str<strong>on</strong>g><br />
the days (28 <str<strong>on</strong>g>of</str<strong>on</strong>g> 31) that sprinklers were operati<strong>on</strong>al,<br />
maximal THI was greater than or equal to 77. However,<br />
THI exceeded 77 <strong>on</strong> 7 <str<strong>on</strong>g>of</str<strong>on</strong>g> the 30 n<strong>on</strong>sprinkling days <str<strong>on</strong>g>of</str<strong>on</strong>g><br />
the treatment period. These data suggest that a THI<br />
<str<strong>on</strong>g>of</str<strong>on</strong>g> 68 or greater at 0900 will predict a daily maximal<br />
THI <str<strong>on</strong>g>of</str<strong>on</strong>g> 77 or greater 90% <str<strong>on</strong>g>of</str<strong>on</strong>g> the time; however, about<br />
25% <str<strong>on</strong>g>of</str<strong>on</strong>g> the time, when THI at 0900 is less than 68, a<br />
maximal THI <str<strong>on</strong>g>of</str<strong>on</strong>g> 77 is reached. The latter c<strong>on</strong>diti<strong>on</strong> may<br />
not be as great a c<strong>on</strong>cern as those c<strong>on</strong>diti<strong>on</strong>s in which<br />
THI at 0900 is greater than 68. A lower THI (
3084<br />
Mader and Davis<br />
Table 5. <str<strong>on</strong>g>Effect</str<strong>on</strong>g> <str<strong>on</strong>g>of</str<strong>on</strong>g> altered feeding time and sprinkling <strong>on</strong> <strong>feedlot</strong> performance <str<strong>on</strong>g>of</str<strong>on</strong>g> yearling<br />
steers in Exp. 3<br />
Treatments a<br />
Item AMF/DRY AMF/WET PMF/DRY PMF/WET SEM<br />
BW, kg<br />
Initial (d 0) 425 424 423 425 1.0<br />
d 21 460 458 458 459 1.0<br />
d 56 524 521 519 522 2.8<br />
Final (d 83)<br />
DMI, kg/d<br />
562 567 561 566 4.0<br />
d 0 to 21 9.17 9.09 9.02 9.52 0.18<br />
d 22 to 56 9.61 9.42 9.37 9.61 0.23<br />
d 57 to 83 9.80 9.61 9.67 9.74 0.20<br />
d 22 to 83<br />
G:F<br />
9.70 9.50 9.50 9.67 0.21<br />
d 0 to 21 0.179 0.182 0.182 0.175 0.004<br />
d 22 to 56 0.183 0.184 0.181 0.180 0.004<br />
d57to83 b<br />
0.144 0.172 0.152 0.167 0.012<br />
d22to83 b<br />
Water intake, L/d<br />
0.170 0.183 0.173 0.177 0.005<br />
d 0 to 21 26.95 26.99 25.52 25.11 2.8<br />
d22to56c 38.79f 36.17e 35.31de 34.47d 0.40<br />
d57to83c 36.85e 32.26d 32.16d 33.73d 0.90<br />
d22to83 c<br />
37.93 e<br />
34.39 d<br />
33.91 d<br />
34.14 d<br />
Water intake, L/Mcal <str<strong>on</strong>g>of</str<strong>on</strong>g> ME intake<br />
0.40<br />
d 0 to 21 0.96 0.94 0.92 0.87 0.12<br />
d 22 to 56 1.33 1.26 1.24 1.18 0.05<br />
d57to83c 1.22e 1.08d 1.10d 1.12d 0.03<br />
d 22 to 83 1.28 1.18 1.17 1.15 0.04<br />
a Treatments were imposed from d 22 to the end <str<strong>on</strong>g>of</str<strong>on</strong>g> the study and c<strong>on</strong>sisted <str<strong>on</strong>g>of</str<strong>on</strong>g> altered feeding time (0800<br />
[AMF] vs. 1400 [PMF]) with (WET) and without (DRY) sprinkling. Sprinkling was accomplished via overhead<br />
sprinklers that operated 20 min/1.5 h from 1000 to 1750 <strong>on</strong> days when temperature-humidity index at 1900<br />
was ≥68. Cattle were not sprinkled during the therm<strong>on</strong>eutral period.<br />
b Sprinkling (WET) tended to differ from no sprinkling (DRY) treatments (0.05 < P < 0.10).<br />
c Feeding time × sprinkling interacti<strong>on</strong> (P < 0.05).<br />
d,e,f Means within a row that do not have comm<strong>on</strong> superscripts differ (P < 0.05).<br />
r<strong>on</strong>mental temperatures because evaporative <strong>heat</strong><br />
transfer does not depend <strong>on</strong> the thermal gradient between<br />
the animal and its envir<strong>on</strong>ment (Arkin et al.,<br />
1991).<br />
Morris<strong>on</strong> et al. (1973) c<strong>on</strong>ducted two trials comparing<br />
the performance <str<strong>on</strong>g>of</str<strong>on</strong>g> cattle that were sprinkled with those<br />
raised in climate-c<strong>on</strong>trolled c<strong>on</strong>finement and a third<br />
c<strong>on</strong>trol treatment. The sprinkling system operated for<br />
1 min every 30 min when ambient temperature was<br />
above 27°C. Sprinkling increased DMI 17% over c<strong>on</strong>trol<br />
and increased ADG between 20 and 28%. Morris<strong>on</strong> et<br />
al. (1981) also c<strong>on</strong>ducted three experiments comparing<br />
sprinkler activati<strong>on</strong> times <str<strong>on</strong>g>of</str<strong>on</strong>g> 22 and 32°C. Lower activati<strong>on</strong><br />
temperature significantly increased DMI by 5%<br />
and increased gains in <strong>on</strong>e <str<strong>on</strong>g>of</str<strong>on</strong>g> the experiments by 7%.<br />
These results support our findings <str<strong>on</strong>g>of</str<strong>on</strong>g> improved performance<br />
<str<strong>on</strong>g>of</str<strong>on</strong>g> Exp. 2 steers receiving the morning sprinkling<br />
regimen relative to those sprinkled in the afterno<strong>on</strong>,<br />
and suggests sprinkling must be initiated before periods<br />
<str<strong>on</strong>g>of</str<strong>on</strong>g> the day when ambient temperatures are near<br />
maximum. Additi<strong>on</strong>ally, it is apparent from the results<br />
<str<strong>on</strong>g>of</str<strong>on</strong>g> Exp. 3, in which cattle were sprinkled for 20 min<br />
every 1.5 h, that intermittent sprinkling throughout<br />
the day is needed to improve animal performance (efficiency<br />
tended to be improved (P = 0.09) by sprinkling).<br />
The primary benefit <str<strong>on</strong>g>of</str<strong>on</strong>g> cooling cattle would be to decrease<br />
panting and the expenditure <str<strong>on</strong>g>of</str<strong>on</strong>g> energy (up to<br />
18% increase) associated with panting (NRC, 1996). In<br />
additi<strong>on</strong>, less variati<strong>on</strong> in daily DMI would be expected<br />
when cattle are kept cool <strong>on</strong> hot days. Garner et al.<br />
(1989) compared gains <str<strong>on</strong>g>of</str<strong>on</strong>g> steers and heifers subjected<br />
to c<strong>on</strong>trol or sprinkling treatments and observed that<br />
sprinkled heifers gained 20% faster than their unsprinkled<br />
counterparts, whereas sprinkled and unsprinkled<br />
steers performed similarly. The authors and others attributed<br />
this difference to the fact that the heifers were<br />
fatter than the steers and therefore more susceptible<br />
to <strong>heat</strong> <strong>stress</strong> (Mader et al., 2001; Busby and Loy, 1996).<br />
Altering the microclimate <str<strong>on</strong>g>of</str<strong>on</strong>g> the sprinkled area is a<br />
major benefit to improving the well being <str<strong>on</strong>g>of</str<strong>on</strong>g> <strong>feedlot</strong><br />
cattle under extreme envir<strong>on</strong>mental c<strong>on</strong>diti<strong>on</strong>s by <strong>reducing</strong><br />
body temperature (Davis et al., 2003). Ground<br />
temperatures have been shown to be decreased over<br />
15°C when sprinkled <strong>feedlot</strong> surfaces were compared<br />
with unsprinkled surfaces (Wiersma et al., 1973). When<br />
ground temperature exceeds skin temperature, <strong>heat</strong><br />
will flow from the ground to the animal, increasing the<br />
<strong>heat</strong> load to be dissipated. By cooling the ground with<br />
sprinkled water, this gradient <str<strong>on</strong>g>of</str<strong>on</strong>g> <strong>heat</strong> flow is reversed,<br />
allowing for better <strong>heat</strong> balance.
Table 6. <str<strong>on</strong>g>Effect</str<strong>on</strong>g> <str<strong>on</strong>g>of</str<strong>on</strong>g> altered feeding time and sprinkling <strong>on</strong><br />
bunk scores <str<strong>on</strong>g>of</str<strong>on</strong>g> steers fed under therm<strong>on</strong>eutral (TNL),<br />
mild <strong>heat</strong> <strong>stress</strong> (MHS), and severe <strong>heat</strong> <strong>stress</strong> (SHS) c<strong>on</strong>diti<strong>on</strong>s<br />
<str<strong>on</strong>g>of</str<strong>on</strong>g> Exp. 3 a<br />
AMF PMF<br />
Item b DRY WET P-value DRY WET P-value<br />
TNL (mean THI < 70)<br />
1400<br />
Bunk score 0.67 1.0<br />
0 0.00 0.00 100.00 100.00<br />
1 41.67 33.33 0.00 0.00<br />
2<br />
1700<br />
53.33 66.67 0.00 0.00<br />
Bunk score 0.46 0.01<br />
0 16.67 16.67 16.67 0.00<br />
1 66.67 75.00 58.33 33.33<br />
2<br />
2000<br />
16.67 8.33 25.00 66.67<br />
Bunk score 0.22 0.23<br />
0 66.67 41.67 50.00 33.33<br />
1 33.33 58.33 41.67 58.33<br />
2 0.00 0.00 8.33 8.33<br />
MHS (70 < mean THI < 74)<br />
1400<br />
Bunk score 0.03 1.0<br />
0 25.00 16.67 100.00 100.00<br />
1 50.00 75.00 0.00 0.00<br />
2<br />
1700<br />
25.00 8.33 0.00 0.00<br />
Bunk score 0.70 0.10<br />
0 50.00 41.67 16.67 16.67<br />
1 41.67 50.00 0.00 25.00<br />
2<br />
2000<br />
8.33 8.33 83.33 58.33<br />
Bunk score 1.0 0.01<br />
0 100.00 100.00 41.67 100.00<br />
1 0.00 0.00 58.33 0.00<br />
2 0.00 0.00 0.00 0.00<br />
SHS (mean THI > 77)<br />
1400<br />
Bunk score 0.55 1.0<br />
0 0.00 0.00 100.00 100.00<br />
1 16.67 25.00 0.00 0.00<br />
2<br />
1700<br />
83.33 75.00 0.00 0.00<br />
Bunk score 0.21 0.12<br />
0 0.00 0.00 0.00 0.00<br />
1 25.00 50.00 16.67 8.33<br />
2<br />
2000<br />
75.00 50.00 83.33 91.67<br />
Bunk score 0.46 0.69<br />
0 0.00 8.33 8.33 16.67<br />
1 91.67 75.00 75.00 58.33<br />
2 8.33 16.67 16.67 25.00<br />
a Treatments were imposed from d 22 to the end <str<strong>on</strong>g>of</str<strong>on</strong>g> the study and<br />
c<strong>on</strong>sisted <str<strong>on</strong>g>of</str<strong>on</strong>g> altered feeding time (0800 [AMF] vs. 1400 [PMF]) with<br />
(WET) and without (DRY) sprinkling. Sprinkling was accomplished<br />
via overhead sprinklers that operated 20 min/1.5 h from 1000 to 1750<br />
<strong>on</strong> days when temperature-humidity index at 0900 ≥ 68. Cattle were<br />
not sprinkled during TNL period.<br />
b Bunk scores <str<strong>on</strong>g>of</str<strong>on</strong>g> the pens were determined based <strong>on</strong> visual observati<strong>on</strong><br />
at selected times using the following criteria: 0 = 50% <str<strong>on</strong>g>of</str<strong>on</strong>g> the delivered feed remaining. Values<br />
in the table represent the average percentage <str<strong>on</strong>g>of</str<strong>on</strong>g> pens within each<br />
treatment that had respective bunk scores.<br />
Reducing <strong>heat</strong> <strong>stress</strong> <str<strong>on</strong>g>of</str<strong>on</strong>g> <strong>feedlot</strong> cattle 3085<br />
Table 7. <str<strong>on</strong>g>Effect</str<strong>on</strong>g> <str<strong>on</strong>g>of</str<strong>on</strong>g> managed feeding and/or sprinkling <strong>on</strong><br />
<strong>feedlot</strong> cattle carcass characteristics<br />
Treatment a<br />
HCW, kg b<br />
Carcass characteristics<br />
12th-rib Marbling<br />
Dress, % fat, cm score c<br />
Feeding regimen, Exp. 1<br />
ADLIB 362.4 64.9 1.06 507.7<br />
BKMGT 361.0 64.5 1.02 524.1<br />
LIMFD 361.3 64.3 1.00 501.0<br />
SEM 2.6 0.3 0.05 10.0<br />
Morning or evening pen surface wetting, Exp. 2<br />
CON 395 65.2 1.39 558.4<br />
AM 396 64.6 1.21 538.8 d<br />
PM 388 64.5 1.24 571.5 d<br />
SEM 3.9 0.3 0.08 10.6<br />
Altered feeding time and sprinkling, Exp. 3<br />
AMF/DRY 349.8 62.1 1.01 550.6 f<br />
AMF/WET 348.7 61.6 1.19 519.3 e<br />
PMF/DRY 347.8 61.9 1.09 505.5 e<br />
PMF/WET 345.6 61.3 1.13 519.6 e<br />
SEM 2.0 0.4 0.09 10.5<br />
a ADLIB = cattle were allowed access to feed at all times; BKMGT =<br />
cattle were fed at 1600 with bunks slick at 0800 the following day;<br />
LIMFD = cattle were delivered 85% <str<strong>on</strong>g>of</str<strong>on</strong>g> their predicted DMI at 1600;<br />
CON = c<strong>on</strong>trol; AM = water applied to pen surface between 1000 and<br />
1200; PM = water applied to pen surface between 1400 and 1600;<br />
AMF = ad libitum amount <str<strong>on</strong>g>of</str<strong>on</strong>g> feed delivered at 0800 h; PMF = ad<br />
libitum amount <str<strong>on</strong>g>of</str<strong>on</strong>g> feed delivered at 1400 with bunks empty at 0800<br />
h; DRY = no water sprinkling; WET = water applied to pen surface<br />
when temperature humidity-index was ≥68 at 0900.<br />
b Hot carcass weight.<br />
c Small 0 = 500; modest 0 = 600.<br />
d AM vs. PM tended to differ (P < 0.06).<br />
e,f Feeding time × sprinkling interacti<strong>on</strong> (P < 0.05). Means in a<br />
column within an experiment that do not have comm<strong>on</strong> superscripts<br />
differ (P < 0.05).<br />
Kelly et al. (1964) examined the benefit <str<strong>on</strong>g>of</str<strong>on</strong>g> cooled slab<br />
floors <strong>on</strong> growing pig performance. In the sec<strong>on</strong>d year<br />
<str<strong>on</strong>g>of</str<strong>on</strong>g> the 2-yr study, pigs with access to the cooled slab<br />
floor gained 17.5% faster and 9% more efficiently than<br />
did c<strong>on</strong>trol pigs. Creating a cool surface for <strong>feedlot</strong> cattle<br />
via a sprinkled pen surface is a plausible opti<strong>on</strong>. Additi<strong>on</strong>ally,<br />
c<strong>on</strong>ductivity <str<strong>on</strong>g>of</str<strong>on</strong>g> the soil is improved by wetting.<br />
In dry soils, thermal c<strong>on</strong>ductivity is about 0.25 W/m 2<br />
(Campbell et al., 1994). Because <str<strong>on</strong>g>of</str<strong>on</strong>g> this low value, the<br />
ability <str<strong>on</strong>g>of</str<strong>on</strong>g> the animal to dissipate <strong>heat</strong> to the soil is poor.<br />
Wetting the soil can improve its c<strong>on</strong>ductivity fivefold<br />
(Sepaskhah and Boersma, 1979; Campbell et al., 1994).<br />
Therefore, applicati<strong>on</strong> <str<strong>on</strong>g>of</str<strong>on</strong>g> water to the ground can<br />
greatly enhance <strong>heat</strong> transfer from the animal.<br />
Another aspect <str<strong>on</strong>g>of</str<strong>on</strong>g> managed feeding and sprinkling<br />
programs were the noted reducti<strong>on</strong>s in water requirements<br />
and demands by the animal when compared with<br />
traditi<strong>on</strong>al feeding programs. Although the reducti<strong>on</strong>s<br />
ranged from n<strong>on</strong>significant in Exp. 2 to significant in<br />
Exp. 1 and 3, any <str<strong>on</strong>g>management</str<strong>on</strong>g> <str<strong>on</strong>g>strategies</str<strong>on</strong>g> which reduce<br />
demand for water would be useful, particularly at times<br />
when water demands are large and in regi<strong>on</strong>s where<br />
water is limited and/or becoming more costly. In general,<br />
water intakes were approximately 20 to 30% lower<br />
than those reported in NRC (1996) for cattle finished<br />
under comparable ambient temperatures. A large vari-
3086<br />
ati<strong>on</strong> in water intake by animals is noteworthy. In the<br />
experiments reported herein, as in many experiments,<br />
water usage was measured rather than actual water<br />
intake. For c<strong>on</strong>trol cattle used in these experiments,<br />
water intake per unit <str<strong>on</strong>g>of</str<strong>on</strong>g> DMI ranged from 0.96 to 1.33<br />
L/kg.<br />
Alterati<strong>on</strong>s in eating pattern, as represented by bunk<br />
scores, were found in Exp. 1 during the 23-d managed<br />
feeding period as a result <str<strong>on</strong>g>of</str<strong>on</strong>g> limit feeding and restricted<br />
access to feed. Representati<strong>on</strong> <str<strong>on</strong>g>of</str<strong>on</strong>g> bunk scores within a<br />
treatment across envir<strong>on</strong>mental periods is useful in<br />
evaluating adaptive adjustments made by the steers as<br />
an effect <str<strong>on</strong>g>of</str<strong>on</strong>g> both treatment and envir<strong>on</strong>mental c<strong>on</strong>diti<strong>on</strong>s.<br />
Comparis<strong>on</strong>s across treatments results in limited<br />
interpretati<strong>on</strong> due to differences in bunk scores as a<br />
result <str<strong>on</strong>g>of</str<strong>on</strong>g> the imposed treatment.<br />
One behavioral adaptive change cattle undergo during<br />
<strong>heat</strong> <strong>stress</strong> is an alterati<strong>on</strong> in eating behavior such<br />
that a larger porti<strong>on</strong> <str<strong>on</strong>g>of</str<strong>on</strong>g> their intake is c<strong>on</strong>sumed during<br />
the late afterno<strong>on</strong> and early evening period (Cowan,<br />
1975; M<strong>on</strong>ty and Garbareno, 1978). The lower scores<br />
<str<strong>on</strong>g>of</str<strong>on</strong>g> the ADLIB treatment group for the MHS period in<br />
Exp. 1 suggest acclimatizati<strong>on</strong> was occurring by the<br />
cattle; however, the greater scores in HS2 indicate that<br />
under more severe <strong>heat</strong>, lowering DMI was used as a<br />
coping mechanism. For ADLIB steers (Figure 1), 50%<br />
<str<strong>on</strong>g>of</str<strong>on</strong>g> the pens were assigned a bunk score <str<strong>on</strong>g>of</str<strong>on</strong>g> 1 (10 to 50%<br />
<str<strong>on</strong>g>of</str<strong>on</strong>g> feed delivered remaining) during HS2 (d 21 to 22)<br />
compared with n<strong>on</strong>e during the other three periods at<br />
2100. Although mean (76 vs. 77) and maximal (82 vs. 83)<br />
THI were slightly lower during HS2 than HS1, minimal<br />
THI was slightly higher (69 vs. 67) for HS2. Hahn and<br />
Mader (1997) c<strong>on</strong>cluded that adequate nighttime recovery<br />
(THI ≤ 74) was needed to reduce death in vulnerable<br />
<strong>feedlot</strong> animals. Whereas THI during the night in Exp.<br />
1 was well below this threshold, these data support the<br />
c<strong>on</strong>cept that nighttime envir<strong>on</strong>mental c<strong>on</strong>diti<strong>on</strong>s play<br />
a key role in the <str<strong>on</strong>g>management</str<strong>on</strong>g> <str<strong>on</strong>g>of</str<strong>on</strong>g> <strong>heat</strong> <strong>stress</strong>.<br />
Steers in BKMGT treatment group showed no difference<br />
in bunk scores over the varying envir<strong>on</strong>mental<br />
periods, suggesting their intake patterns remained very<br />
c<strong>on</strong>sistent despite the changing envir<strong>on</strong>mental c<strong>on</strong>diti<strong>on</strong>s.<br />
A c<strong>on</strong>sistent feed intake pattern improves animal<br />
producti<strong>on</strong> (Soto-Navarro et al., 2000) by allowing for<br />
more efficient nutrient use (Zinn, 1994; Soto-Navarro<br />
et al., 2000). Steers <strong>on</strong> LIMFD during Exp. 1 altered<br />
their feeding pattern; however, results suggest that this<br />
alterati<strong>on</strong> seemed to be more <str<strong>on</strong>g>of</str<strong>on</strong>g> an effect <str<strong>on</strong>g>of</str<strong>on</strong>g> days <strong>on</strong><br />
feed than envir<strong>on</strong>mental c<strong>on</strong>diti<strong>on</strong>s. As days <strong>on</strong> the<br />
LIMFD regimen increased, steers became aggressive<br />
meal eaters regardless <str<strong>on</strong>g>of</str<strong>on</strong>g> envir<strong>on</strong>mental c<strong>on</strong>diti<strong>on</strong>s.<br />
One hour after feed delivery, during HS2, LIMFD steers<br />
had c<strong>on</strong>sumed the majority <str<strong>on</strong>g>of</str<strong>on</strong>g> their feed. Soto-Navarro<br />
et al. (2000) reported steers fed 90% <str<strong>on</strong>g>of</str<strong>on</strong>g> ad libitum intake<br />
twice daily c<strong>on</strong>sumed all feed <str<strong>on</strong>g>of</str<strong>on</strong>g>fered within 1 to 2 h. The<br />
fact that LIMFD steers in the current study remained<br />
aggressive in their eating pattern in spite <str<strong>on</strong>g>of</str<strong>on</strong>g> warmer<br />
envir<strong>on</strong>mental c<strong>on</strong>diti<strong>on</strong>s may have been due to their<br />
lower body temperature (Davis et al., 2003).<br />
Mader and Davis<br />
Sprinkling did not have a large effect <strong>on</strong> bunk scores<br />
<str<strong>on</strong>g>of</str<strong>on</strong>g> steers when it was the <strong>on</strong>ly <strong>heat</strong> <strong>stress</strong> relief method<br />
employed (Exp. 2 and 3). Under mild <strong>heat</strong> <strong>stress</strong>, differences<br />
between sprinkling treatments were noted; however,<br />
under severe <strong>heat</strong> <strong>stress</strong>, sprinkling did not alter<br />
feeding pattern. This is likely due to the cattle staying<br />
close to the sprinkled areas and not going to bunks<br />
to feed.<br />
Treatment differences were noted in marbling scores<br />
in two <str<strong>on</strong>g>of</str<strong>on</strong>g> the three experiments. These differences may<br />
be related to alterati<strong>on</strong>s in horm<strong>on</strong>al pr<str<strong>on</strong>g>of</str<strong>on</strong>g>iles caused by<br />
varying degrees <str<strong>on</strong>g>of</str<strong>on</strong>g> <strong>heat</strong> <strong>stress</strong> experienced by each <str<strong>on</strong>g>of</str<strong>on</strong>g><br />
the treatment groups. In the experiments, cattle exposed<br />
to greater <strong>heat</strong> <strong>stress</strong> tended to have greater<br />
marbling score.<br />
Kouba et al. (2001) examined the effect <str<strong>on</strong>g>of</str<strong>on</strong>g> prol<strong>on</strong>ged<br />
exposure to envir<strong>on</strong>ments <str<strong>on</strong>g>of</str<strong>on</strong>g> 31 or 20°C <strong>on</strong> fat depositi<strong>on</strong><br />
<str<strong>on</strong>g>of</str<strong>on</strong>g> pigs. Internal fat deposits were increased 2-fold in<br />
pigs reared in 31 vs. 20°C envir<strong>on</strong>ments, whereas backfat<br />
depositi<strong>on</strong> was similar. The difference in the locati<strong>on</strong><br />
<str<strong>on</strong>g>of</str<strong>on</strong>g> fat depositi<strong>on</strong> in resp<strong>on</strong>se to <strong>heat</strong> <strong>stress</strong> is important<br />
because excessive external fat depositi<strong>on</strong> can be detrimental<br />
to <strong>heat</strong> exchange capabilities. Mader et al.<br />
(1997) reported cattle fed during the winter in open<br />
facilities north <str<strong>on</strong>g>of</str<strong>on</strong>g> a windbreak that were subjected to<br />
mild cold <strong>stress</strong>, tended to have increased marbling and<br />
backfat values. However, steers finished in the same<br />
facility in the summer, when the prevailing southerly<br />
wind flow would be restricted, also had higher marbling<br />
compared with cattle finished in facilities where airflow<br />
was not restricted. Adequate airflow in the summer<br />
m<strong>on</strong>ths is needed for optimal animal performance<br />
(Mader et al., 1997), presumably to reduce <strong>heat</strong> <strong>stress</strong>.<br />
It would seem that slight <strong>heat</strong> <strong>stress</strong> might cause increased<br />
im. fat depositi<strong>on</strong>.<br />
Implicati<strong>on</strong>s<br />
Altering feeding time, feed amount, and water sprinkling<br />
are opti<strong>on</strong>s to decrease steers’ susceptibility to<br />
<strong>heat</strong> <strong>stress</strong>. Although enhanced productivity may be<br />
realized by using sprinklers in intensive beef cattle producti<strong>on</strong><br />
systems, producti<strong>on</strong> resp<strong>on</strong>ses to altered feeding<br />
regimens are not always obtained. However, preventing<br />
peaks in metabolic <strong>heat</strong> load from occurring<br />
during peaks in climatic <strong>heat</strong> load can be accomplished<br />
by altering feeding regimen, thereby minimizing animal<br />
discomfort during summertime <strong>heat</strong> episodes. Alterati<strong>on</strong>s<br />
in feeding regimen increase animal well being<br />
without adversely affecting performance. An altered<br />
feeding regimen enhances the animal’s ability to cope<br />
with metabolic and climatic <strong>heat</strong> load during the summer,<br />
whereas sprinkling cattle and/or <strong>feedlot</strong> surfaces<br />
serves to decrease overall <strong>heat</strong> load.<br />
Literature Cited<br />
Arkin, H., E. Kimmel, A. Berman, and D. Broday. 1991. Heat transfer<br />
properties <str<strong>on</strong>g>of</str<strong>on</strong>g> dry and wet furs <str<strong>on</strong>g>of</str<strong>on</strong>g> dairy cows. Trans. Am. Soc.<br />
Agric Eng. 34:2550–2558.
Armstr<strong>on</strong>g, D. V. 1994. Heat <strong>stress</strong> interacti<strong>on</strong> with shade and cooling.<br />
J. Dairy Sci. 77:2044–2050.<br />
Baccari, F., Jr., H. D. Johns<strong>on</strong>, and G. L. Hahn. 1983. Envir<strong>on</strong>mental<br />
<strong>heat</strong> effects <strong>on</strong> growth, plasma T 3, and post<strong>heat</strong> compensatory<br />
effects <strong>on</strong> Holstein calves. Proc. Soc. Exp. Biol. Med. 173:312–<br />
318.<br />
Brosh, A., Y. Ahar<strong>on</strong>i, A. A. Degen, D. Wright, and B. Young. 1998.<br />
<str<strong>on</strong>g>Effect</str<strong>on</strong>g>s <str<strong>on</strong>g>of</str<strong>on</strong>g> solar radiati<strong>on</strong>, dietary energy, and time <str<strong>on</strong>g>of</str<strong>on</strong>g> feeding<br />
<strong>on</strong> thermoregulatory resp<strong>on</strong>ses and energy balance in cattle in<br />
a hot envir<strong>on</strong>ment. J. Anim. Sci. 76:2671–2677.<br />
Busby, D., and D. Loy. 1996. Heat <strong>stress</strong> in <strong>feedlot</strong> cattle: Producer<br />
survey results. Pages 108–110 in Beef Res. Rep. AS-632. Iowa<br />
State Univ., Ames.<br />
Campbell, G. S., J. D. Jungbauer, Jr., W. R. Bidlake, and R. D.<br />
Hungerford. 1994. Predicting the effect <str<strong>on</strong>g>of</str<strong>on</strong>g> temperature <strong>on</strong> soil<br />
thermal c<strong>on</strong>ductivity. Soil Sci. 158:307–313.<br />
Carstens, G. E., D. E. Johns<strong>on</strong>, M. A. Elenberger, and J. D. Tatum.<br />
1991. Physical and chemical comp<strong>on</strong>ents <str<strong>on</strong>g>of</str<strong>on</strong>g> the empty body during<br />
compensatory growth in beef steers. J. Anim. Sci.<br />
69:3251–3264.<br />
Carstens, G. E., D. E. Johns<strong>on</strong>, and M. A. Ellenberger. 1989. Energy<br />
metabolism and compositi<strong>on</strong> <str<strong>on</strong>g>of</str<strong>on</strong>g> gain in beef steers exhibiting<br />
normal and compensatory growth. Energy Metabolism <str<strong>on</strong>g>of</str<strong>on</strong>g> Farm<br />
Animals. Eur. Assoc. Anim. Prod. Publ. No. 43:131.<br />
Chen, K. H., J. T. Huber, C. B. Theurer, D. V. Armstr<strong>on</strong>g, R. C.<br />
Wanderley, J. M. Simas, S. C. Chan, and J. L. Sullivan. 1993.<br />
<str<strong>on</strong>g>Effect</str<strong>on</strong>g> <str<strong>on</strong>g>of</str<strong>on</strong>g> protein quality and evaporative cooling <strong>on</strong> lactati<strong>on</strong>al<br />
performance <str<strong>on</strong>g>of</str<strong>on</strong>g> Holstein cows in hot weather. J. Dairy Sci.<br />
76:819–825.<br />
Cowan, R. T. 1975. Grazing time and pattern <str<strong>on</strong>g>of</str<strong>on</strong>g> grazing Fresian cows<br />
<strong>on</strong> tropical grass-legume pasture. Aust. J. Exp. Agric. Anim.<br />
Husb. 15:32–37.<br />
Davis, M. S., T. L. Mader, S. M. Holt, and A. M. Parkhurst. 2003.<br />
Strategies to reduce <strong>feedlot</strong> cattle <strong>heat</strong> <strong>stress</strong>: <str<strong>on</strong>g>Effect</str<strong>on</strong>g>s <strong>on</strong> tympanic<br />
temperature. J. Anim. Sci. 81:649–661.<br />
Fuquay, J. W. 1981. Heat <strong>stress</strong> as it affects animal producti<strong>on</strong>. J.<br />
Anim. Sci. 52:164–174.<br />
Garner, J. C., R. A. Bucklin, W. E. Kunkle, and R. A. Nordstedt.<br />
1989. Sprinkled water and fans to reduce <strong>heat</strong> <strong>stress</strong> <str<strong>on</strong>g>of</str<strong>on</strong>g> beef<br />
cattle. Appl. Eng. Agric. 5:99–101.<br />
Hahn, G. L. 1994. Envir<strong>on</strong>mental requirements <str<strong>on</strong>g>of</str<strong>on</strong>g> farm animals.<br />
Pages 220–235 in Handbook <str<strong>on</strong>g>of</str<strong>on</strong>g> Agricultural Meteorology. J. F.<br />
Griffiths, ed. Oxford Univ. Press, New York.<br />
Hahn, G. L. 1995. Envir<strong>on</strong>mental influences <strong>on</strong> feed intake and performance<br />
<str<strong>on</strong>g>of</str<strong>on</strong>g> <strong>feedlot</strong> cattle. Pages 207–225 in Proc. Intake by<br />
Feedlot Cattle Symp. F. N. Owens, ed. Oklahoma State Univ.,<br />
Stillwater.<br />
Hahn, G. L., and T. L. Mader. 1997. Heat waves and their relati<strong>on</strong><br />
to thermoregulati<strong>on</strong>, feeding behavior and mortality <str<strong>on</strong>g>of</str<strong>on</strong>g> <strong>feedlot</strong><br />
cattle. Pages 563–567 in Proc. 5th Int. Livest. Envir<strong>on</strong>. Symp.<br />
ASAE, St. Joseph, MI.<br />
Hubbard, K. G., D. E. Stooksbury, G. L. Hahn, and T. L. Mader.<br />
1999. A climatological perspective <strong>on</strong> <strong>feedlot</strong> cattle performance<br />
and mortality related to the temperature-humidity index. J.<br />
Prod. Agric. 12:650–653.<br />
Ig<strong>on</strong>o, M. B., B. J. Steevens, M. D. Shanklin, and H. D. Johns<strong>on</strong>.<br />
1985. Spray cooling effects <strong>on</strong> milk producti<strong>on</strong>, milk, and rectal<br />
temperature <str<strong>on</strong>g>of</str<strong>on</strong>g> cows during a moderate temperature summer<br />
seas<strong>on</strong>. J. Dairy Sci. 68:979–985.<br />
Kelly, C. F., T. E. B<strong>on</strong>d, and W. Garrett. 1964. Heat transfer from<br />
swine to a cold slab. Trans. ASAE. 34-37.<br />
Kouba, M., D. Hermier, and J. Le Dividich. 2001. Influence <str<strong>on</strong>g>of</str<strong>on</strong>g> a high<br />
ambient temperature <strong>on</strong> lipid metabolism in the growing pig.<br />
J. Anim. Sci. 79:81–87.<br />
Lin, J. C., B. R. Moss, J. L. Ko<strong>on</strong>, C. A. Flood, S. Rowe, J. R. Martin,<br />
B. Brady, F. Degraves, and R. C. Smith. 1998. <str<strong>on</strong>g>Effect</str<strong>on</strong>g> <str<strong>on</strong>g>of</str<strong>on</strong>g> sprinkling<br />
Reducing <strong>heat</strong> <strong>stress</strong> <str<strong>on</strong>g>of</str<strong>on</strong>g> <strong>feedlot</strong> cattle 3087<br />
over the feed area and misting free stalls <strong>on</strong> milk producti<strong>on</strong>.<br />
Pr<str<strong>on</strong>g>of</str<strong>on</strong>g>. Anim. Sci. 14:102–107.<br />
Mader, T. L. 2003. Envir<strong>on</strong>mental <strong>stress</strong> in c<strong>on</strong>fined beef cattle. J.<br />
Anim. Sci. 81(E. Suppl. 2):110–119.<br />
Mader, T. L., J. M. Dahlquist, and J. B. Gaughan. 1997. Wind protecti<strong>on</strong><br />
and airflow patterns in outside <strong>feedlot</strong>s. J. Anim. Sci.<br />
75:26–36.<br />
Mader, T. L., J. M. Dahlquist, G. L. Hahn, and J. B. Gaughan. 1999a.<br />
Shade and wind barrier effects <strong>on</strong> summertime <strong>feedlot</strong> cattle<br />
performance. J. Anim. Sci. 77:2065–2072.<br />
Mader, T. L., J. B. Gaughan, and B. A. Young. 1999b. Feedlot diet<br />
roughage level for Hereford cattle exposed to excessive <strong>heat</strong> load.<br />
Pr<str<strong>on</strong>g>of</str<strong>on</strong>g>. Anim. Sci. 15:53–62.<br />
Mader, T. L., S. M. Holt, G. L. Hahn, M. S. Davis, and D. E. Spiers.<br />
2002. Feeding <str<strong>on</strong>g>strategies</str<strong>on</strong>g> for managing <strong>heat</strong> load in <strong>feedlot</strong> cattle.<br />
J. Anim. Sci. 80:2373–2382.<br />
Mader, T. L., L. L. Hungerford, J. A. Nienaber, M. J. Buhman, M.<br />
S. Davis, G. L. Hahn, W. M. Cerk<strong>on</strong>ey, and S. M. Holt. 2001.<br />
Heat <strong>stress</strong> mortality in Midwest <strong>feedlot</strong>s. J. Anim. Sci.<br />
79(Suppl. 2):33.<br />
Mader, T. L., and K. F. Lechtenberg. 2000. Growth-promoting systems<br />
for heifer calves and yearlings finished in the <strong>feedlot</strong>. J. Anim.<br />
Sci. 78:2485–2496.<br />
M<strong>on</strong>ty, D. E., and J. L. Garbareno. 1978. Behavioral and physiological<br />
resp<strong>on</strong>ses <str<strong>on</strong>g>of</str<strong>on</strong>g> Holstein-Friesian cows to high envir<strong>on</strong>mental temperatures<br />
and artificial cooling in Ariz<strong>on</strong>a. Am. J. Vet. Res.<br />
39:877–882.<br />
Morris<strong>on</strong>, S. R., R. L. Givens, and G. P. L<str<strong>on</strong>g>of</str<strong>on</strong>g>green. 1973. Sprinkling<br />
cattle for relief from <strong>heat</strong> <strong>stress</strong>. J. Anim. Sci. 36:428–431.<br />
Morris<strong>on</strong>, S. R., M. Prokop, and G. L. L<str<strong>on</strong>g>of</str<strong>on</strong>g>green. 1981. Sprinkling<br />
cattle for <strong>heat</strong> <strong>stress</strong> relief. Activati<strong>on</strong> temperature, durati<strong>on</strong> <str<strong>on</strong>g>of</str<strong>on</strong>g><br />
sprinkling, and pen area sprinkled. Trans. Am. Soc. Agric. Eng.<br />
24:1299–1300.<br />
Murphy, T. A., and S. C. Loerch. 1994. <str<strong>on</strong>g>Effect</str<strong>on</strong>g>s <str<strong>on</strong>g>of</str<strong>on</strong>g> restricted feeding<br />
<str<strong>on</strong>g>of</str<strong>on</strong>g> growing steers <strong>on</strong> performance, carcass characteristics, and<br />
compositi<strong>on</strong>. J. Anim. Sci. 72:2497–2507.<br />
NOAA. 1976. Livestock hot weather <strong>stress</strong>. Operati<strong>on</strong>s Manual Letter<br />
C-31-76. NOAA, Kansas City, MO.<br />
NRC. 1996. Nutrient Requirements <str<strong>on</strong>g>of</str<strong>on</strong>g> Beef Cattle. 7th ed. Natl. Acad.<br />
Press. Washingt<strong>on</strong>, DC.<br />
Prawl, Z. I., W. J. Hill, F. N. Owens, D. R. Gill, and R. L. Ball. 1997.<br />
<str<strong>on</strong>g>Effect</str<strong>on</strong>g>s <str<strong>on</strong>g>of</str<strong>on</strong>g> limiting feed access time <strong>on</strong> performance and carcass<br />
characteristics <str<strong>on</strong>g>of</str<strong>on</strong>g> <strong>feedlot</strong> steers. Pages 68–72 in Oklahoma Agric.<br />
Exp. Stn. Anim. Sci. Res. Rep. P-958, Stillwater.<br />
Reinhardt, C. D., and R. T. Brandt. 1994. <str<strong>on</strong>g>Effect</str<strong>on</strong>g> <str<strong>on</strong>g>of</str<strong>on</strong>g> morning vs. evening<br />
feeding <str<strong>on</strong>g>of</str<strong>on</strong>g> limit-fed Holsteins during summer m<strong>on</strong>ths. Pages<br />
38–39 in Cattlemen’s Day Rep. 704. Kansas State Agric. Exp.<br />
Stn., Manhattan.<br />
Sainz, R. D., F. De la Torre, and J. W. Oltjen. 1995. Compensatory<br />
growth and carcass quality in growth-restricted and refed beef<br />
steers. J. Anim. Sci. 73:2971–2979.<br />
Sepaskhah, A. R., and L. Boersma. 1979. Thermal c<strong>on</strong>ductivity <str<strong>on</strong>g>of</str<strong>on</strong>g><br />
soils as a functi<strong>on</strong> <str<strong>on</strong>g>of</str<strong>on</strong>g> temperature and water c<strong>on</strong>tent. Soil Sci.<br />
Soc. Am. J. 43:439–444.<br />
Soto-Navarro, S. A., G. C. Duff, C. R. Krehbiel, M. L. Gaylean, and<br />
K. J. Malcolm-Callis. 2000. Influence <str<strong>on</strong>g>of</str<strong>on</strong>g> feed intake fluctuati<strong>on</strong>,<br />
feeding frequency, time <str<strong>on</strong>g>of</str<strong>on</strong>g> feeding and rate <str<strong>on</strong>g>of</str<strong>on</strong>g> gain <strong>on</strong> performance<br />
by limit-fed steers. Pr<str<strong>on</strong>g>of</str<strong>on</strong>g>. Anim. Sci. 16:13–20.<br />
Thom, E. C. 1959. The discomfort index. Weatherwise 12:57–59.<br />
Wiersma, F., D. Ray, and C. Roubicek. 1973. Modified envir<strong>on</strong>ment<br />
for beef in hot climates. Trans. Am. Soc. Agric. Eng. 16:348-353.<br />
Zinn, R. A. 1994. Influence <str<strong>on</strong>g>of</str<strong>on</strong>g> fluctuating feed intake <strong>on</strong> <strong>feedlot</strong> cattle<br />
growth-performance and digestive functi<strong>on</strong>. Pages 77–83 in Proc.<br />
Southwest Nutr. Manage. C<strong>on</strong>f., Univ. <str<strong>on</strong>g>of</str<strong>on</strong>g> Ariz<strong>on</strong>a, Tucs<strong>on</strong>.<br />
Zinn, R. A. 1994. Influence <str<strong>on</strong>g>of</str<strong>on</strong>g> fluctuating feed intake <strong>on</strong> <strong>feedlot</strong> cattle<br />
growth-performance and digestive functi<strong>on</strong>. Pages 77–83 in Proc.<br />
Southwest Nutr. Manage. C<strong>on</strong>f., University <str<strong>on</strong>g>of</str<strong>on</strong>g> Ariz<strong>on</strong>a, Tucs<strong>on</strong>.